

Association between tea consumption and prevention of coronary artery disease: A systematic review and dose-response meta-analysis
- PMID: 36505265
- PMCID: PMC9729734
- DOI: 10.3389/fnut.2022.1021405
Association between tea consumption and prevention of coronary artery disease: A systematic review and dose-response meta-analysis
Abstract
Background: Evidence from previous studies reporting on the relationship between tea consumption and its preventive effect on coronary artery disease (CAD) has conflicting outcomes. With the accumulation of new clinical evidence, we conducted this meta-analysis to assess tea consumption and CAD risk.
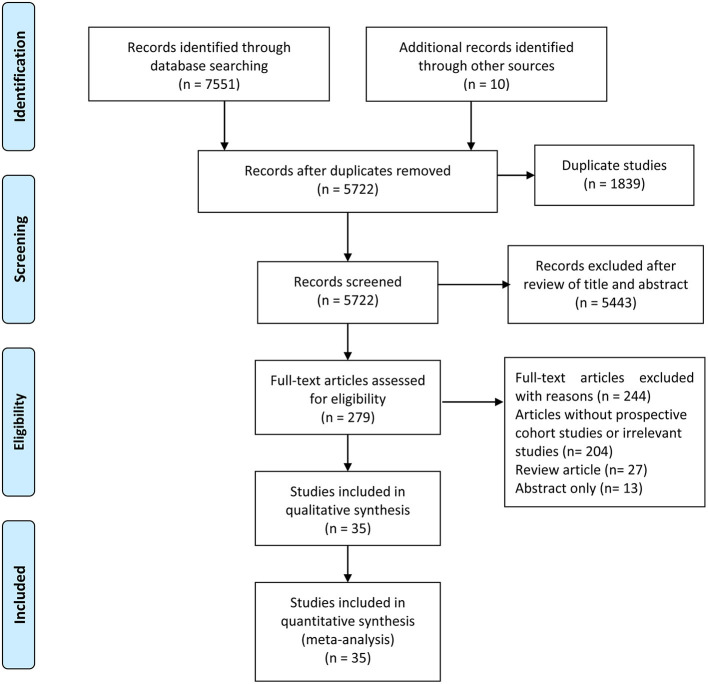
Methods: We searched PubMed, EMBASE, Cochrane Library, and Medline databases for published observational studies from their inception to May 2022. A random-effects model was used to calculate risk ratios with 95% confidence intervals. We also conducted linear and non-linear dose-response meta-analyses to analyze the association. We regarded that one cup equals 237 mL. Subgroup analyses and univariate meta-regression were conducted to explore the source of heterogeneity.
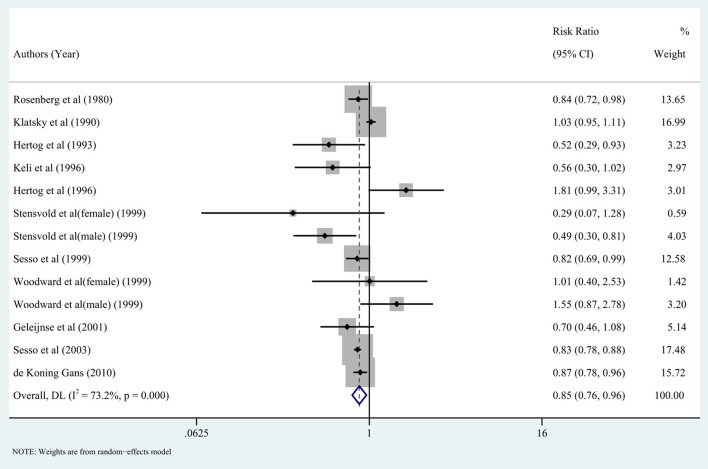
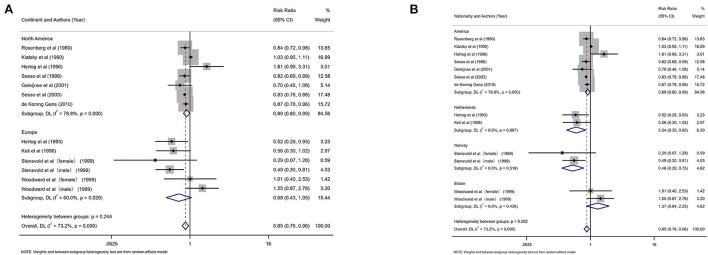
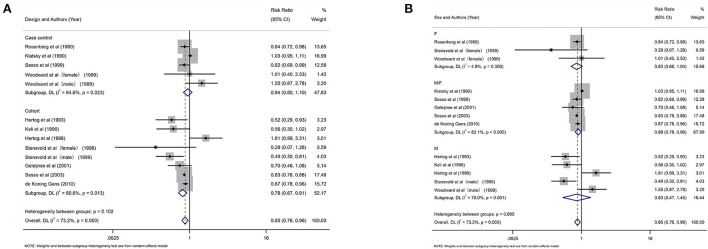
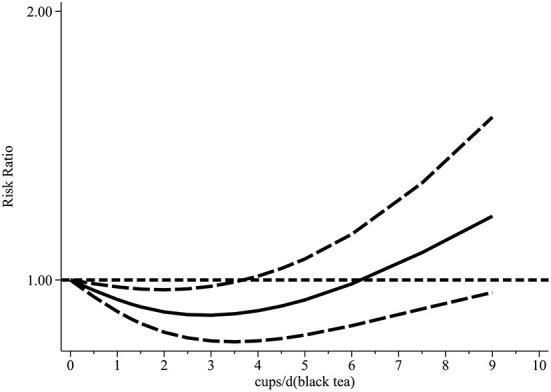
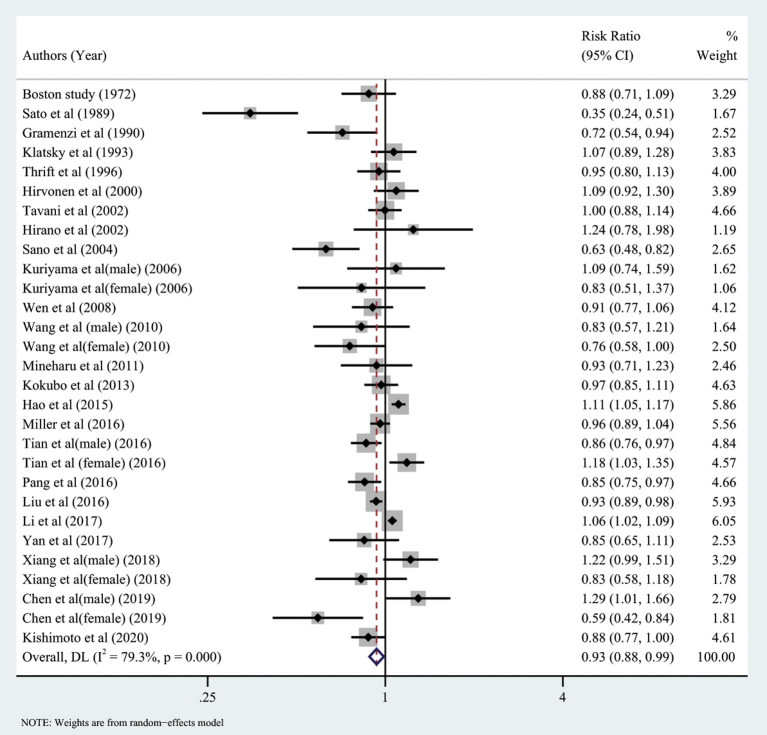
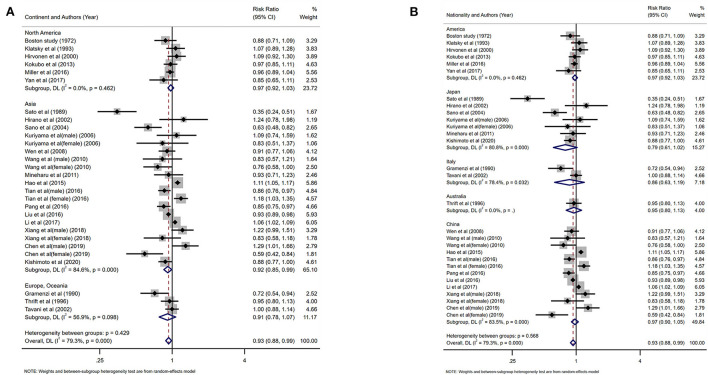
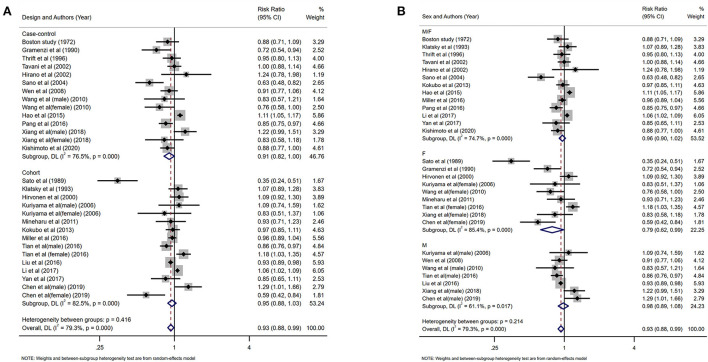
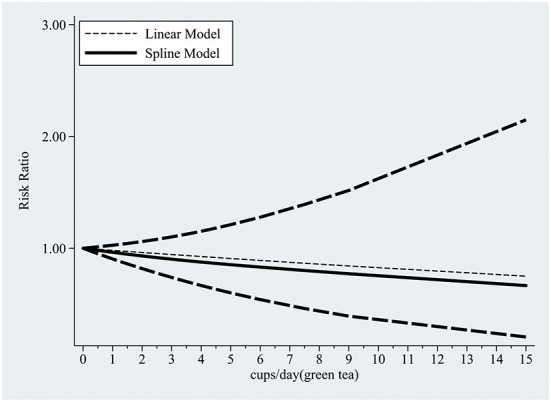
Results: A total of 35 studies, including 24 on green tea and 11 on black tea consumption, were included in this meta-analysis. An inverse association for the risk of CAD was observed for black tea (RR: 0.85; 95% CI: 0.76, 0.96) and green tea (RR: 0.93; 95% CI: 0.88, 0.99). The dose-response meta-analysis showed that drinking less than four cups of black tea daily may effectively prevent CAD, while more than 4-6 cups/d will promote disease risk. Furthermore, the dose-response relationship between green tea consumption and the prevention of CAD showed that the risk of CAD gradually decreased as green tea consumption increased. We also demonstrated that the more cups of green tea consumed, the lower the risk of CAD. In the subgroup analysis by continent, a significant negative correlation between CAD risk and green tea consumption was observed in the Asian population (RR: 0.92; 95% CI: 0.85, 0.99) but not in the western population [North America (RR: 0.97; 95% CI: 0.92, 1.03), Europe/Oceana (RR: 0.91; 95% CI: 0.78, 1.07)].
Conclusions: Higher green tea consumption was associated with reduced CAD risk, but drinking more than 4-6 cups of black tea per day may increase the risk. This study offers new insight into the relationship between tea consumption and its preventive effect on CAD. However, further large prospective cohort studies are needed to validate these findings.
Systematic review registration: The protocol of this systematic review was registered in the International Prospective Register of Systematic Reviews (PROSPERO) system (CRD42022348069).
Keywords: cardiovascular disease; coronary artery disease; dose-response; meta-analysis; tea.
Copyright © 2022 Yang, Dai, Deng, Zhang, Quan, Giri and Shen.
Conflict of interest statement
The authors declare that the research was conducted in the absence of any commercial or financial relationships that could be construed as a potential conflict of interest. The handling editor declared a shared parent affiliation with the authors at the time of review.
Figures
Similar articles
-
Black and green tea consumption and the risk of coronary artery disease: a meta-analysis.Am J Clin Nutr. 2011 Mar;93(3):506-15. doi: 10.3945/ajcn.110.005363. Epub 2011 Jan 19. Am J Clin Nutr. 2011. PMID: 21248184
-
Green tea consumption and the risk of coronary heart disease: A systematic review and meta-analysis of cohort studies.Nutr Metab Cardiovasc Dis. 2023 Apr;33(4):715-723. doi: 10.1016/j.numecd.2023.01.017. Epub 2023 Jan 29. Nutr Metab Cardiovasc Dis. 2023. PMID: 36849317
-
[A dose-response meta-analysis on the relationship between daily tea intake and cardiovascular mortality based on the GRADE system].Zhonghua Xin Xue Guan Bing Za Zhi. 2021 May 24;49(5):496-502. doi: 10.3760/cma.j.cn112148-20200726-00592. Zhonghua Xin Xue Guan Bing Za Zhi. 2021. PMID: 34034384 Chinese.
-
Green tea (Camellia sinensis) for the prevention of cancer.Cochrane Database Syst Rev. 2020 Mar 2;3(3):CD005004. doi: 10.1002/14651858.CD005004.pub3. Cochrane Database Syst Rev. 2020. PMID: 32118296 Free PMC article.
-
Green tea, black tea consumption and risk of lung cancer: a meta-analysis.Lung Cancer. 2009 Sep;65(3):274-83. doi: 10.1016/j.lungcan.2008.12.002. Epub 2009 Jan 6. Lung Cancer. 2009. PMID: 19128856
Cited by
-
The role of tea in managing cardiovascular risk factors: potential benefits, mechanisms, and interventional strategies.Front Nutr. 2025 Apr 24;12:1530012. doi: 10.3389/fnut.2025.1530012. eCollection 2025. Front Nutr. 2025. PMID: 40342365 Free PMC article. Review.
-
Sex differences in the associations of water, coffee and tea consumption with cardiovascular diseases: a prospective cohort study.Front Nutr. 2025 Jan 30;12:1530908. doi: 10.3389/fnut.2025.1530908. eCollection 2025. Front Nutr. 2025. PMID: 39949547 Free PMC article.
-
Tea and coffee consumption and the 15-Year risk of cardiovascular events: the Isfahan cohort study (ICS).Nutr J. 2025 Feb 25;24(1):30. doi: 10.1186/s12937-025-01093-w. Nutr J. 2025. PMID: 40001172 Free PMC article.
-
Evaluating the effect of green tea intake on cardiovascular diseases: A Mendelian randomization study in European and East Asian populations.Medicine (Baltimore). 2024 Jul 19;103(29):e38977. doi: 10.1097/MD.0000000000038977. Medicine (Baltimore). 2024. PMID: 39029022 Free PMC article.
-
Long-term consumption of green tea protects the mental health of middle-aged and older adult men by improving inflammation levels.Front Public Health. 2025 Feb 25;13:1531953. doi: 10.3389/fpubh.2025.1531953. eCollection 2025. Front Public Health. 2025. PMID: 40071113 Free PMC article.
References
Publication types
LinkOut - more resources
Full Text Sources
Miscellaneous