. 2022 Nov 23:13:956907.
doi: 10.3389/fimmu.2022.956907. eCollection 2022.

Nasal administration of anti-CD3 monoclonal antibody modulates effector CD8+ T cell function and induces a regulatory response in T cells in human subjects

Affiliations

Nasal administration of anti-CD3 monoclonal antibody modulates effector CD8+ T cell function and induces a regulatory response in T cells in human subjects

Tanuja Chitnis et al. Front Immunol. .

Abstract

Background: Parenteral anti-CD3 Mab (OKT3) has been used to treat transplant rejection and parental administration of a humanized anti-CD3 Mab (Teplizumab) showed positive effects in diabetes. Nasal administration of anti-CD3 Mab has not been carried out in humans. Nasal anti-CD3 Mab suppresses autoimmune diseases and central nervous system (CNS) inflammation in animal models. We investigated the safety and immune effects of a fully humanized, previously uncharacterized nasal anti-CD3 Mab (Foralumab) in humans and its in vitro stimulatory properties.

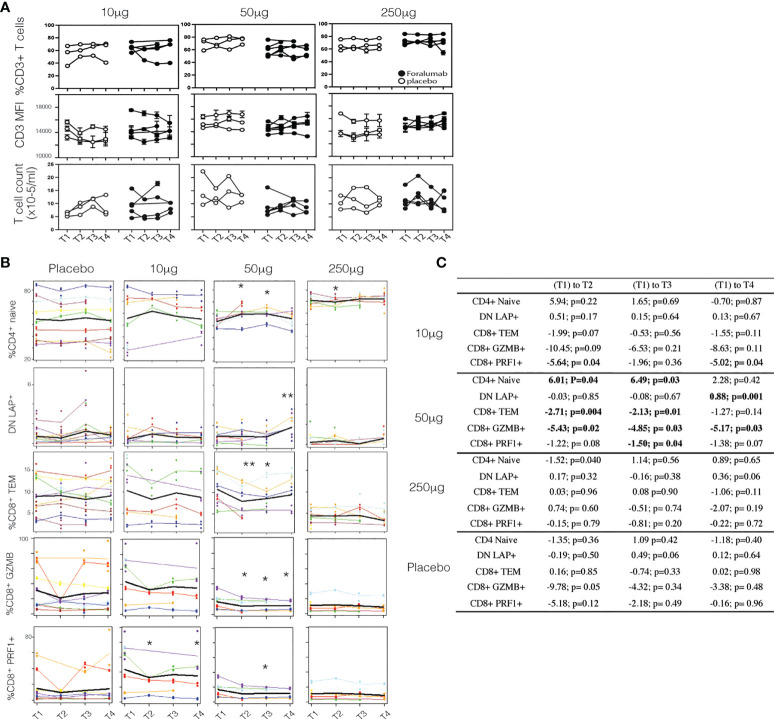
Methods: In vitro, Foralumab were compared to UCHT1 anti-human CD3 mAb. For human administration, 27 healthy volunteers (9 per group) received nasal Foralumab or placebo at a dose of 10ug, 50ug, or 250ug daily for 5 days. Safety was assessed and immune parameters measured on day 1 (pre-treatment), 7, 14, and 30 by FACS and by scRNAseq.

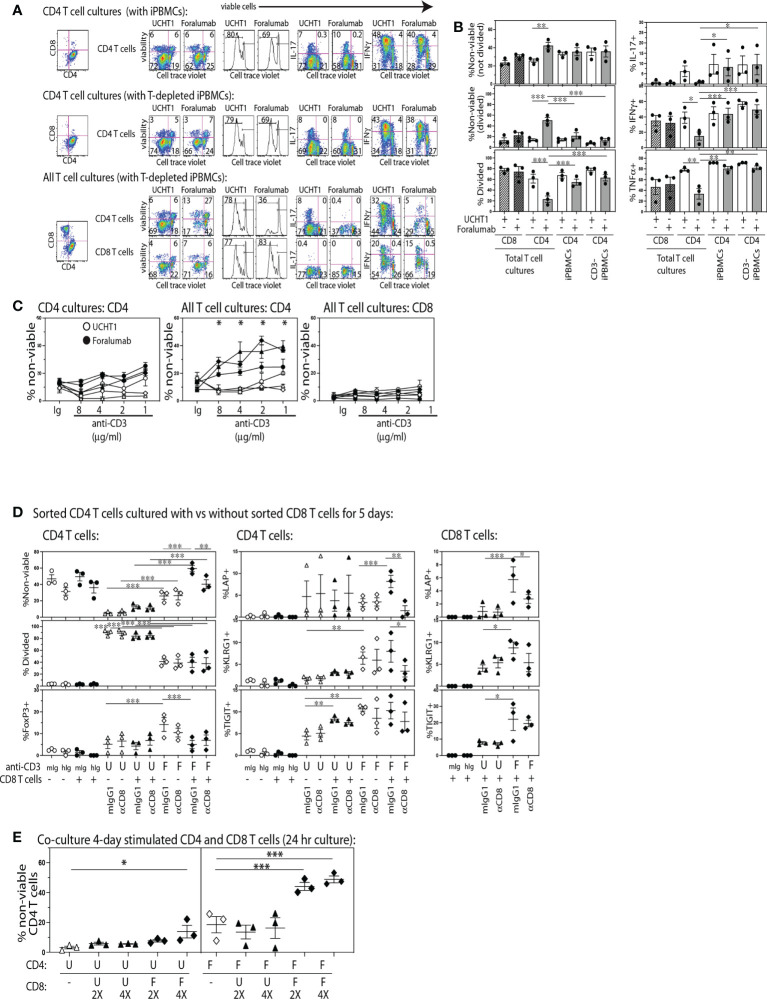
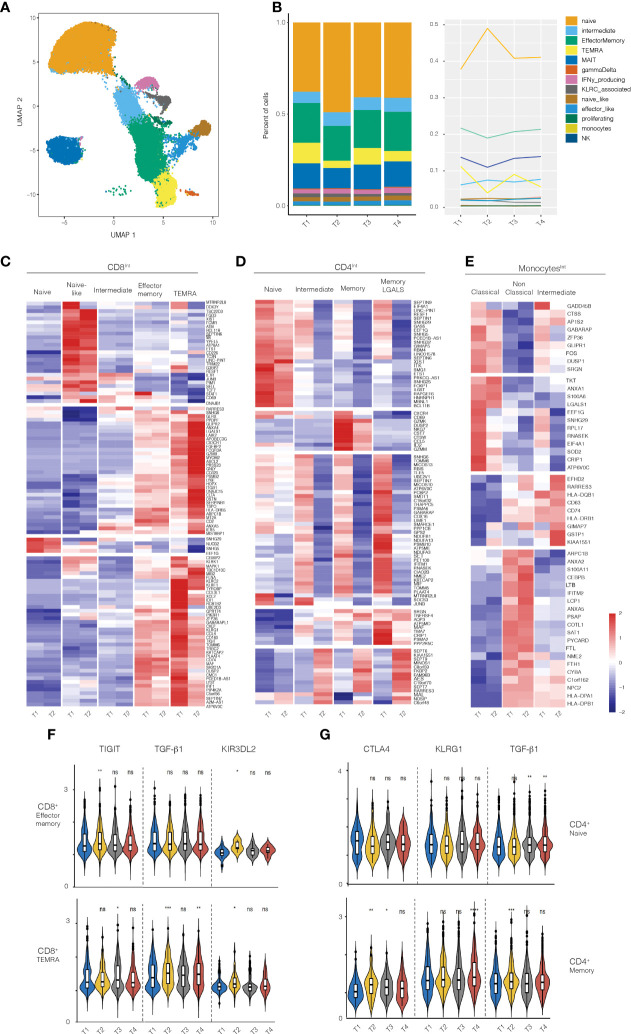
Results: In vitro, Foralumab preferentially induced CD8+ T cell stimulation, reduced CD4+ T cell proliferation and lowered expression of IFNg, IL-17 and TNFa. Foralumab induced LAP, TIGIT, and KLRG1 immune checkpoint molecules on CD8+ and CD4+ T cells in a mechanism independent of CD8 T cells. In vivo, nasal Foralumab did not modulate CD3 from the T cell surface at any dose. Immune effects were primarily observed at the 50ug dose and consisted of reduction of CD8+ effector memory cells, an increase in naive CD8+ and CD4+ T cells, and reduced CD8+ T cell granzyme B and perforin expression. Differentially expressed genes observed by scRNAseq in CD8+ and CD4+ populations promoted survival and were anti-inflammatory. In the CD8+ TEMRA population there was induction of TIGIT, TGFB1 and KIR3DL2, indicative of a regulatory phenotype. In the memory CD4+ population, there was induction of CTLA4, KLRG1, and TGFB whereas there was an induction of TGF-B1 in naïve CD4+ T cells. In monocytes, there was induction of genes (HLA-DP, HLA-DQ) that promote a less inflammatory immune response. No side effects were observed, and no subjects developed human anti-mouse antibodies.

Conclusion: These findings demonstrate that nasal Foralumab is safe and immunologically active in humans and presents a new avenue for the treatment of autoimmune and CNS diseases.

Keywords: CD8+ T cells; Foralumab; Tregs; immunomodulation; nasal anti-CD3.


Conflict of interest statement

WC was employed by Clementi, Ltd. HLW is chair of the scientific advisory board of Tiziana Life Sciences and received consulting fees and stock options from the company. KS is an employee of Tiziana Life Sciences. TC is a member of the scientific advisory board and serves as a consultant to Tiziana Life Sciences. CMB-A serves as a consultant to Tiziana Life Sciences. The remaining authors declare that the research was conducted in the absence of any commercial or financial relationships that could be construed as a potential conflict of interest.

Figures

Figure 1
Figure 1
The Foralumab anti-CD3 mAb exhibits unique in vitro stimulation properties via its capacity to induce regulatory function in CD8 T cells. (A) Representative FACs plots are shown for the changes in viability, proliferation and cytokine expression by cell trace labeled CD4 T cells when stimulated with UCHT1/IL2 or Foralumab/IL2 when purified or in the presence of non-CD4 T cells, and irradiated PBMCs (with and without T cell depletion) as APCs. (B) Graphical analysis of changes in features within the cell trace diluted CD4 T cells (from three healthy donors) in response to the different culture conditions. (C) Changes in viability was examined in a dose response of 5,000 T cells stimulated with Foralumab/IL2 (filled) vs UCHT1/IL-2 (open) as compared to mIgG1/IL-2 or huIgG1/IL-2. Viability was determined at 5 days by e506 staining. (D) FACS-sorted total CD4 T cells were stimulated alone (open) or together with autologous FACS-sorted CD8 T cells (filled) with mIgG1 (isotype for UCHT1), huIgG1 (isotype for Foralumab), UCHT1 or Foralumab. All in the presence of IL-2 (5U/ml), and T cell depleted irradiated PBMCS as APCs. On day 5, the cultures were harvested and measured for viability, proliferation, and surface expression of LAP, KLRG1 and TIGIT, and intracellular FoxP3. (E) CD8 T cells that were stimulated with Foralumab for 4 days were tested for the capacity to kill activated UCHT1 or Foralumab stimulated CD4 T cells. On day 4, the different anti-CD3 stimulated CD4 and CD8 T cells were harvested, washed and re-plated in all combinations in the presence of IL-2 (5U/ml) at the indicated ratios (5,000 CD4 and 2X or 4X activated CD8 T cells). The information for the isotypes reflected features expressed by cell trace high populations as there was no proliferation. For all graphs, significance was determined by One-Way ANOVA with Sidak’s correction for multiple comparisons, * p<0.05, **p<0.01, ***p<0.005.
Figure 2
Figure 2
Surface CD3 and Foralumab dosing (A) Longitudinal PBMCs were stained for CD3 and measured for changes in frequency of CD3+ cells, the intensity of CD3 (MFI) and total T cell counts as compared to baseline (T1) levels. (B) Lineage and differentiation markers in 10ug, 50ug, 250ug and placebo groups. CD4+CD45RA+CD27+ are CD4+ naïve; CD3+CD4-CD8- are DN LAP+; CD8+CD45RA-CD27- CD8 Tem; GZMB+ and PRF1+ in total CD8+ cells is shown. (C) Shows the change with time was estimated using a linear mixed effects model with a fixed categorical effect of time and a random intercept. *p<0.05, **p<0.001). N=6, placebo N=6.
Figure 3
Figure 3
RNA-seq analysis on PBMCs from healthy volunteers treated with 50ug of Foralumab. (A) Graphical depiction of the single cell analysis of the CD8+ population isolated from PBMCs showing the cell types that were defined by the clusters based on unbiased DEG the changes in CD8 maturational state subsets derived from the scRNA data in aggregated bar (B) graphs or line graph analyses. (C) Different maturational subsets of CD8 T cells show unique DEG between baseline (T1) and T2. Heatmap presentation of the genes that exhibited increased or decreased expression from baseline after Foralumab treatment. Gene expression values were used to separate the cells into naïve CD8 T cells, naïve-like CD8 T cells (differed from naïve in expression of top group of genes), intermediate CD8 T cells (exhibited features of both naïve and memory cells), effector memory, and TEMRA. (D) Different maturational subsets of CD4 T cells Gene expression values were used to separate the cells into naïve CD4 T cells, intermediate CD4 T cells (exhibited features of both naïve and memory cells), memory CD4, and memory CD4 with strong GALS1 gene expression. (E) Different functional subsets of monocytes. Gene expression values were used to separate the cells into classical, non-classical and intermediate subsets. (F) Violin plots showing changes in expression of TIGIT, TGFb1 and KIR3DL2 in CD8 effector memory and CD8 TEMRA cells. (G) Violin plots showing changes in expression of CTLA4, KLRG1, and TGFb1 in naïve CD4 T cells and memory CD4 T cells. Unpaired two-sided T-test against timepoint 1 (T1vT2, T1vT3, T1vT4) was used to get the posted significance score if it changed from the baseline. *p<0.05, **p<0.001, ***p<0.0001, ****P<0.0001, ns, not significant).
Figure 4
Figure 4
Serum IgG and IgM antibody reactivity in patients treated with 50ug. Heatmap representing the mean delta change from Timepoint 1(baseline) to Timepoint 2 (day 7) for: IgG (A) and IgM (B) antibody reactivity in serum samples from patients. (C) Volcano plot representing differential IgG and IgM antibody reactivity. Cut-off criteria was defined as p-value < 0.05 and log2 fold change > 1 or < −1.

References

    1. Kuhn C, Weiner HL. Therapeutic anti-CD3 monoclonal antibodies: from bench to bedside. Immunotherapy (2016) 8(8):889–906. doi: 10.2217/imt-2016-0049 - DOI - PubMed
    1. Hooks MA, Wade CS, Millikan WJ., Jr. Muromonab CD-3: a review of its pharmacology, pharmacokinetics, and clinical use in transplantation. Pharmacotherapy (1991) 11(1):26–37. doi: 10.1212/wnl.41.7.1047 - DOI - PubMed
    1. Weinshenker BG, Bass B, Karlik S, Ebers GC, Rice GP. An open trial of OKT3 in patients with multiple sclerosis. Neurology (1991) 41(7):1047–52. doi: 10.1212/WNL.41.7.1047 - DOI - PubMed
    1. Sgro C. Side-effects of a monoclonal antibody, muromonab CD3/orthoclone OKT3: bibliographic review. Toxicology (1995) 105(1):23–9. doi: 10.1016/0300-483X(95)03123-W - DOI - PubMed
    1. Herold KC, Hagopian W, Auger JA, Poumian-Ruiz E, Taylor L, Donaldson D, et al. . Anti-CD3 monoclonal antibody in new-onset type 1 diabetes mellitus. N Engl J Med (2002) 346(22):1692–8. doi: 10.1056/NEJMoa012864 - DOI - PubMed

MeSH terms