

Identification of two robust subclasses of sepsis with both prognostic and therapeutic values based on machine learning analysis
- PMID: 36505503
- PMCID: PMC9732458
- DOI: 10.3389/fimmu.2022.1040286
Identification of two robust subclasses of sepsis with both prognostic and therapeutic values based on machine learning analysis
Abstract
Background: Sepsis is a heterogeneous syndrome with high morbidity and mortality. Optimal and effective classifications are in urgent need and to be developed.
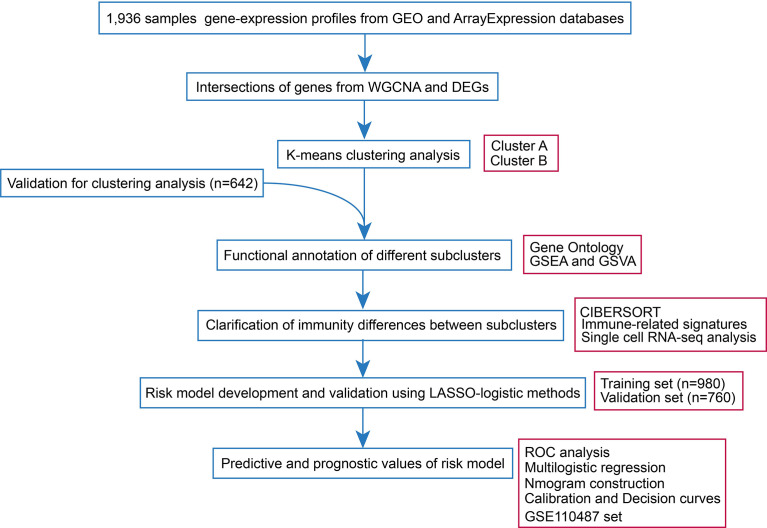
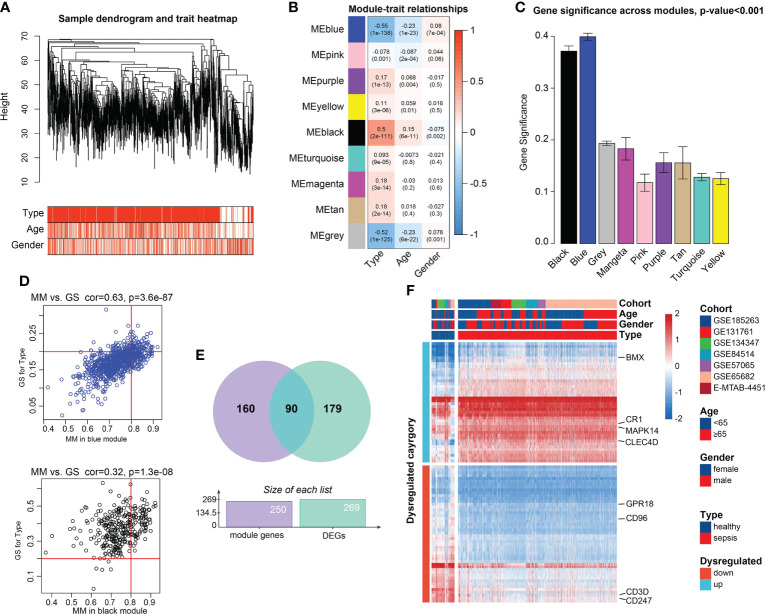
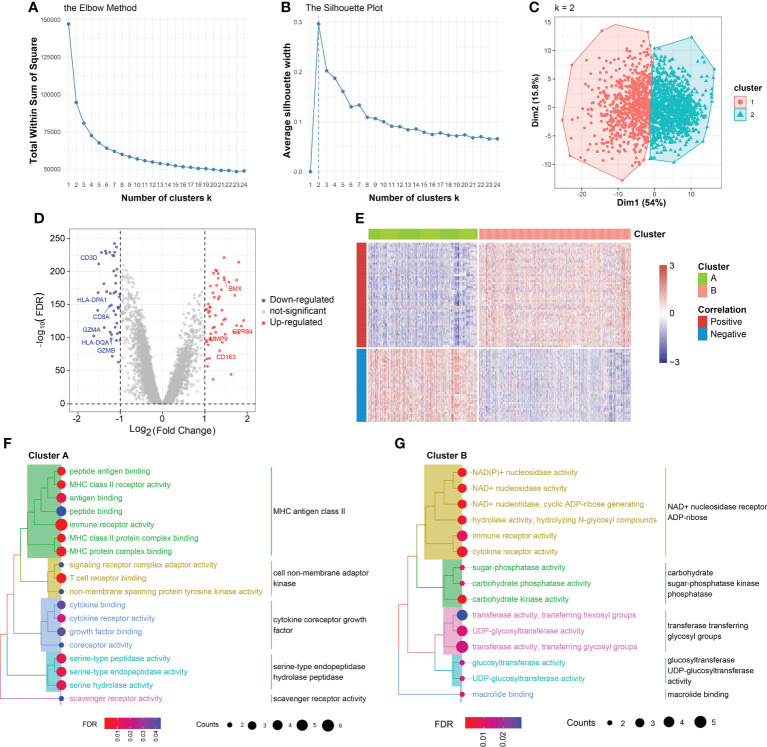
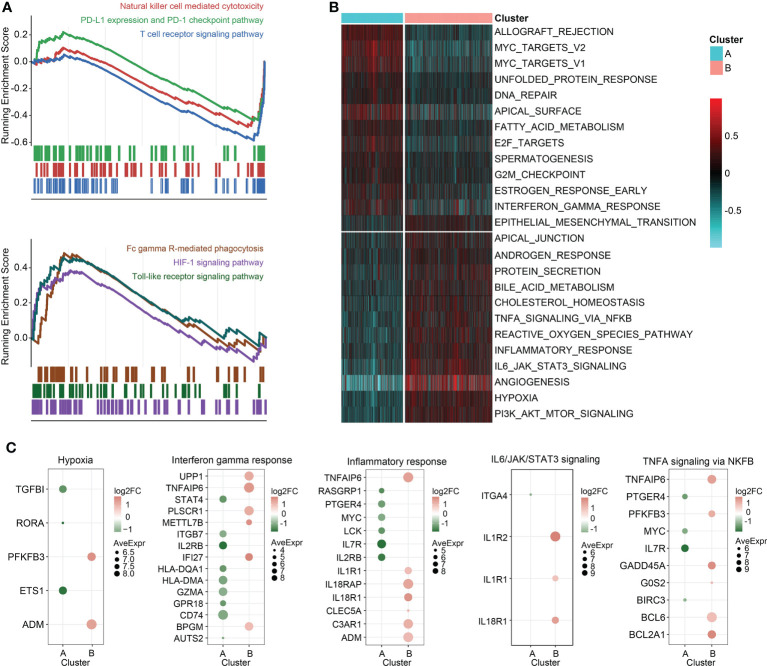
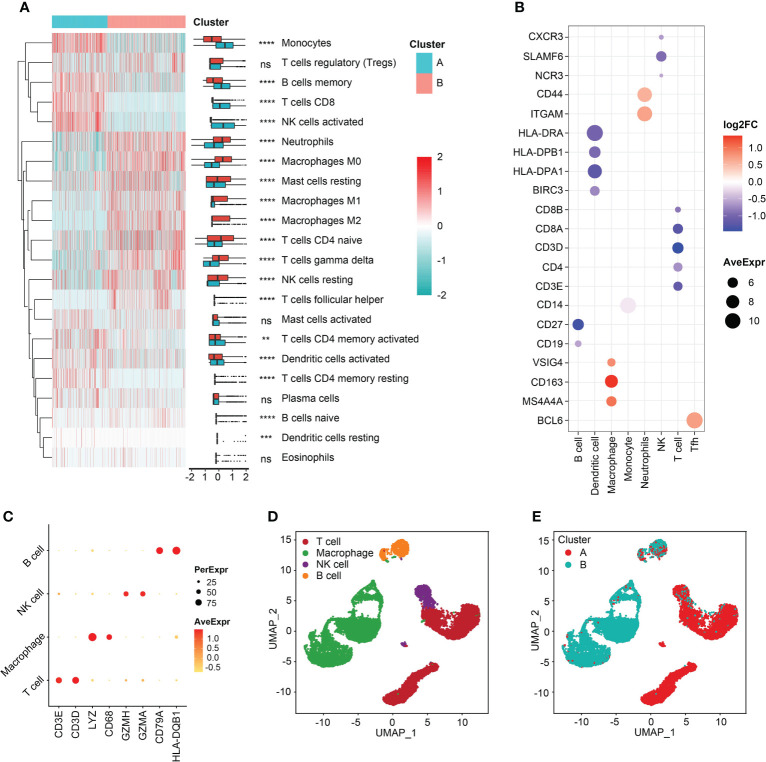
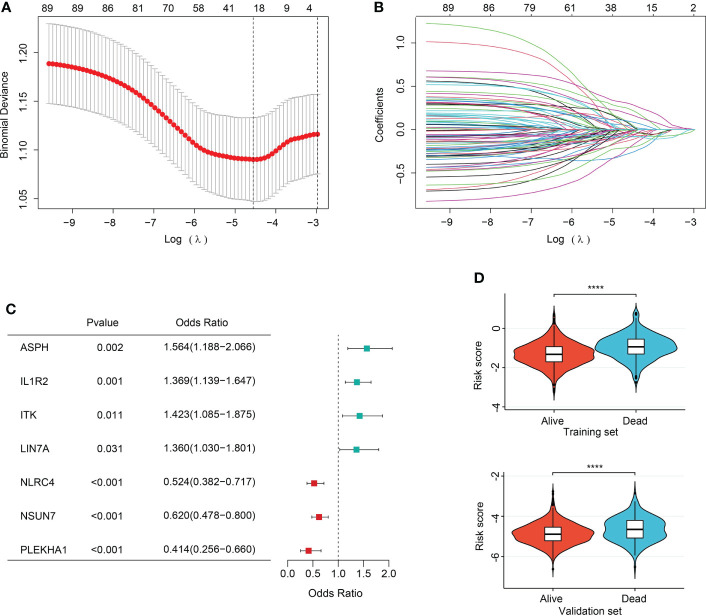
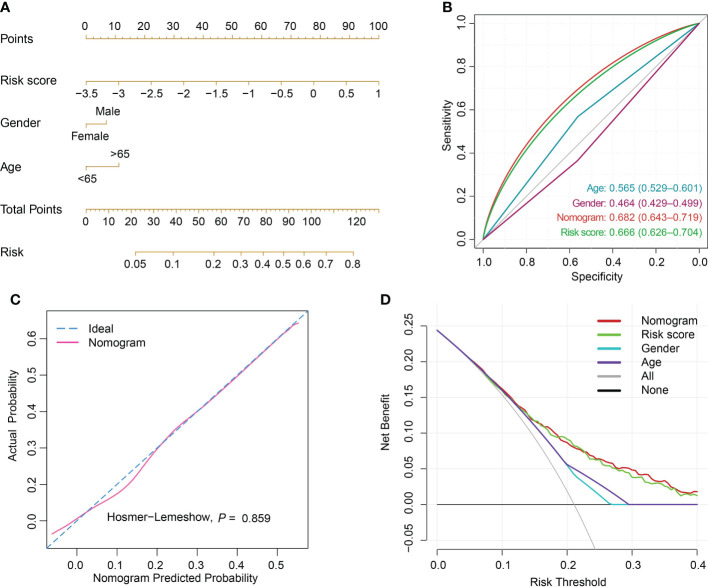
Methods and results: A total of 1,936 patients (sepsis samples, n=1,692; normal samples, n=244) in 7 discovery datasets were included to conduct weighted gene co-expression network analysis (WGCNA) to filter out candidate genes related to sepsis. Then, two subtypes of sepsis were classified in the training sepsis set (n=1,692), the Adaptive and Inflammatory, using K-means clustering analysis on 90 sepsis-related features. We validated these subtypes using 617 samples in 5 independent datasets and the merged 5 sets. Cibersort method revealed the Adaptive subtype was related to high infiltration levels of T cells and natural killer (NK) cells and a better clinical outcome. Immune features were validated by single-cell RNA sequencing (scRNA-seq) analysis. The Inflammatory subtype was associated with high infiltration of macrophages and a disadvantageous prognosis. Based on functional analysis, upregulation of the Toll-like receptor signaling pathway was obtained in Inflammatory subtype and NK cell-mediated cytotoxicity and T cell receptor signaling pathway were upregulated in Adaptive group. To quantify the cluster findings, a scoring system, called, risk score, was established using four datasets (n=980) in the discovery cohorts based on least absolute shrinkage and selection operator (LASSO) and logistic regression and validated in external sets (n=760). Multivariate logistic regression analysis revealed the risk score was an independent predictor of outcomes of sepsis patients (OR [odds ratio], 2.752, 95% confidence interval [CI], 2.234-3.389, P<0.001), when adjusted by age and gender. In addition, the validation sets confirmed the performance (OR, 1.638, 95% CI, 1.309-2.048, P<0.001). Finally, nomograms demonstrated great discriminatory potential than that of risk score, age and gender (training set: AUC=0.682, 95% CI, 0.643-0.719; validation set: AUC=0.624, 95% CI, 0.576-0.664). Decision curve analysis (DCA) demonstrated that the nomograms were clinically useful and had better discriminative performance to recognize patients at high risk than the age, gender and risk score, respectively.
Conclusions: In-depth analysis of a comprehensive landscape of the transcriptome characteristics of sepsis might contribute to personalized treatments and prediction of clinical outcomes.
Keywords: LASSO; clinical outcomes; clustering; logistic regression; sepsis.
Copyright © 2022 Zhou, Zhang, Zhuang, Zhang and Zhong.
Conflict of interest statement
The authors declare that the research was conducted in the absence of any commercial or financial relationships that could be construed as a potential conflict of interest.
Figures
Similar articles
-
Prognostic stratification of sepsis through DNA damage response based RiskScore system: insights from single-cell RNA-sequencing and transcriptomic profiling.Front Immunol. 2024 Feb 9;15:1345321. doi: 10.3389/fimmu.2024.1345321. eCollection 2024. Front Immunol. 2024. PMID: 38404591 Free PMC article.
-
Exploring the Role of Circadian Rhythm-Related Genes in the Identification of Sepsis Subtypes and the Construction of Diagnostic Models Based on RNA-seq and scRNA-seq.Int J Mol Sci. 2025 Apr 23;26(9):3993. doi: 10.3390/ijms26093993. Int J Mol Sci. 2025. PMID: 40362233 Free PMC article.
-
A prognostic nomogram integrating novel biomarkers identified by machine learning for cervical squamous cell carcinoma.J Transl Med. 2020 Jun 5;18(1):223. doi: 10.1186/s12967-020-02387-9. J Transl Med. 2020. PMID: 32503630 Free PMC article.
-
Immune-associated molecular classification and prognosis signature of sepsis.PLoS One. 2025 Jun 12;20(6):e0326083. doi: 10.1371/journal.pone.0326083. eCollection 2025. PLoS One. 2025. PMID: 40504881 Free PMC article.
-
A nomogram model based on the number of examined lymph nodes-related signature to predict prognosis and guide clinical therapy in gastric cancer.Front Immunol. 2022 Nov 2;13:947802. doi: 10.3389/fimmu.2022.947802. eCollection 2022. Front Immunol. 2022. PMID: 36405735 Free PMC article.
Cited by
-
Activation of thousands of genes in the lungs and kidneys by sepsis is countered by the selective nuclear blockade.Front Immunol. 2023 Aug 11;14:1221102. doi: 10.3389/fimmu.2023.1221102. eCollection 2023. Front Immunol. 2023. PMID: 37638006 Free PMC article.
-
Integrated multi-omics and artificial intelligence to explore new neutrophils clusters and potential biomarkers in sepsis with experimental validation.Front Immunol. 2024 May 29;15:1377817. doi: 10.3389/fimmu.2024.1377817. eCollection 2024. Front Immunol. 2024. PMID: 38868781 Free PMC article.
-
Glucocorticoid therapy for sepsis in the AI era: a survey on current and future approaches.Comput Struct Biotechnol J. 2024 Apr 12;24:292-305. doi: 10.1016/j.csbj.2024.04.020. eCollection 2024 Dec. Comput Struct Biotechnol J. 2024. PMID: 38681133 Free PMC article. Review.
-
Blood from septic patients with necrotising soft tissue infection treated with hyperbaric oxygen reveal different gene expression patterns compared to standard treatment.BMC Med Genomics. 2025 Jan 14;18(1):12. doi: 10.1186/s12920-024-02075-3. BMC Med Genomics. 2025. PMID: 39810178 Free PMC article.
-
Fucosylated haptoglobin promotes inflammation via Mincle in sepsis: an observational study.Nat Commun. 2025 Feb 4;16(1):1342. doi: 10.1038/s41467-025-56524-3. Nat Commun. 2025. PMID: 39904983 Free PMC article.
References
MeSH terms
LinkOut - more resources
Full Text Sources
Medical