

Construction and validation of a prognostic nomogram in metastatic breast cancer patients of childbearing age: A study based on the SEER database and a Chinese cohort
- PMID: 36505800
- PMCID: PMC9732809
- DOI: 10.3389/fonc.2022.999873
Construction and validation of a prognostic nomogram in metastatic breast cancer patients of childbearing age: A study based on the SEER database and a Chinese cohort
Abstract
Introduction: Cancer in patients of childbearing age continues to become increasingly common. The purpose of this study was to explore the impact of metastatic breast cancer (MBC) on overall survival (OS) and cancer-specifific survival (CSS) in patients of childbearing age and to construct prognostic nomograms to predict OS and CSS.
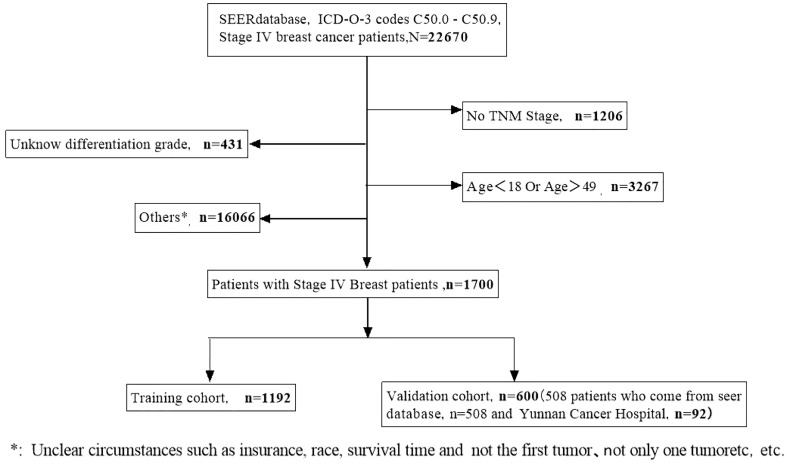
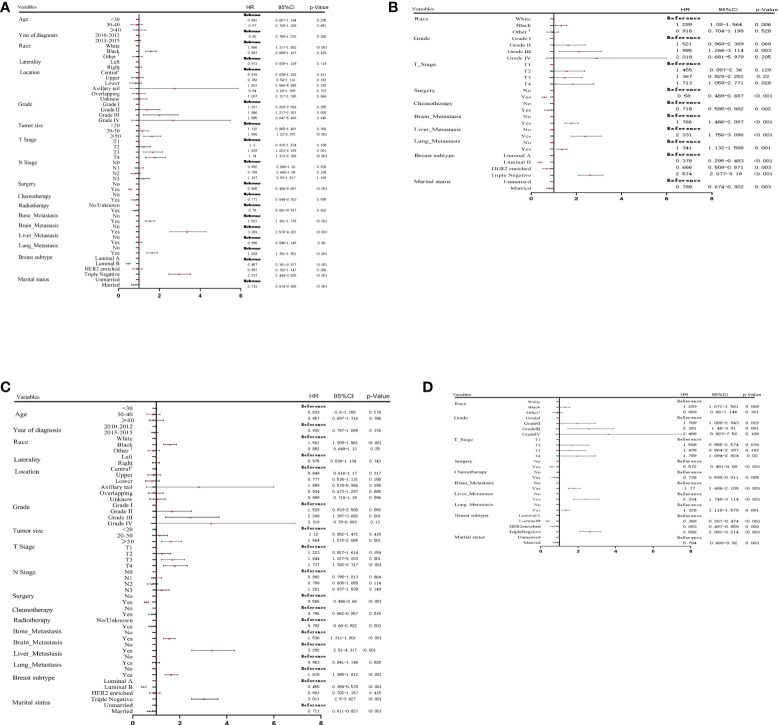
Methods: Data from MBC patients of childbearing age were obtained from the Surveillance, Epidemiology, and End Results (SEER) database between 2010 and 2015, and the patients were randomly assigned into the training and validation cohorts. Univariate and multivariate Cox analyses were used to search for independent prognostic factors impacting OS and CSS, and these data were used to construct nomograms. The concordance index (C-index), area under the curve (AUC), and calibration curves were used to determine the predictive accuracy and discriminative ability of the nomograms. Additional data were obtained from patients at the Yunnan Cancer Hospital to further verify the accuracy of the nomograms.
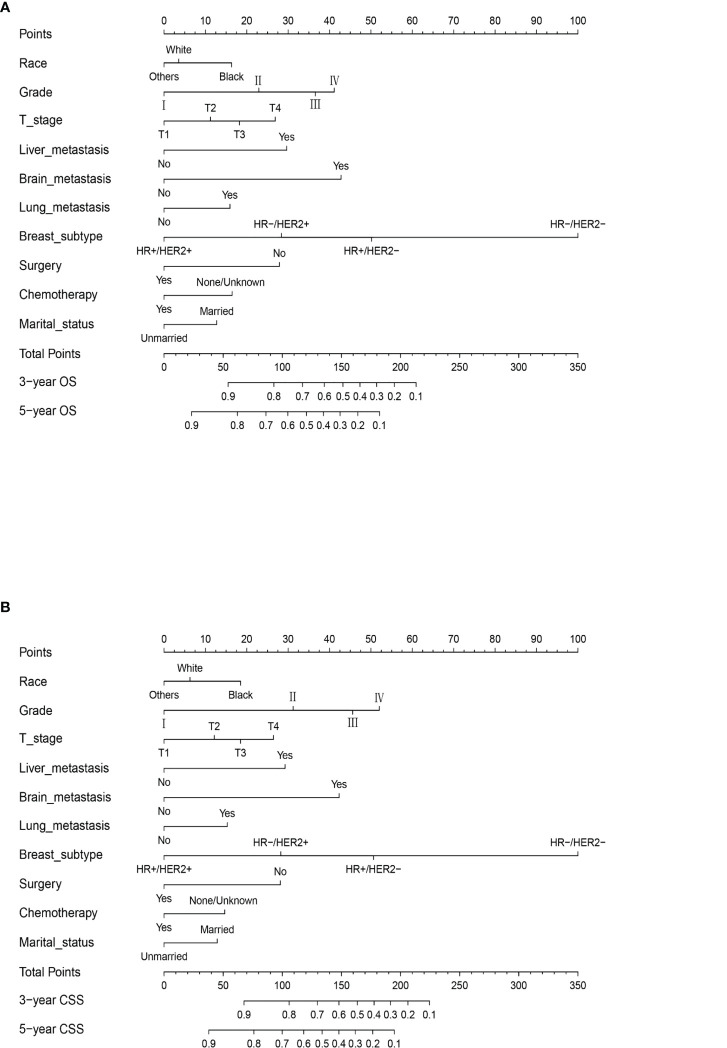
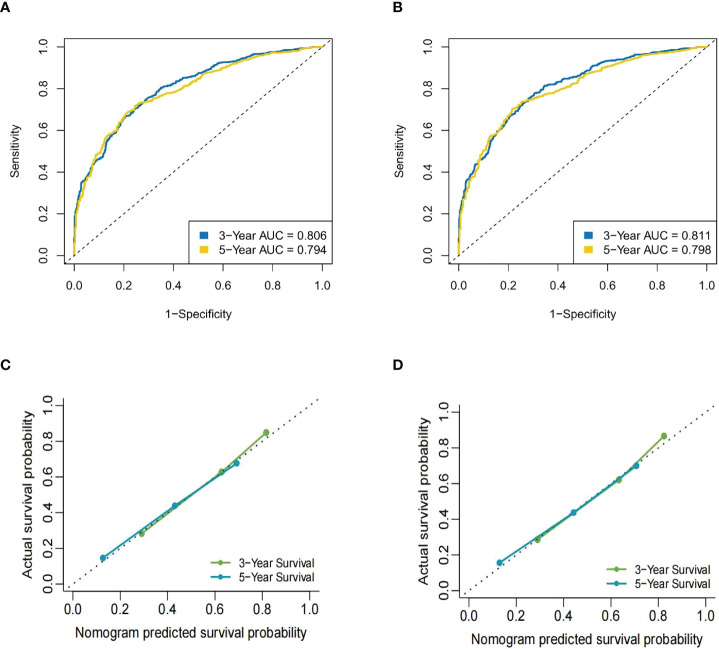
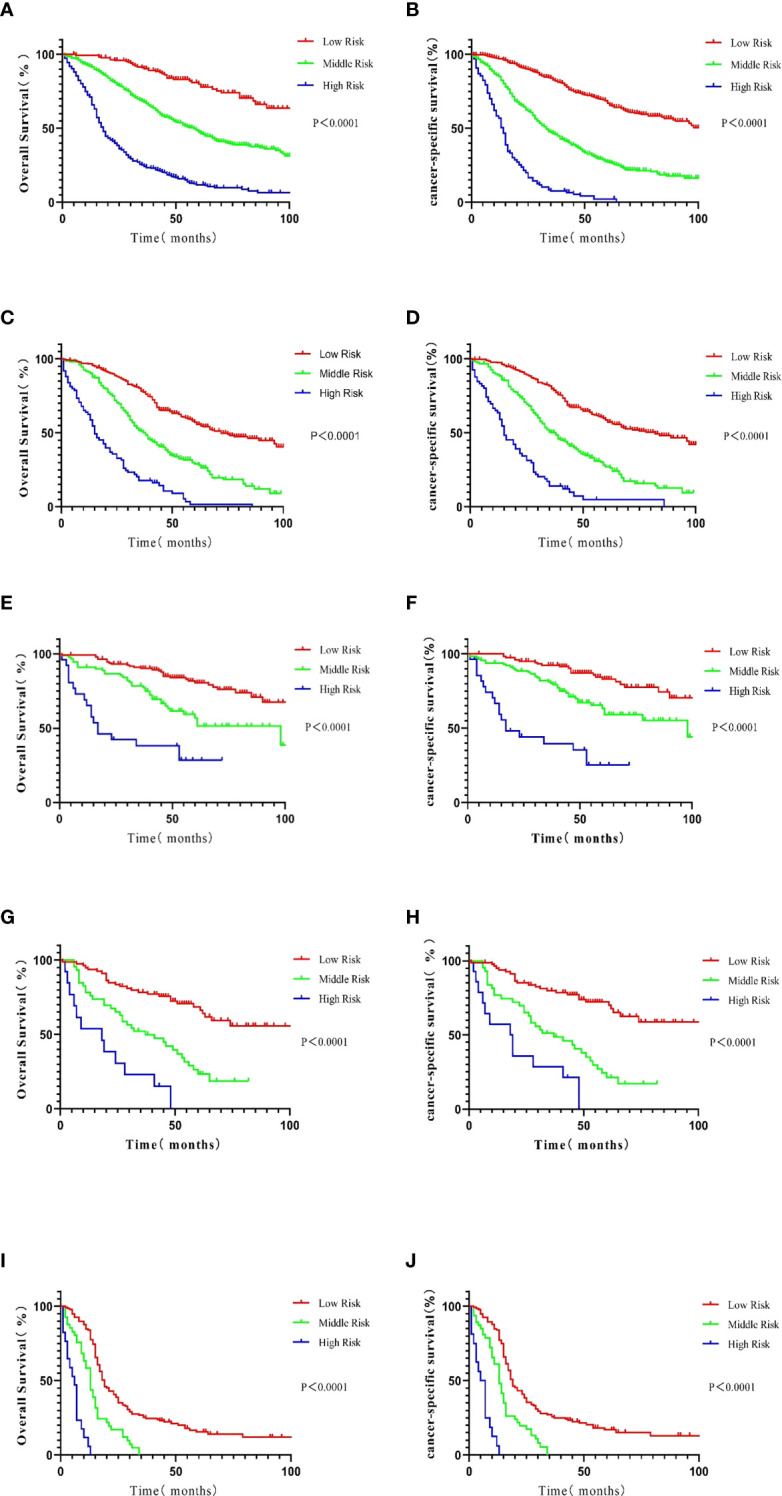
Results: A total of 1,700 MBC patients of childbearing age were identifified from the SEER database, and an additional 92 eligible patients were enrolled at the Yunnan Cancer Hospital. Multivariate Cox analyses identifified 10 prognostic factors for OS and CSS that were used to construct the nomograms. The calibration curve for the probabilities of OS and CSS showed good agreement between nomogram prediction and clinical observations. The C-index of the nomogram for OS was 0.735 (95% CI = 0.725-0.744); the AUC at 3 years was 0.806 and 0.794 at 5 years.The nomogram predicted that the C-index of the CSS was 0.740 (95% CI = 0.730- 0.750); the AUC at 3 years was 0.811 and 0.789 at 5 years. The same results were observed in the validation cohort. Kaplan- Meier curves comparing the low-,medium-, and high-risk groups showed strong prediction results for the prognostic nomogram.
Conclusion: We identifified several independent prognostic factors and constructed nomograms to predict the OS and CSS for MBC patients of childbearing age.These prognostic models should be considered in clinical practice to individualize treatments for this group of patients.
Keywords: SEER; childbearing age; females; metastatic breast cancer (mbc); nomogram; prognosis.
Copyright © 2022 Ma, Xing, Li, Qiu, Wu and Bai.
Conflict of interest statement
The authors declare that the research was conducted in the absence of any commercial or financial relationships that could be construed as a potential conflict of interest.
Figures
Similar articles
-
Construction and validation of prognostic nomogram for metaplastic breast cancer.Bosn J Basic Med Sci. 2022 Feb 1;22(1):131-139. doi: 10.17305/bjbms.2021.5911. Bosn J Basic Med Sci. 2022. PMID: 34247567 Free PMC article.
-
Construction, validation, and visualization of a web-based nomogram to predict survival in male breast cancer patients with second primary prostate cancer.Gland Surg. 2024 Nov 30;13(11):2023-2042. doi: 10.21037/gs-24-287. Epub 2024 Nov 26. Gland Surg. 2024. PMID: 39678429 Free PMC article.
-
Nomogram for predicting outcomes in elderly women with mucinous breast cancer: A retrospective study combined with external validation in southwest China.Cancer Rep (Hoboken). 2024 Jul;7(7):e2112. doi: 10.1002/cnr2.2112. Cancer Rep (Hoboken). 2024. PMID: 39051553 Free PMC article.
-
Analysis of prognostic factors of metastatic endometrial cancer based on surveillance, epidemiology, and end results database.Front Surg. 2023 Jan 6;9:1001791. doi: 10.3389/fsurg.2022.1001791. eCollection 2022. Front Surg. 2023. PMID: 36684133 Free PMC article. Review.
-
Prognostic nomograms for young breast cancer: A retrospective study based on the SEER and METABRIC databases.Cancer Innov. 2024 Oct 25;3(6):e152. doi: 10.1002/cai2.152. eCollection 2024 Dec. Cancer Innov. 2024. PMID: 39464427 Free PMC article. Review.
Cited by
-
Development and validation of a prognostic nomogram for ovarian clear cell carcinoma: a study based on the SEER database and a Chinese cohort.Discov Oncol. 2025 Apr 7;16(1):482. doi: 10.1007/s12672-025-02272-1. Discov Oncol. 2025. PMID: 40192950 Free PMC article.
References
LinkOut - more resources
Full Text Sources