. 2022 Nov 23:12:969396.
doi: 10.3389/fonc.2022.969396. eCollection 2022.

HLA-BAT1 alters migration, invasion and pro-inflammatory cytokines in prostate cancer

Affiliations

HLA-BAT1 alters migration, invasion and pro-inflammatory cytokines in prostate cancer

Aileen M García-Vargas et al. Front Oncol. .

Abstract

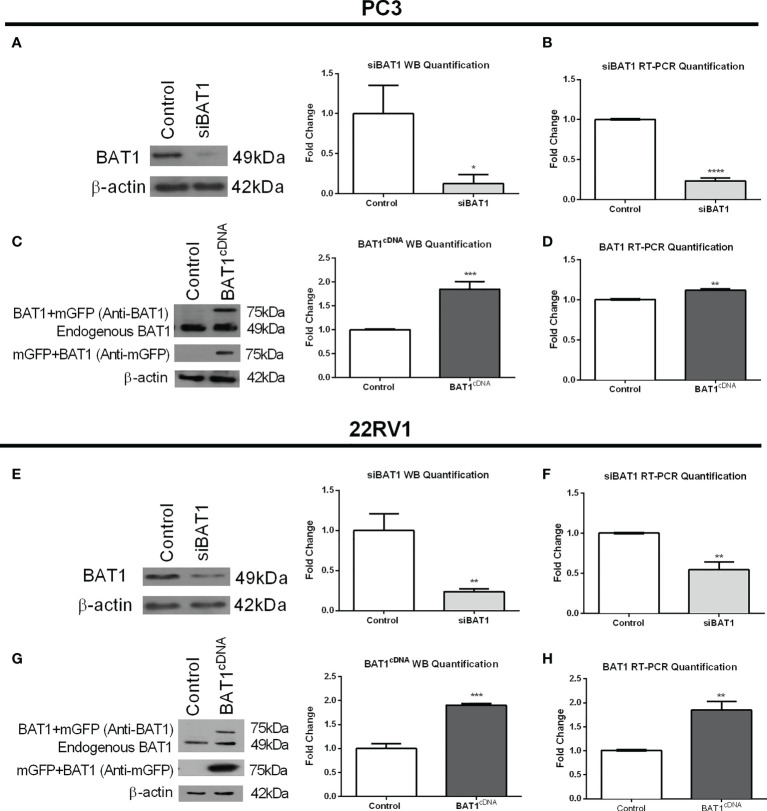
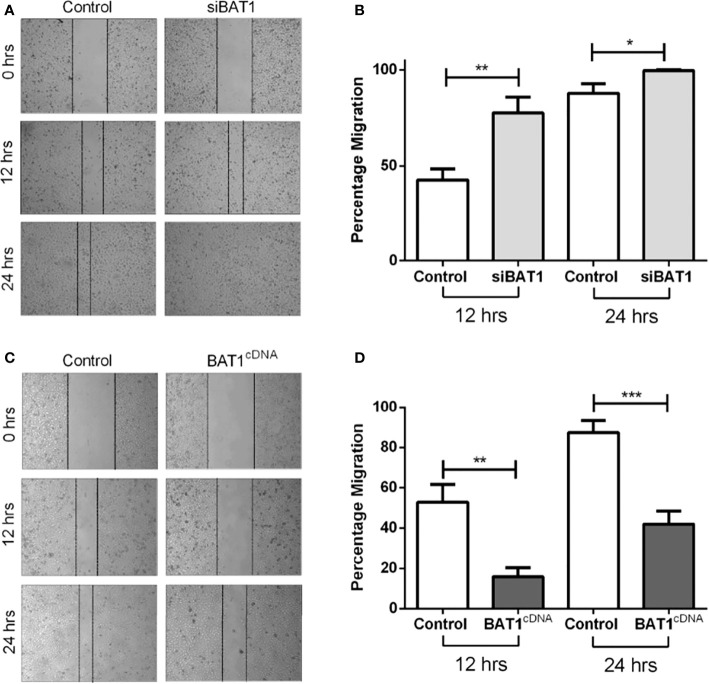
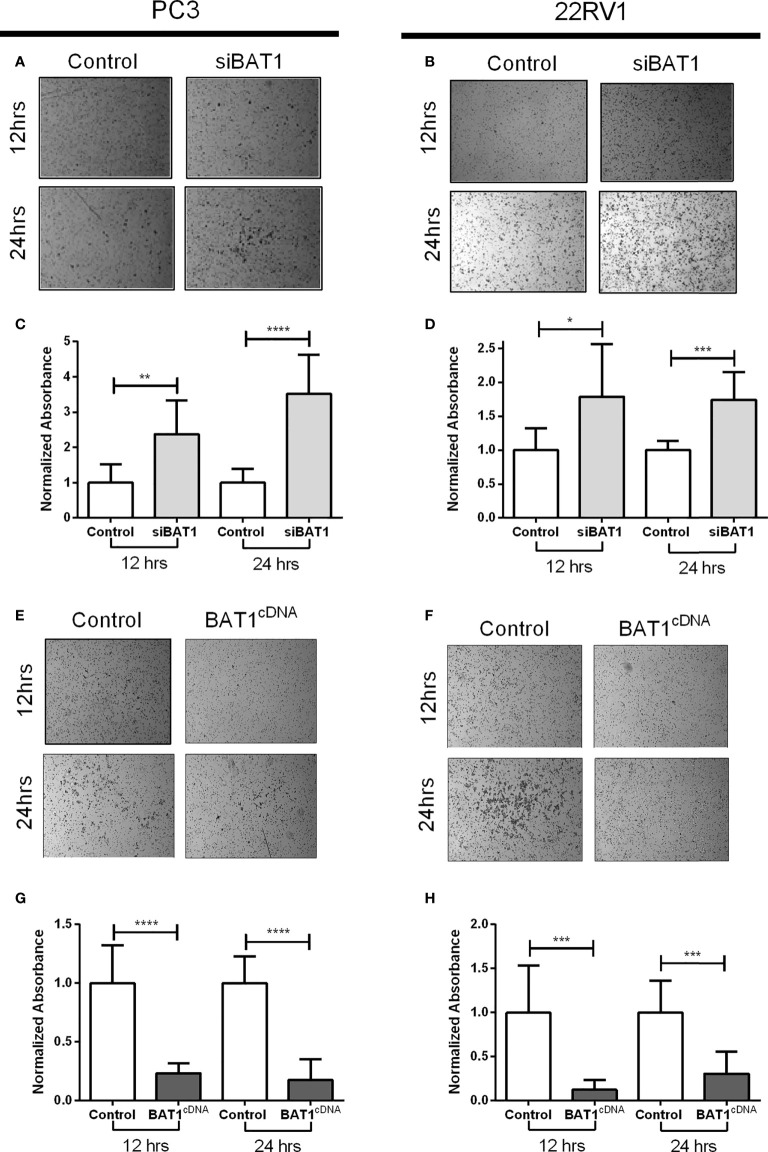
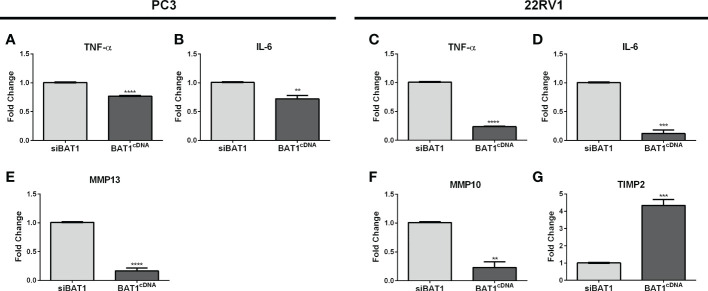
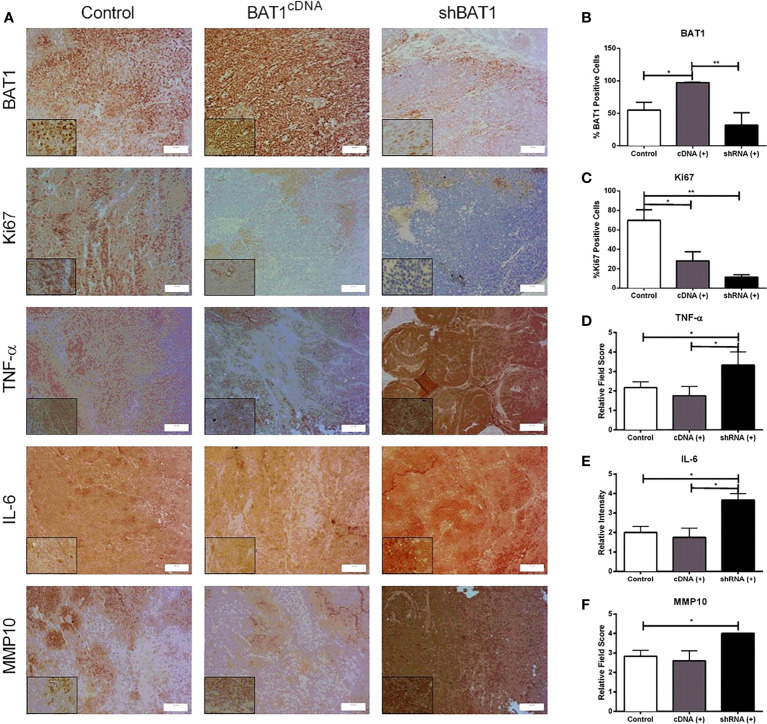
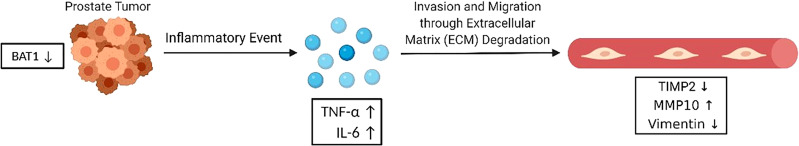
Prostate cancer (PCa) accounts for more than 1 in 5 diagnoses and is the second cause of cancer-related deaths in men. Although PCa may be successfully treated, patients may undergo cancer recurrence and there is a need for new biomarkers to improve the prediction of prostate cancer recurrence and improve treatment. Our laboratory demonstrated that HLA-B-associated transcript 1 (BAT1) was differentially expressed in patients with high Gleason scores when compared to low Gleason scores. BAT1 is an anti-inflammatory gene but its role in PCa has not been identified. The objective of this study is to understand the role of BAT1 in prostate cancer. In vitro studies showed that BAT1 down-regulation increased cell migration and invasion. In contrast, BAT1 overexpression decreased cell migration and invasion. RT-PCR analysis showed differential expression of pro-inflammatory cytokines (TNF-α and IL-6) and cell adhesion and migration genes (MMP10, MMP13, and TIMPs) in BAT1 overexpressed cells when compared to BAT1 siRNA cells. Our in vivo studies demonstrated up-regulation of TNF-α, IL-6, and MMP10 in tumors developed from transfected BAT1 shRNA cells when compared to tumors developed from BAT1 cDNA cells. These findings indicate that BAT1 down-regulation modulates TNF-α and IL-6 expression which may lead to the secretion of MMP-10 and inhibition of TIMP2.

Keywords: animal models; cytokines; inflammation; invasion; migration; prostate cancer.


Conflict of interest statement

The authors declare that the research was conducted in the absence of any commercial or financial relationships that could be construed as a potential conflict of interest.

Figures

Figure 1
Figure 1
BAT1 Expression was decreased after siRNA Transfection and increased after cDNA Transfection in PC3 and 22RV1 cells. The samples were collected for a period of 24 hours. (A) Representative images and quantification of BAT1 protein expression in PC3 prostate cancer cells using western blot analysis showed a significant decrease in siBAT1 transfected cells when compared to control (*P<0.05). (B) Quantification of BAT1 RNA expression using RT-PCR in PC3 prostate cancer cells showed a significant decrease in BAT1 expression in siBAT1 transfected cells when compared to control (****P < 0.0001). (C) Representative images and quantification of BAT1 protein expression in PC3 prostate cancer cells using western blot analysis showed a significant increase in protein expression in BAT1cDNA when compared to control (***P < 0.001). (D) Quantification of BAT1 RNA expression using RT-PCR in PC3 prostate cancer cells showed a significant increase in BAT1 protein expression in BAT1cDNA cells when compared to control (**P < 0.01). (E) Representative images and quantification of BAT1 protein expression in 22RV1 prostate cancer cells using western blot analysis showed a significant decrease in siBAT1 transfected cells when compared to control (**P < 0.01). (F) Quantification of BAT1 RNA expression using RT-PCR in 22RV1 prostate cancer cells showed a significant decrease in BAT1 expression in siBAT1 transfected cells when compared to control (**P < 0.01) (G) Representative images and quantification of BAT1 protein expression in 22RV1 prostate cancer cells using western blot analysis showed a significant increase in BAT1cDNA when compared to control (***P < 0.001). (H) Quantification of BAT1 RNA expression using RT-PCR in 22RV1 prostate cancer cells showed a significant increase in BAT1 protein expression in BAT1cDNA cells when compared to control (**P < 0.01).
Figure 2
Figure 2
BAT1 down-regulation increased PC3 prostate cancer cell migration and BAT1 overexpression decreased PC3 prostate cancer cell migration. (A) Representative images of Control PC3 and siBAT1 PC3 cells using 4X magnification. (B) Relative invasion of siBAT1 PC3 cells caused a significant increase in migration at 12hrs (**P < 0.01) and 24hrs (*P < 0.05) when compared to control. (C) Representative images of Control PC3 and BAT1cDNA PC3 cells using 4X magnification. (D) Relative invasion of (+) BAT1cDNA PC3 cells caused a significant decrease in migration at 12hrs (**P < 0.01) and 24hrs (***P < 0.001) when compared to control.
Figure 3
Figure 3
BAT1 down-regulation increased PC3 and 22RV1 prostate cancer cell and BAT1 overexpression decreased PC3 and 22RV1 prostate cancer cell invasion. (A, B) Representative images of invasive siBAT1 PC3 and 22RV1 cells at a 4X magnification. (C) Relative invasion of siBAT1 PC3 cells caused a significant increase in invasion when compared to control at 12hrs (**P < 0.01) and 24hrs (****P < 0.0001). (D) Relative invasion of siBAT1 22RV1 cells caused a significant increase in invasion when compared to control at 12hrs (*P < 0.05) and 24hrs (***P < 0.001). (E, F) Representative images of invasive BAT1cDNA PC3 and 22RV1 cells at a 4X magnification. (G) Relative invasion of BAT1cDNA PC3 cells caused a significant decrease in invasion when compared to control at 12hrs (****P < 0.0001) and 24hrs (****P < 0.0001). (H) Relative invasion of BAT1cDNA 22RV1 cells caused a significant decrease in invasion when compared to control at 12hrs (***P < 0.001) and 24hrs (***P < 0.001).
Figure 4
Figure 4
BAT1 expression showed changes in genes associated with inflammation, adhesion, and metastasis in PC3 and 22RV1 cells using qRT-PCR. The samples were collected for a period of 24 hours. (A, C) BAT1cDNA PC3 and 22RV1 cells showed a significant decrease in TNF-α expression when compared to siBAT1 (****P < 0.0001). (B, D) BAT1cDNA PC3 and 22RV1 cells showed a significant decrease in IL-6 expression when compared to siBAT1 (**P < 0.01) (***P < 0.001). (E) BAT1cDNA PC3 cells showed a significant decrease in MMP13 expression when compared to siBAT1 (****P < 0.0001). (F) BAT1cDNA 22RV1 cells showed a significant decrease in MMP10 expression when compared to siBAT1 (**P < 0.01). (G) BAT1cDNA 22RV1 cells showed a significant increase in TIMP2 expression when compared to siBAT1 (***P < 0.001).
Figure 5
Figure 5
In vivo expression of BAT1, Ki67, TNF-α, IL-6, and MMP10. All of the samples were collected for a period of 24 hours. (A) Representative images of immunohistochemical staining BAT1 expression in mice prostate tumors previously injected with 22RV1 cells, BAT1cDNA 22RV1 cells, or shBAT1 22RV1 cells at a 20X (50μm) or 60X magnification (10μm) magnification. (B) Quantification mice prostate tumors obtained from BAT1cDNA mice prostate tumors showed a significant increase in BAT1 expression using immunohistochemistry when compared to control (*P < 0.05) and shBAT1 (**P < 0.01). (C) shBAT1 (**P < 0.01) and BAT1cDNA (*P < 0.05) tumors showed a significant decrease in Ki67 expression when compared to control. (D) shBAT1 tumors showed a significant increase in TNF-α expression when compared to control and BAT1cDNA (*P < 0.05). (E) shBAT1 tumors showed a significant increase in IL-6 expression when compared to control and BAT1cDNA mice prostate tumors (*P < 0.05). (F) shBAT1 tumors showed a significant increase in MMP10 expression when compared to control (*P < 0.05).
Figure 6
Figure 6
BAT1 promotes in vitro invasion and migration. BAT1 down-regulation leads to activation of pro-inflammatory cytokines TNF-α and IL-6, which leads to the secretion of MMP-10 and inhibition of TIMP2. MMP-10 may degrade the ECM and promote PCa invasion and migration through extracellular matrix degradation.

Similar articles

References

    1. Siegel RL, Miller KD, Fuchs HE, Jemal A. Cancer statistics, 2022. CA: A Cancer J Clin (2022) 72(1):7–33. doi: 10.3322/caac.21708 - DOI - PubMed
    1. Siegel RL, Miller KD, Jemal A. Cancer statistics, 2020. CA: A Cancer J Clin (2020) 70(1):7–30. doi: 10.3322/caac.21590 - DOI - PubMed
    1. Allcock RJN, Price P, Gaudieri S, Leelayuwat C, Witt CS, Dawkins RL. Characterisation of the human central MHC gene, BAT1: Genomic structure and expression. Exp Clin Immunogenetics (1999) 16(2):98–106. doi: 10.1159/000019100 - DOI - PubMed
    1. Momose F, Basler CF, O'Neill RE, Iwamatsu A, Palese P, Nagata K. Cellular splicing factor RAF-2P48/NPI-5/BAT1/UAP56 interacts with the influenza virus nucleoprotein and enhances viral RNA synthesis. J Virology (2001) 75(4):1899–908. doi: 10.1128/JVI.75.4.1899-1908.2001 - DOI - PMC - PubMed
    1. Okamoto K, Makino S, Yoshikawa Y, Takaki A, Nagatsuka Y, Ota M, et al. Identification of IKBL as the second major histocompatibility complex–linked susceptibility locus for rheumatoid arthritis. Am J Hum Genet (2003) 72(2):303–12. doi: 10.1086/346067 - DOI - PMC - PubMed