. 2022 Nov 8;25(12):105490.
doi: 10.1016/j.isci.2022.105490. eCollection 2022 Dec 22.

Activation of HIV-1 proviruses increases downstream chromatin accessibility

Affiliations

Activation of HIV-1 proviruses increases downstream chromatin accessibility

Raven Shah et al. iScience. .

Abstract

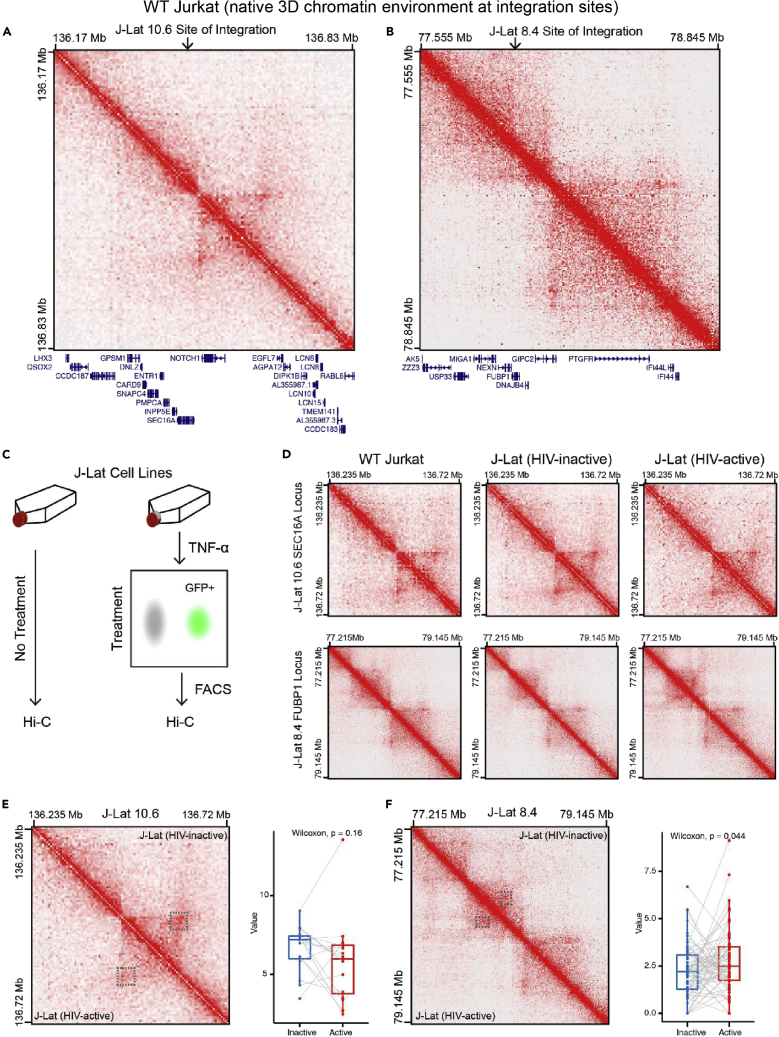
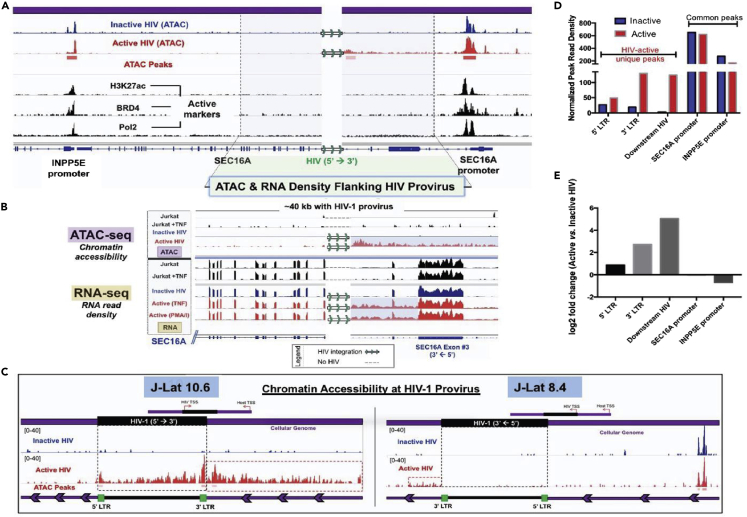
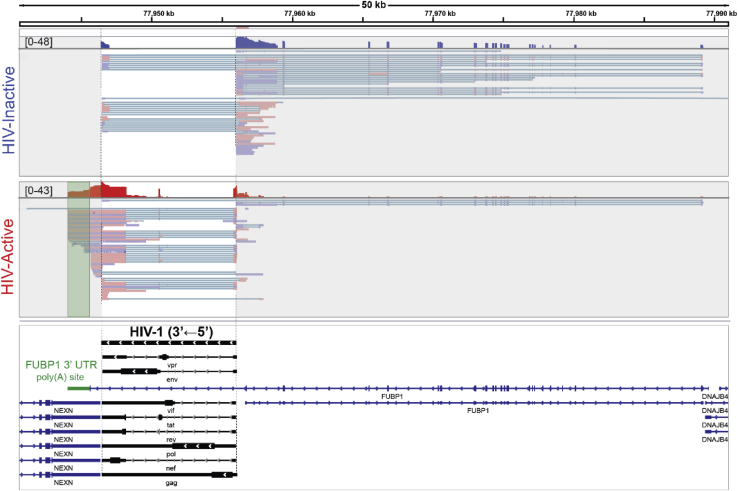
It is unclear how the activation of HIV-1 transcription affects chromatin structure. We interrogated chromatin organization both genome-wide and nearby HIV-1 integration sites using Hi-C and ATAC-seq. In conjunction, we analyzed the transcription of the HIV-1 genome and neighboring genes. We found that long-range chromatin contacts did not differ significantly between uninfected cells and those harboring an integrated HIV-1 genome, whether the HIV-1 genome was actively transcribed or inactive. Instead, the activation of HIV-1 transcription changes chromatin accessibility immediately downstream of the provirus, demonstrating that HIV-1 can alter local cellular chromatin structure. Finally, we examined HIV-1 and neighboring host gene transcripts with long-read sequencing and found populations of chimeric RNAs both virus-to-host and host-to-virus. Thus, multiomics profiling revealed that the activation of HIV-1 transcription led to local changes in chromatin organization and altered the expression of neighboring host genes.

Keywords: Biological sciences; Chromosome organization; Molecular biology; Molecular interaction.


Conflict of interest statement

The authors declare no competing interests.

Figures

None
Graphical abstract
Figure 1
Figure 1
Variability in chromatin environments at HIV-1 sites of integration (A) Table adapted from Symons et al. 2018, displaying HIV-1 site of integration in J-Lat 10.6 and 8.4 models. (B) Schematic depicting the orientation of HIV-1 provirus and respective host gene in J-Lat 10.6 and 8.4 models. (C) Epigenomic profile of chromatin environment in WT Jurkat cells within 500 kb of HIV-1 integration sites in J-Lat 10.6 and J-Lat 8.4 models. ATAC-seq (blue; Jurkat T cells), ChIP-seq against H3K27ac (Jurkat T cells), Pol2 (Jurkat T cells), and BRD4 (black tracks; Jurkat T cells), and speckle-associated domains (SPADs) in K562 cells and predicted super-enhancers in Jurkat T cells (both red tracks). Accession numbers of these sequencing datasets can be found in materials availability and STAR Methods. HIV-1 marker (green) denoting the exact sites of integration is not to scale. Sequencing tracks are visualized using Integrated Genomics Viewer (IGV). (D) Flow cytometric analysis of J-Lat activation potentials. Cells are treated with TNF-α. HIV-active cells are GFP+. Jurkat T cells (no reporter provirus; black) serve as a gating control.
Figure 2
Figure 2
Minimal changes in integration site higher-order chromatin structure upon HIV-1 transcriptional activation (A) Hi-C interaction map in wild-type Jurkat T-cells of the region on chr9 where the integration site is located in the J-Lat 10.6 cell line. The arrow indicates the site of integration, within the SEC16A gene. Below the heatmap is the location of genes at the locus, including SEC16A. (B) Similar as in panel A but depicting the region on chr1 where the integration site is located in the J-Lat 8.4 model within the FUBP1 gene. (C) Schematic showing the experimental design of Hi-C in the context of HIV-1 transcriptional induction. TNF-α is added for 24 h to the J-Lat model lines. GFP + cells that have successfully activated and are then sorted and processed for Hi-C. Untreated J-Lat cells are used as controls. (D) Hi-C heat maps of the integration sites in WT Jurkat cells (left column), untreated J-Lat lines (middle column), and HIV-active (right column), for the J-Lat 10.6 sample (top row) and the J-Lat 8.4 sample (bottom row). (E) Comparison of the SEC16A locus in the J-Lat 10.6 cell line. The heatmap shows the untreated conditions in the upper right-hand half of the heatmap, and the activated population in the lower left-hand. Dashed lines mark a loop downstream of the SEC16A locus that surrounds the NOTCH1 gene. The plot on the right shows the quantification of the observed/expected Hi-C interaction frequencies for the HIV-inactive (blue) and -activated (yellow) conditions of pixels within the dashed line. The loop generally is weakened upon HIV activation, but the results do not reach a threshold for statistical significance (p = 0.16, Wilcoxon). (F) Comparison of the FUBP1 locus in the J-Lat 8.4 cell line. The heatmap shows the untreated conditions in the upper right-hand half of the heatmap, and the activated cells in the lower left-hand. Dashed lines mark a region of increased interactions between the FUBP1 gene and a region upstream. The plot on the right shows the quantification of the observed/expected Hi-C interaction frequencies for the HIV-inactive (blue) and -active (yellow) conditions of pixels within the dashed line (p = 0.0.44, Wilcoxon).
Figure 3
Figure 3
ATAC- & RNA-seq read density at HIV-1 integration sites to profile local HIV-host chromatin environment and transcription (A) Representative ATAC-seq tracks of inactive (blue) and active (red) populations of J-Lat 10.6 cells. ChIP-seq of Jurkat T cells (black) against active enhancer and promoter marks (H3K27ac, Pol2, and BRD4) are overlaid to demarcate close host promoters (INPP5E & SEC16A). (B) Close-up of the highlighted region in panel (A), visualizing ATAC-seq and RNA-seq (Illumina) read density of the flanking host genome (reads aligned to a human reference genome (hg38)). Sequencing tracks to the left are upstream of HIV-1, flanking the 5′ LTR, and tracks to the right are downstream. The highlighted regions in ATAC and RNA density demarcate regions of increased read pileup or density directly downstream of the activated provirus. The sequencing tracks in black are of uninfected Jurkat T cells +/− TNF-α to visualize what the native chromatin and transcriptional state is in the absence of the provirus. The host gene, SEC16A, has a 3’ ← 5’ orientation, whereas HIV-1 has the opposite 5’ → 3’ transcriptional orientation. (C) ATAC read density at the proviral site of integration in the J-Lat 10.6 and 8.4 models. Reads were mapped to a custom reference genome that includes the HIV-1 proviral genome. The red dotted boxes highlight changes in ATAC density downstream from the HIV 3′ LTR. HIV-1 and host transcriptional start sites (TSS) are shown to bring attention to the transcriptional orientation of HIV-1 and the respective host genes in both J-Lat models. (D and E) Quantification of differential ATAC read density at provirus, flanking cellular genome, and proximal host promoters (SEC16A and INPP5E 5′ promoters) in the J-Lat 10.6 cells (inactive vs. active states). Differential peak analysis is performed from a merged dataset from two biological replicates for each condition. Common peaks across the two biological replicates were selected and used to normalize the dataset using MAnorm. Normalized peaks from the merged datasets were used for differential peak analysis. All ATAC- and RNA-seq experiments were performed with two biological replicates. ATAC-seq replicates for J-Lat 10.6 cells are shown in Figure S5.
Figure 4
Figure 4
smFISH to visualize transcriptional read-through at HIV-host genomic boundaries (A) Visualization of HIV-1 (+) RNA, and (−) RNA via single-molecule FISH (smFISH). The oligonucleotide hybridization probe shown in red targets template HIV-1 cDNA (3’ ← 5′) and antisense (−) HIV-1 transcripts. The probe depicted in green is designed to target positive-sense (+) HIV-1 RNA. Both HIV-1 transcriptional patterns for HIV-inactive and -active cells is shown for J-Lat 10.6 and 8.4 models. RNase-treatment control. Scale bars represent 10 μm. (B) Normalized read counts of total HIV and chimeric HIV-host RNAs using long-read Nanopore sequencing. Normalized read counts were averaged across four biological replicates/condition (HIV-inactive and -active) for both the J-Lat 10.6 and 8.4 cells. Chimeric RNAs were defined by identifying “multi-mappers,” reads that align to both hg38 and custom HIV-1 reference genome. (C) Schematic of transcriptional read-through at HIV-host junctions. The red nascent transcript in the J-Lat 10.6 inactive cells indicates the expression of HIV-1 (−) RNA driven by the flanking host promoter. Similarly, in the inactive 8.4 cells, HIV-1 (+) RNA is expressed with transcription originating at the host promoter and Pol2 running into the HIV-1 genome. In the active J-Lat cells, (+) RNA is expressed, and both canonical poly(A) transcripts and chimeric HIV-host RNAs are generated.
Figure 5
Figure 5
Long-read Nanopore RNA-sequencing of J-Lat 8.4 cells enables identification and characterization of long chimeric HIV-host RNA isoforms Chimeric HIV-host RNA reads were filtered from the total RNA reads and displayed above. Chimeric read pile-up from HIV-inactive (blue) and -active (red) cells are displayed. Under the respective histograms, individual mapped reads are shown. In the HIV-active cell population (red), HIV-driven transcriptional read-through is highlighted by the green box (FUPB1 3′ UTR/poly(A) site). HIV-1 and cellular transcript variants are shown below the mapped sequencing reads (HIV-1 = black, FUBP1 = blue). The HIV-1 and FUBP1 sequences are in the 3’ ← 5’ transcriptional orientation.
Figure 6
Figure 6
Total mRNA reads for genes proximate to HIV-1 integration sites mRNA reads for HIV-1 and cellular genes (GAPDH and genes within 100 kb of J-Lat 10.6 (SEC16A, INPP5E, NOTCH1, PMPCA) or 8.4 (FUBP1, DNAJB4, NEXN, GIPC2) integration sites). CDK9 or cyclin-dependent kinase 9 is critical for Pol2 transcription, initiation, elongation, and termination. Post-read alignment, assembled mRNA transcripts were selected vs. total reads by cross-referencing to hg38 (human) and custom HIV-1 annotation files (See STAR Methods) to generate read count matrices for protein-coding transcripts and lncRNAs. Jurkat T cells +/− TNF (no HIV-1 integration; black) were also assessed to collectively evaluate the role HIV-1 integration, TNF stimulation, and HIV-1 transcriptional state has on the local cellular RNA landscape. Differential analysis of normalized mRNA read-counts (FPKM) was performed using DESeq2. ∗∗∗ = p value ≤ 0.001.

Similar articles

Cited by

References

    1. Chun T.W., Engel D., Mizell S.B., Hallahan C.W., Fischette M., Park S., Davey R.T., Jr., Dybul M., Kovacs J.A., Metcalf J.A., et al. Effect of interleukin-2 on the pool of latently infected, resting CD4+ T cells in HIV-1-infected patients receiving highly active anti-retroviral therapy. Nat. Med. 1999;5:651–655. - PubMed
    1. Brenchley J.M., Hill B.J., Ambrozak D.R., Price D.A., Guenaga F.J., Casazza J.P., Kuruppu J., Yazdani J., Migueles S.A., Connors M., et al. T-cell subsets that harbor human immunodeficiency virus (HIV) in vivo: implications for HIV pathogenesis. J. Virol. 2004;78:1160–1168. - PMC - PubMed
    1. Sonza S., Mutimer H.P., Oelrichs R., Jardine D., Harvey K., Dunne A., Purcell D.F., Birch C., Crowe S.M. Monocytes harbour replication-competent, non-latent HIV-1 in patients on highly active antiretroviral therapy. AIDS. 2001;15:17–22. - PubMed
    1. Wu L., KewalRamani V.N. Dendritic-cell interactions with HIV: infection and viral dissemination. Nat. Rev. Immunol. 2006;6:859–868. - PMC - PubMed
    1. Craigie R., Bushman F.D. Host factors in retroviral integration and the selection of integration target sites. Microbiol. Spectr. 2014;2 - PMC - PubMed