. 2022 Nov 24;25(12):105659.
doi: 10.1016/j.isci.2022.105659. eCollection 2022 Dec 22.

FK506-binding protein, FKBP12, promotes serine utilization and negatively regulates threonine deaminase in fission yeast

Affiliations

FK506-binding protein, FKBP12, promotes serine utilization and negatively regulates threonine deaminase in fission yeast

Mayuki Sasaki et al. iScience. .

Abstract

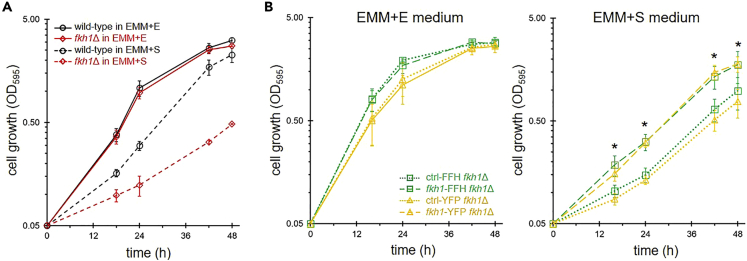
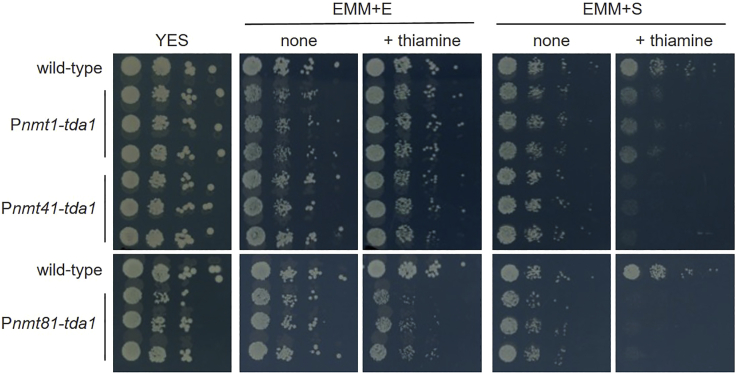
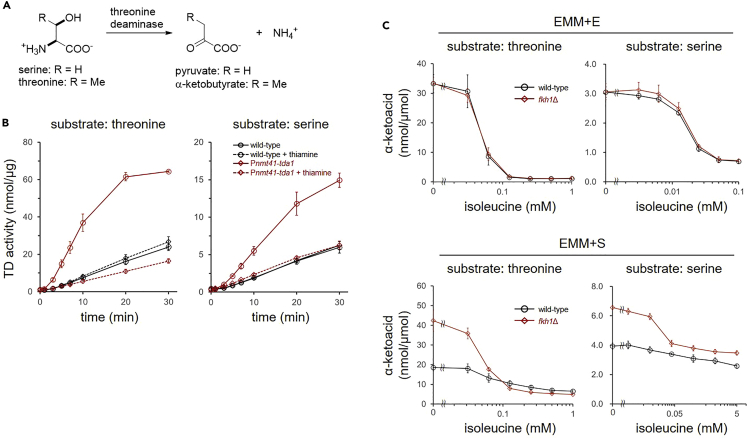
FK506-binding protein with a molecular weight of 12 kDa (FKBP12) is a receptor of the immunosuppressive drugs, FK506 and rapamycin. The physiological functions of FKBP12 remain ambiguous because of its nonessentiality and multifunctionality. Here, we show that FKBP12 promotes the utilization of serine as a nitrogen source and regulates the isoleucine biosynthetic pathway in fission yeast. In screening for small molecules that inhibit serine assimilation, we found that the growth of fission yeast cells in medium supplemented with serine as the sole nitrogen source, but not in glutamate-supplemented medium, was suppressed by FKBP12 inhibitors. Knockout of FKBP12 phenocopied the action of these compounds in serine-supplemented medium. Metabolome analyses and genetic screens identified the threonine deaminase, Tda1, to be regulated downstream of FKBP12. Genetic and biochemical analyses unveiled the negative regulation of Tda1 by FKBP12. Our findings reveal new roles of FKBP12 in amino acid biosynthesis and nitrogen metabolism homeostasis.

Keywords: Biochemistry; Biological sciences; Biosynthesis; Cell biology.


Conflict of interest statement

The authors declare no competing interests.

Figures

None
Graphical abstract
Figure 1
Figure 1
FKBP12i suppresses cell growth in the serine medium (A) Growth inhibition by FKBP12i. Wild-type cells were treated with FK506, SLF, or rapamycin in EMM + E (solid black line) or EMM + S (blue dashed line) medium for 48 h. Data represent the mean ± SE (n = 3). (B) Time-course analyses of the effect of SLF on wild-type cells. Cell numbers were counted in EMM + E or EMM + S medium, in the absence or presence of SLF (12.5 μg/mL, 23.8 μM). Data represent the mean ± SD (n = 3).
Figure 2
Figure 2
Knockout of FKBP12 showed attenuated growth in the serine medium (A) Growth of wild-type and fkh1Δ cells. Cells were cultivated in EMM + E (solid line) or EMM + S (dashed line) medium. Data represent the mean ± SD (n = 3). (B) Recovery of cell growth by fkh1 expression. C-terminally tagged fkh1 sequences (fkh1-FFH or fkh1-YFH) were integrated in the leu1-32 chromosomal locus and expressed under the control of the nmt1 promoter. FFH and YFH denote FLAG2-His6 and YFP-FLAG-His6, respectively. Data represent the mean ± SD (n = 3). ∗: p < 0.05 for both ctrl-FFH vs fkh1-FFH and ctrl-YFP vs fkh1-YFP.
Figure 3
Figure 3
Effect of SLF on amino acid uptake and cellular metabolism (A) Effect of SLF on amino acid uptake. Cellular uptake of RI-labeled amino acids, [14C]-glutamate (left) or [3H]-serine (right), was measured in the absence (black) or presence (red) of SLF (23.8 μM). Data represent the mean ± SE (n = 5). ∗p < 0.05, ∗∗p < 0.01. (B) Effect of SLF on cell growth. Growth rate, the ratio of the cell number (cells w/SLF ver. cells w/o SLF) are shown. Cells were treated with SLF (23.8 μM) for 6 h, and cell number was counted. These cells were subjected to metabolome analyses. Data represent the mean ± SD (n = 3). (C) Dot plot of metabolites detected in cells cultivated in EMM + S medium. Data represent the mean ± SD (n = 3). (D) Metabolite levels of cells cultivated in EMM + E or EMM + S medium, in the presence or absence of SLF. Representative metabolites are shown. y axis shows the relative area of metabolites detected in the CE-TOFMS spectra or the absolute concentration of metabolites (pmol/10ˆ8 cells). Data represent the mean ± SD (n = 3). ∗p < 0.05, ∗∗p < 0.01.
Figure 4
Figure 4
Effect of Tda1 expression level on cell growth Wild-type cells and engineered cells expressing tda1 under three promoters were inoculated on a rich medium YES, synthetic EMM + E or EMM + S medium for five days. Thiamine (10 μM) was added to suppress the promoter activity. Representative results of three independent experiments are shown.
Figure 5
Figure 5
Genetic interactions between tda1 and fkh1 (A) Growth and drug sensitivity of wild-type and engineered cells expressing tda1 under the control of the Pnmt81 promoters. tda1 expression was modulated in wild-type (black) or fkh1Δ (red) cells. Cells were cultivated in EMM + E or EMM + S medium, in the presence of thiamine (10 μM) for 48 h. Data represent the mean ± SE (n = 3). (B) Effect of isoleucine on the growth of cells expressing tda1 under the control of Pnmt81 promoter. Wild-type or engineered cells were inoculated in EMM + E, EMM + S, or EMM-N medium for 72 h. Thiamine (10 μM) was added to suppress the promoter activity. Data represent the mean ± SE (n = 4).
Figure 6
Figure 6
Effect of fkh1 deletion on TD activity (A) Deamination of threonine and serine by Tda1. The amount of the produced α-ketoacids was quantified in the TD assay. (B) TD activity of cell lysates. Cell lysates from wild-type or engineered cells expressing tda1 under the control of Pnmt41 promoter were used in the enzymatic assay. Cells were cultivated in EMM + S medium in the presence or absence of thiamine (10 μM). Threonine (5 mM) or serine (20 mM) was used as a substrate. Data represent the mean ± SD (n = 3). (C) Cell lysates of wild-type or fkh1Δ cells were used to examine the cellular TD activity in the presence of isoleucine. Threonine (10 mM) or serine (20 mM) was used as a substrate. Reaction mixtures were incubated for 10 min. Data represent the mean ± SD (n = 3).
Figure 7
Figure 7
Plausible model for regulation of Tda1 activity The activity of Tda1 is regulated by amino acids, isoleucine (red), and valine (blue), which bind to the regulatory ACT domains. Valine binds to one of the isoleucine binding sites. In this study, FKBP12 was shown to downregulate the activity of Tda1, probably through regulating the structure of ACT domains.

Similar articles

Cited by

References

    1. Bonner J.M., Boulianne G.L. Diverse structures, functions and uses of FK506 binding proteins. Cell. Signal. 2017;38:97–105. doi: 10.1016/j.cellsig.2017.06.013. - DOI - PubMed
    1. Kolos J.M., Voll A.M., Bauder M., Hausch F. FKBP ligands-where we are and where to go? Front. Pharmacol. 2018;9:1425. doi: 10.3389/fphar.2018.01425. - DOI - PMC - PubMed
    1. Harding M.W., Galat A., Uehling D.E., Schreiber S.L. A receptor for the immunosuppressant FK506 is a cis-trans peptidyl-prolyl isomerase. Nature. 1989;341:758–760. doi: 10.1038/341758a0. - DOI - PubMed
    1. Siekierka J.J., Hung S.H., Poe M., Lin C.S., Sigal N.H. A cytosolic binding protein for the immunosuppressant FK506 has peptidyl-prolyl isomerase activity but is distinct from cyclophilin. Nature. 1989;341:755–757. doi: 10.1038/341755a0. - DOI - PubMed
    1. Liu J., Farmer J.D., Jr., Lane W.S., Friedman J., Weissman I., Schreiber S.L. Calcineurin is a common target of cyclophilin-cyclosporin A and FKBP-FK506 complexes. Cell. 1991;66:807–815. doi: 10.1016/0092-8674(91)90124-h. - DOI - PubMed