. 2022 Nov 23;25(12):105663.
doi: 10.1016/j.isci.2022.105663. eCollection 2022 Dec 22.

Regulation of hierarchical carbon substrate utilization, nitrogen fixation, and root colonization by the Hfq/Crc/CrcZY genes in Pseudomonas stutzeri

Affiliations

Regulation of hierarchical carbon substrate utilization, nitrogen fixation, and root colonization by the Hfq/Crc/CrcZY genes in Pseudomonas stutzeri

Fanyang Lv et al. iScience. .

Abstract

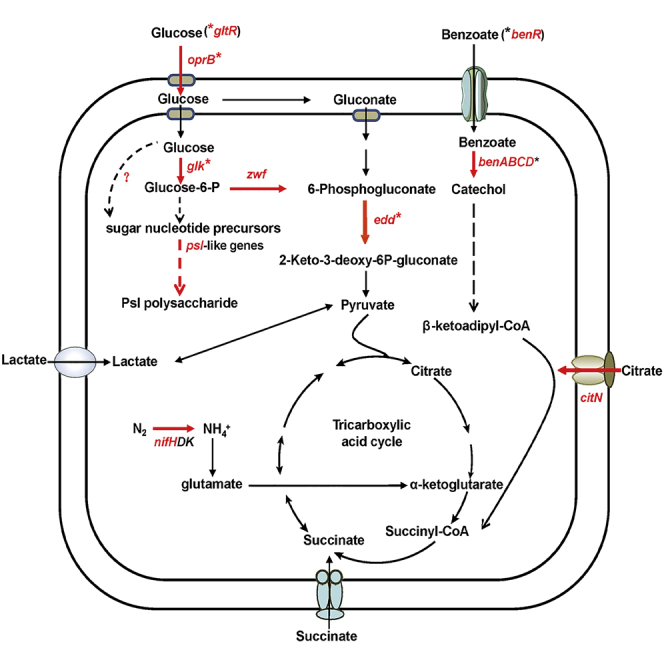
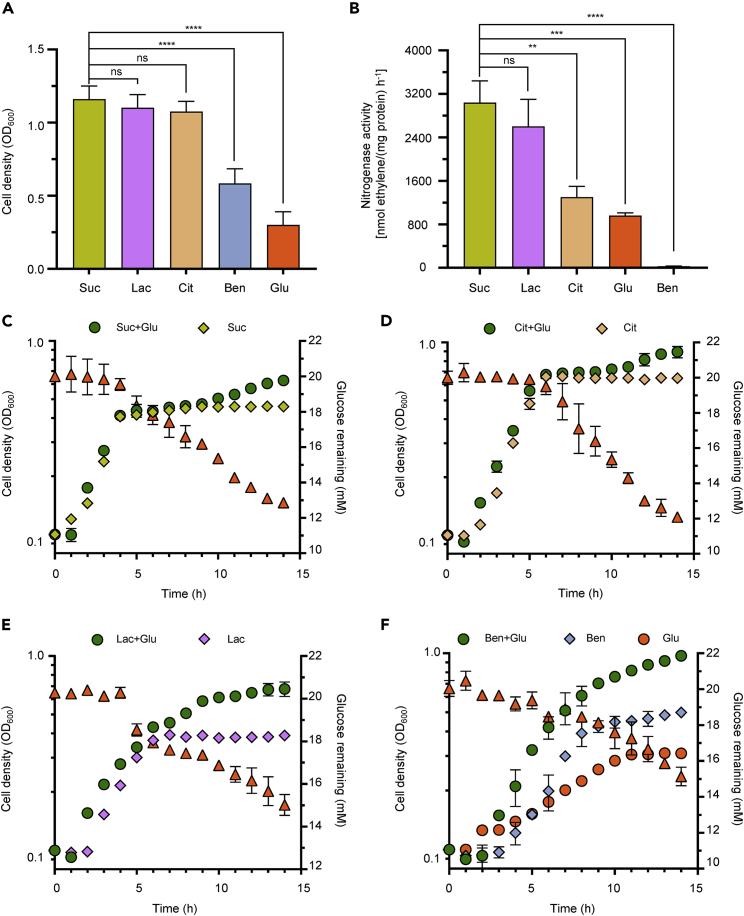
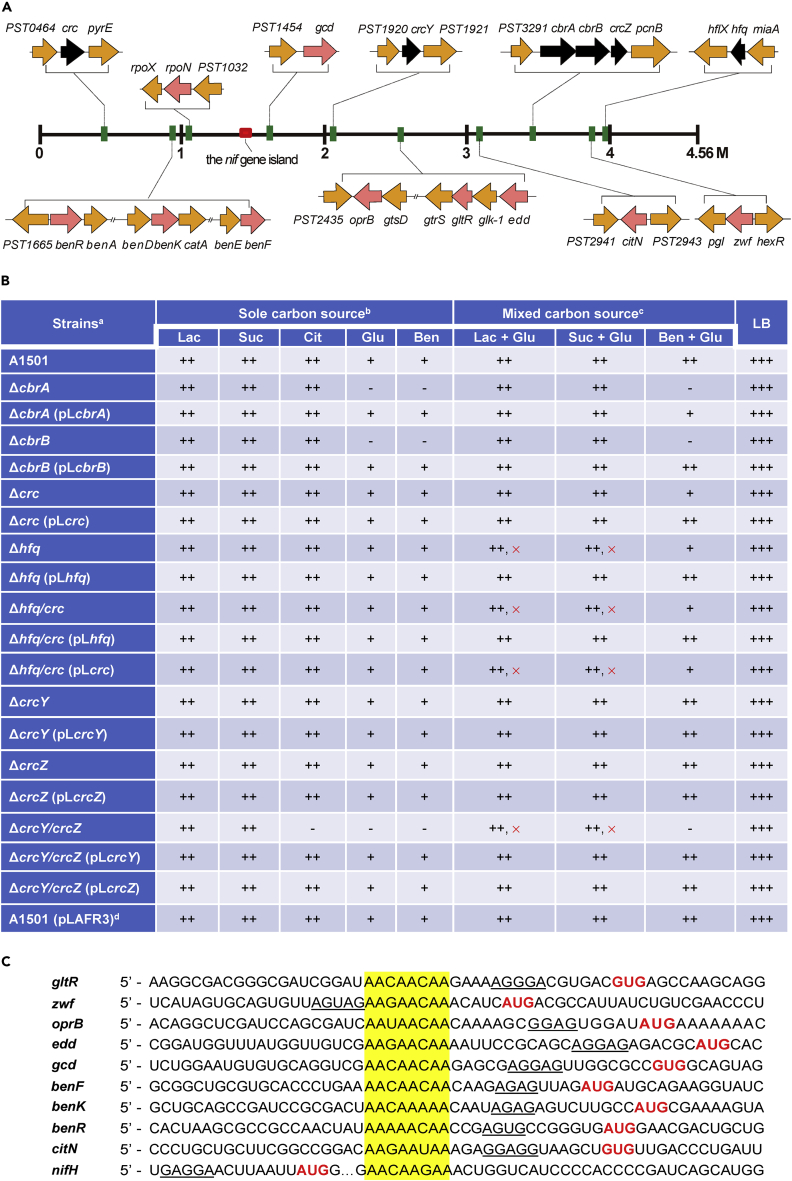
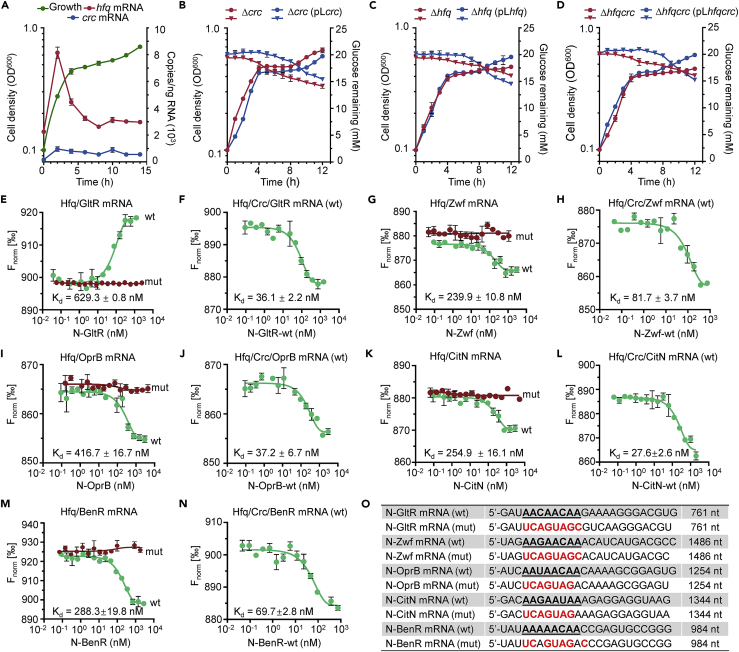
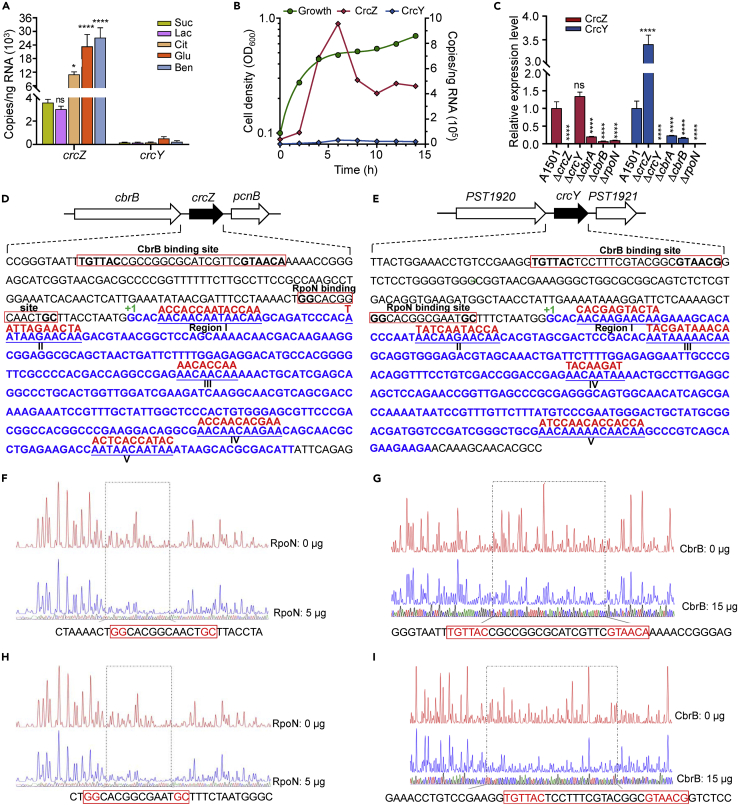
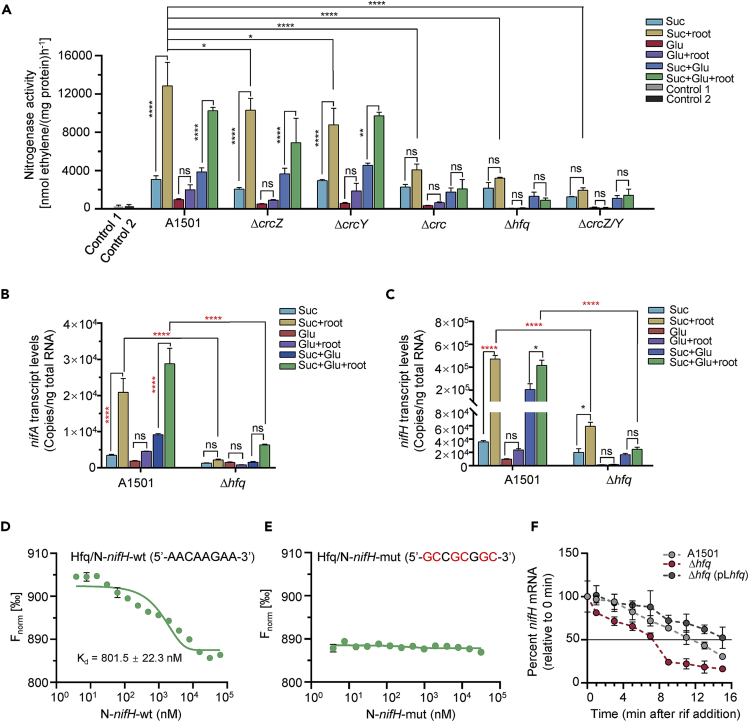
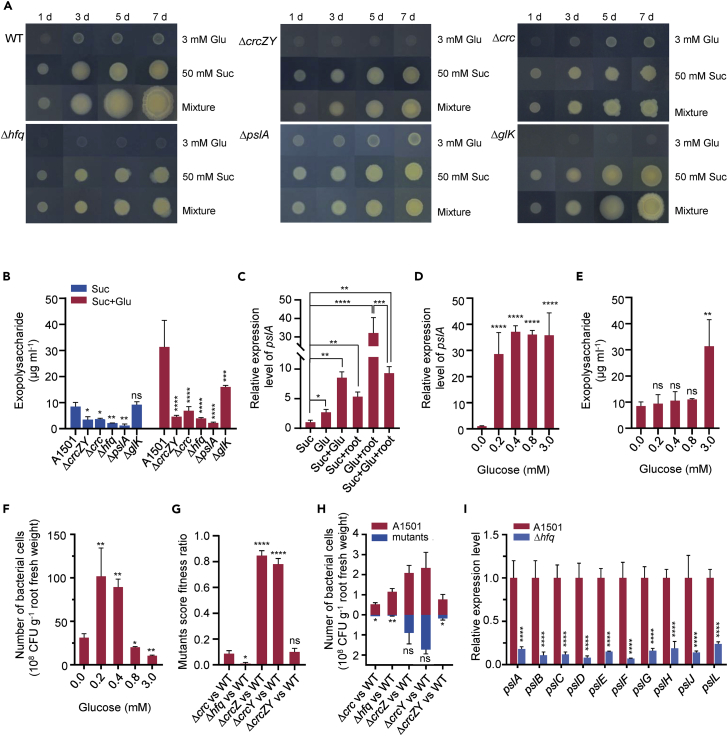
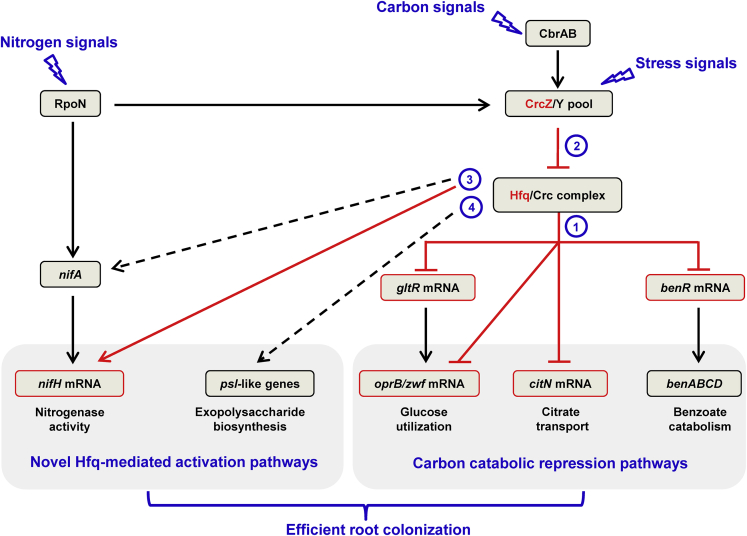
Bacteria of the genus Pseudomonas consume preferred carbon substrates in nearly reverse order to that of enterobacteria, and this process is controlled by RNA-binding translational repressors and regulatory ncRNA antagonists. However, their roles in microbe-plant interactions and the underlying mechanisms remain uncertain. Here we show that root-associated diazotrophic Pseudomonas stutzeri A1501 preferentially catabolizes succinate, followed by the less favorable substrate citrate, and ultimately glucose. Furthermore, the Hfq/Crc/CrcZY regulatory system orchestrates this preference and contributes to optimal nitrogenase activity and efficient root colonization. Hfq has a central role in this regulatory network through different mechanisms of action, including repressing the translation of substrate-specific catabolic genes, activating the nitrogenase gene nifH posttranscriptionally, and exerting a positive effect on the transcription of an exopolysaccharide gene cluster. Our results illustrate an Hfq-mediated mechanism linking carbon metabolism to nitrogen fixation and root colonization, which may confer rhizobacteria competitive advantages in rhizosphere environments.

Keywords: Plant genetics; plant biology; plant nutrition.


Conflict of interest statement

The authors have no competing interests to declare.

Figures

None
Graphical abstract
Figure 1
Figure 1
Hierarchical utilization of carbon substrates in P. stutzeri A1501 (A) Growth of A1501 for 12 h in minimal medium K that contained 6.0 mM NH4+ as the sole nitrogen source and with the carbon sources indicated at the following concentrations: 4 mM benzoate (Ben), 20 mM lactate (Lac), 20 mM succinate (Suc), 20 mM citrate (Cit), and 20 mM glucose (Glu). (B) Effect of the different carbon substrates on the nitrogenase activity of A1501 in minimal medium K devoid of a nitrogen source and containing the same carbon substrates as in (A). (C) Diauxic growth of A1501 in minimal medium K supplemented with 6.0 mM NH4+ and a mixture of 4 mM Suc plus 20 mM Glu. The growth curve (OD600 versus time) is shown together with the measured concentration of glucose remaining in the medium (orange triangles). Growth with succinate alone is shown as a control. (D and E) Diauxic growth of A1501 under conditions similar to (C) but with 4 mM citrate (D) or 4 mM lactate (E) instead of succinate and controls with citrate and lactate alone. (F) Growth curve of A1501 on 4 mM benzoate plus 20 mM glucose and controls with glucose and benzoate alone. See Figure S1 for the growth curve of A1501 on benzoate plus succinate or lactate. Data shown in (A and B) are presented as the means ± SEM (n = 9). Asterisks indicate statistical significance determined using one-way ANOVA with Tukey’s post hoc test: ∗∗∗∗p ≤ 0.0001, ∗∗∗p ≤ 0.001, ∗∗p ≤ 0.01, and ns: non-significant. Data shown in (C–F) are representative of two independent experiments and are presented as the means ± SEM (n = 6).
Figure 2
Figure 2
Systematic investigation of genes involved in carbon catabolite repression and sequence alignment of putative Hfq-binding mRNAs containing a CA motif (A) Localization of the gene clusters on a linear map of the chromosome. See also Table S2 for a functional description of the cbrAB/hfq/crc/crcZ/crcY genes and corresponding substrate-specific catabolic genes. Black arrows indicate genes of interest that were inactivated by homologous suicide plasmid integration using pK18mob as a vector in this study. (B) Analysis of the growth characteristics of P. stutzeri A1501, the corresponding mutant, and complemented strains. a Growth was tested in K medium supplemented with a single carbon source or mixed carbon sources, as indicated, at 30°C after 12 h. In minimal medium K containing 6 mM NH4+ and 20 mM lactate, the growth performance of the mutant strains was similar to that of the wild-type A1501; b Suc, 20 mM succinate; Lac, 20 mM lactate; Cit, 20 mM citrate; Glu, 20 mM glucose; Ben, 4 mM benzoate; c Lac + Glu, 4 mM lactate plus 20 mM glucose; Suc + Glu, 4 mM succinate plus 20 mM glucose; Ben + Glu, 4 mM benzoate plus 20 mM glucose. d Empty vector control. +++, Maximal growth (OD600 ≥ 2.0); ++, moderate growth (2.0 > OD600 > 0.5); +, weak growth (0.5 > OD600 > 0.15); -, no growth (OD600 < 0.15); ×, mutation that completely abolishes the diauxic growth pattern. Experiments were performed three times with similar results. (C) The CA motif located at the 5′ untranslated region close to the translation start site of substrate-specific catabolic gene mRNAs and the coding region of the nitrogenase Fe protein gene nifH mRNA. Sequences of CA motifs are highlighted in yellow. The putative ribosome-binding site (RBS) is underlined. The initiation codon is indicated in red.
Figure 3
Figure 3
Hfq and Crc act as translational repressors of substrate-specific catabolic genes (A) Absolute numbers of copies of the hfq and crc mRNAs during diauxic growth of WT A1501 on 4 mM succinate plus 20 mM glucose. (B–D) Growth of the Δcrc (B), Δhfq (C), ΔhfqΔcrc (D) mutant strains (red) and their corresponding complemented strains (blue) that were grown on 4 mM succinate plus 20 mM glucose. The growth curve (circle) is shown together with the measured concentration of glucose (triangle) remaining in the medium. (E–N) Determination of the binding affinity of labeled Hfq for the target mRNAs containing the WT or mutated CA motifs in the absence and presence of 400 nM Crc. Ligand-dependent changes in MST are plotted as normalized fluorescence (Fnorm) values vs. ligand concentration in a dose-response curve. Fnorm values are plotted as parts per thousand [‰] for binding affinity analysis. N: ssRNA oligonucleotides; wt: wild-type; mut: mutant. (O) The WT or mutated oligonucleotides that contained the 5′-UTR and the full-length coding region of the indicated mRNAs were used for MST analysis. Sequences of the CA motif (AAnAAnAA) are shown in boldface and underlined. Point mutations introduced into synthesized oligonucleotide derivatives are shown in red. N, ssRNA oligonucleotide; wt, wild type; mut, mutation. Data shown in (A–N) are representative of two independent experiments and are presented as means ± SEM (n = 6). See also Figures S2 and S3.
Figure 4
Figure 4
Functional analysis of the regulatory ncRNAs CrcZ and CrcY (A) Absolute levels of the crcZ and crcY transcripts in strain A1501 grown on succinate and other carbon substrates. Bacteria were grown in minimal medium Kcontaining 6.0 mM NH4+ and supplemented with 20 mM lactate (Lac), succinate (Suc), citrate (Cit), and glucose (Glu) and 4 mM benzoate (Ben). A 4 h incubation time was chosen for droplet digital PCR (ddPCR) assays. The absolute transcript level is reported as the number of copies per ng of total RNA. Means ± SEM (n = 6) are shown. Asterisks indicate statistical significance determined using two-way ANOVA with Tukey’s post hoc test: ∗∗∗∗p ≤ 0.0001, ∗p ≤ 0.05, and ns: non-significant. (B) Changes in absolute levels of the crcZ and crcY transcripts during diauxic growth. Bacterial cells were incubated in minimal medium K containing 6.0 mM NH4+ supplemented with a mixture of 4 mM succinate and 20 mM glucose, and samples were collected at regular intervals (0, 2, 4, 6, 8, 10, 12, and 14 h) for ddPCR assays. Data are representative of two independent experiments and are presented as the means ± SEM (n = 4). (C) Relative levels of the crcZ and crcY transcripts on wild-type and mutant backgrounds under the same growth conditions as in (B), which were measured using qRT-PCR. Means ± SEM (n = 9) are shown and asterisks indicate statistical significance determined using two-way ANOVA with Tukey’s post hoc test: ∗∗∗∗p ≤ 0.0001 and ns: non-significant. (D and E) Genetic organization of the crcZ (D) or crcY (E) regions in the P. stutzeri A1501 chromosome. The putative CbrB- or RpoN-binding sites are marked by red boxes. +1 indicates the transcription start site based on a 5′ RACE analysis. The nucleotide sequences of the crcZ and crcY genes are indicated in boldface. Both ncRNAs have five unpaired A-rich regions (shown underlined) containing putative CA motifs to which Hfq can potentially bind. Point mutations were introduced into the synthesized oligonucleotide that was used for the MST analysis (see Figure S5), and the corresponding mutated sequences (indicated in red) are shown above the unpaired region. (F–I) DNase I footprinting analysis of the crcZ (F, G) and crcY (H, I) promoter probes using purified RpoN protein added at 0 and 5.0 μg or purified CbrB protein added at 0 and 15 μg. The RpoN- or CbrB-protected region is indicated by a dotted box, with the nucleotide sequence shown at the bottom. The RpoN- and CbrB-binding sites are marked by red boxes. See also Figures S4 and S5.
Figure 5
Figure 5
Hfq exerts a positive regulatory effect on root-associated nitrogenase activity at the transcriptional and translational levels (A) Nitrogenase activity assays using wild-type and mutant strains associated with or without rice roots in the presence of 4 mM succinate (Suc) and 20 mM glucose (Glu) alone or in combination. Control 1: Rice roots without inoculation; Control 2: rice roots inoculated with A1501 but without an additional carbon source. (B and C) The absolute copy numbers of the nifA mRNA (B) and nifH mRNA (C) under the same conditions as in (A), which were determined using ddPCR. (D and E) Determination of the binding affinity of labeled Hfq to nifH mRNA containing the WT (D) or mutated CA motif (E) using microscale thermophoresis. The CA motifs are shown in parentheses, and point mutations introduced into a synthesized oligonucleotide are shown in red. N, ssRNA oligonucleotide; wt, wild type; mut, mismatch mutation. (F) Analysis of the nifH mRNA half-life in the WT and hfq mutant strains. Rifampicin (400 μg/mL) was added at time 0. At the indicated times, an equal volume of frozen media was added to bring the temperature immediately to 4°C. RNA was extracted, followed by qRT-PCR. Data shown in (A–C) are representative of two independent experiments and are presented as means ± SEM (n = 4). Asterisks indicate statistical significance determined using two-way ANOVA with Tukey’s post hoc test: ∗∗∗∗p ≤ 0.0001, ∗∗∗p ≤ 0.001, ∗∗p ≤ 0.01, ∗p ≤ 0.05, and ns: non-significant. Data shown in (D–F) are presented as the means ± SEM (n = 6).
Figure 6
Figure 6
The contribution of hfq/crc/crcZY genes to improving root colonization (A) The colony morphology of WT and mutant strains was evaluated on minimal medium K that was supplemented with different carbon sources during the 7-day incubation period. Images were taken with the same magnification. (B) Effect of gene mutations on exopolysaccharide production. Suc, succinate at 50 mM; Glu, glucose at 3 mM. Asterisks indicate statistical significance determined using two-way ANOVA with Tukey’s post hoc test: ∗∗∗∗p ≤ 0.0001, ∗∗∗p ≤ 0.001, ∗∗p ≤ 0.01, ∗p ≤ 0.05, and ns: non-significant. (C) Relative expression levels of pslA in A1501 grown on various carbon substrates in the presence or absence of rice roots, as measured using qRT-PCR. (D) Effect of different concentrations of glucose on the transcription of pslA in A1501 grown on minimal K medium supplemented with 6 mM NH4+ and 50 mM succinate. Asterisks indicate statistical significance determined using one-way ANOVA with Tukey’s post hoc test: ∗∗∗∗p ≤ 0.0001. (E) Effect of different concentrations of glucose on exopolysaccharide production by A1501 grown under the same conditions as in (D). Asterisks indicate statistical significance determined using one-way ANOVA with Tukey’s post hoc test: ∗∗p ≤ 0.01 and ns: non-significant. (F) The effect of different glucose concentrations on root colonization by A1501 was determined by counting colony-forming units (CFUs) per g of root. Asterisks indicate statistical significance determined using one-way ANOVA with Tukey’s post hoc test: ∗∗p ≤ 0.01 and ∗p ≤ 0.05. (G) Strain competition experiments. The fitness deficit of the test mutants was shown by co-culturing each mutant with wild-type A1501 mixed in a 1:1 ratio, inoculated at a starting OD600 = 0.1 and grown for 24 h in LB. At 24 h, cultures were serially diluted and plated on LB plates containing the relevant antibiotics to enable counting of each strain. The wild-type strain was used as the competitor in all experiments. Asterisks indicate statistical significance determined using one-way ANOVA with Tukey’s post hoc test: ∗∗∗∗p ≤ 0.0001, ∗p ≤ 0.05, and ns: non-significant. (H) Competitive root colonization experiments. Rice seedlings were co-inoculated with the test mutant and wild-type A1501. After 24 h of incubation, root samples were collected, and the number of CFUs per g root was determined. The red bars represent the percentage of colonies recovered from the tested strains; the blue bars represent the percentage of colonies recovered from the competitor (wild-type) strain. Asterisks indicate statistical significance determined using two-tailed unpaired t-tests: ∗∗p ≤ 0.01, ∗p ≤ 0.05, and ns: non-significant. (I) Quantitative RT-PCR analysis of the transcriptional activities of psl-like genes in the wild-type and Δhfq mutant strains during root colonization. Measurements were normalized to the wild-type values, and fold differences are plotted. Data are the means and standard deviations of three independent experiments. Asterisks indicate statistical significance determined using two-way ANOVA with Tukey’s post hoc test: ∗∗∗∗p ≤ 0.0001.
Figure 7
Figure 7
Schematic representation of the regulatory network controlling carbon catabolic repression, nitrogen fixation, and Psl exopolysaccharide biosynthesis in response to environmental signals A1501 preferentially catabolized the top tier substrates succinate and lactate, followed by relatively less favorable substrate citrate, and ultimately the non-preferred substrates glucose and benzoate. The Hfq/Crc/CrcZY regulatory system orchestrates this preference. ① In the presence of preferred carbon sources, Hfq represses the expression of catabolic targets for non-preferred substrates by binding directly to mRNAs while Crc interacts with Hfq, enhancing the repression exerted by Hfq. ② Non-preferred carbon sources such as glucose and benzoate substantially increase the expression of CrcZ, acting as a key antagonist to Hfq and relieving Hfq-mediated translational repression. In addition, novel Hfq-mediated activation pathways contribute to efficient root colonization. ③ Hfq optimizes root-associated nitrogenase activity by regulating both nifA and nifH expression at transcriptional and posttranscriptional levels. ④ The intracellular glucose pool is shunted into an as-yet unidentified pathway to produce the Psl exopolysaccharide, which is regulated positively by Hfq at the transcriptional level. Arrows and T-shaped bars indicate positive and negative regulation, respectively. Transcriptional regulation is shown in black, and posttranscriptional regulation is shown in red. Solid lines indicate direct regulation, whereas broken lines indicate indirect regulation through an as yet undetermined mechanism.

Similar articles

Cited by

References

    1. Okano H., Hermsen R., Hwa T. Hierarchical and simultaneous utilization of carbon substrates: mechanistic insights, physiological roles, and ecological consequences. Curr. Opin. Microbiol. 2021;63:172–178. - PMC - PubMed
    1. Görke B., Stülke J. Carbon catabolite repression in bacteria: many ways to make the most out of nutrients. Nat. Rev. Microbiol. 2008;6:613–624. - PubMed
    1. Deutscher J. The mechanisms of carbon catabolite repression in bacteria. Curr. Opin. Microbiol. 2008;11:87–93. - PubMed
    1. Magasanik B. In: The Lactose Operon. Beckwith J., Zipser D., editors. Cold Spring Harbor Laboratory Press; 1970. Glucose effects: inducer exclusion and repression; pp. 189–220.
    1. Silby M.W., Winstanley C., Godfrey S.A.C., Levy S.B., Jackson R.W. Pseudomonas genomes: diverse and adaptable. FEMS Microbiol. Rev. 2011;35:652–680. - PubMed

LinkOut - more resources