

Integrative analyses of potential biomarkers and pathways for non-obstructive azoospermia
- PMID: 36506310
- PMCID: PMC9730279
- DOI: 10.3389/fgene.2022.988047
Integrative analyses of potential biomarkers and pathways for non-obstructive azoospermia
Abstract
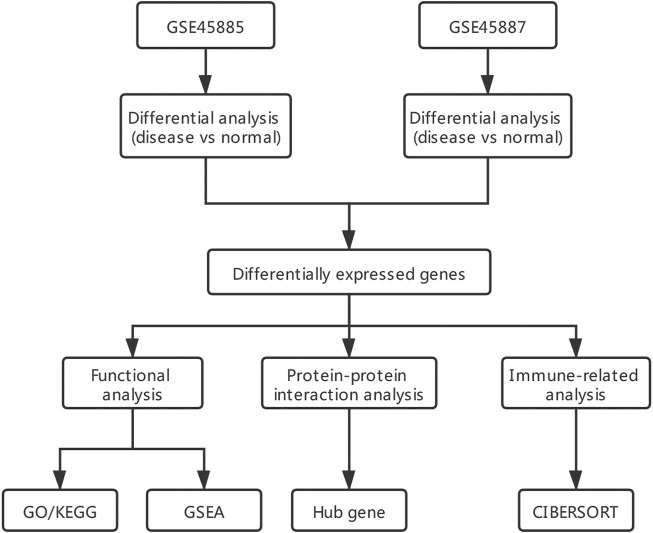
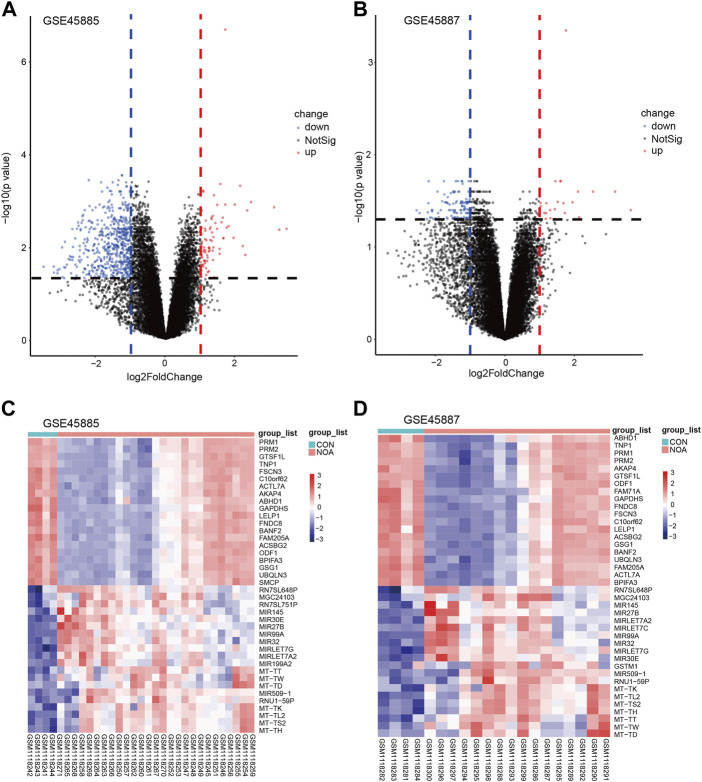
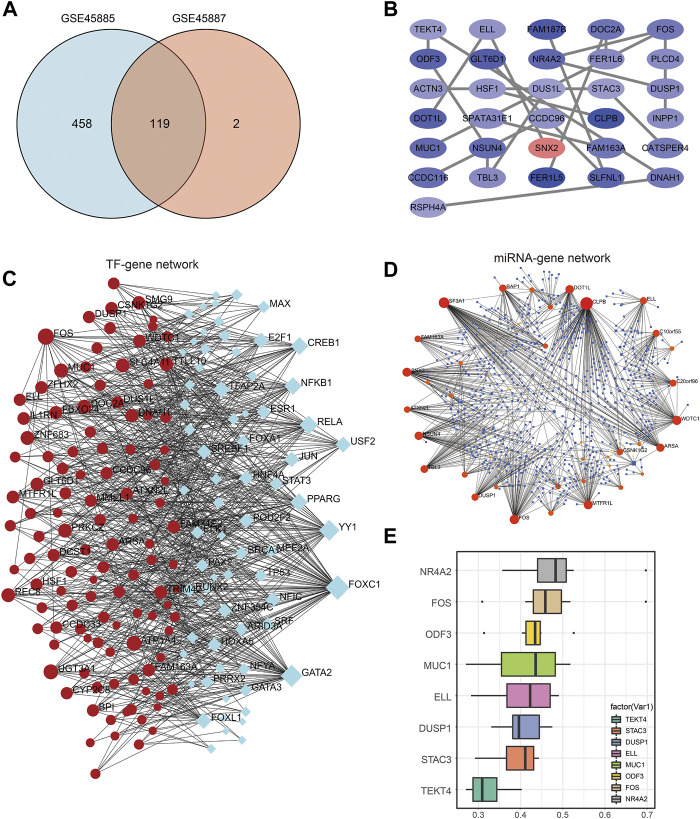
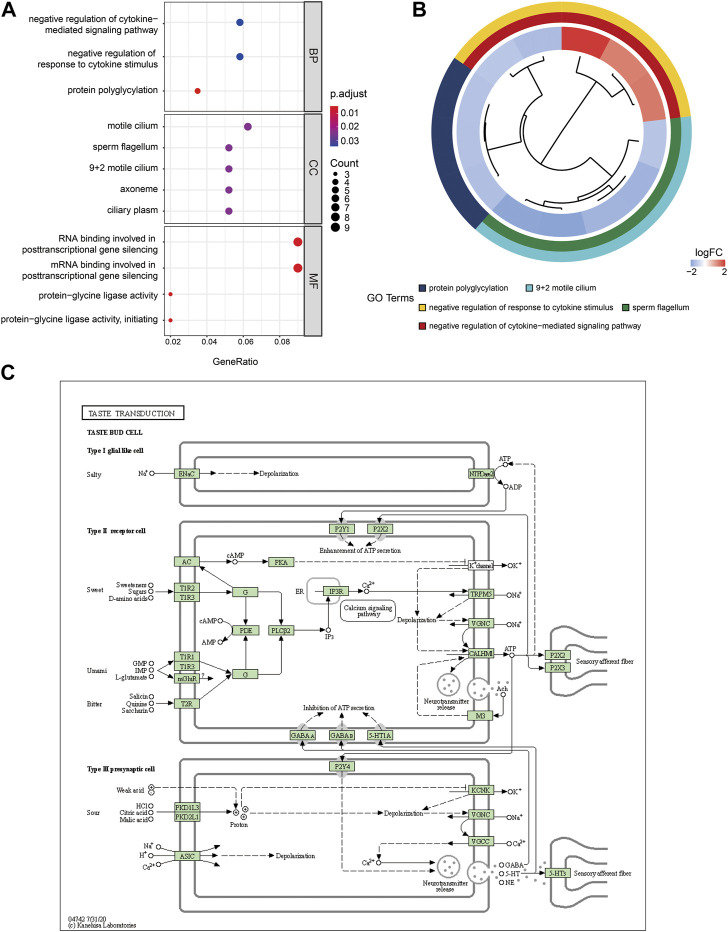
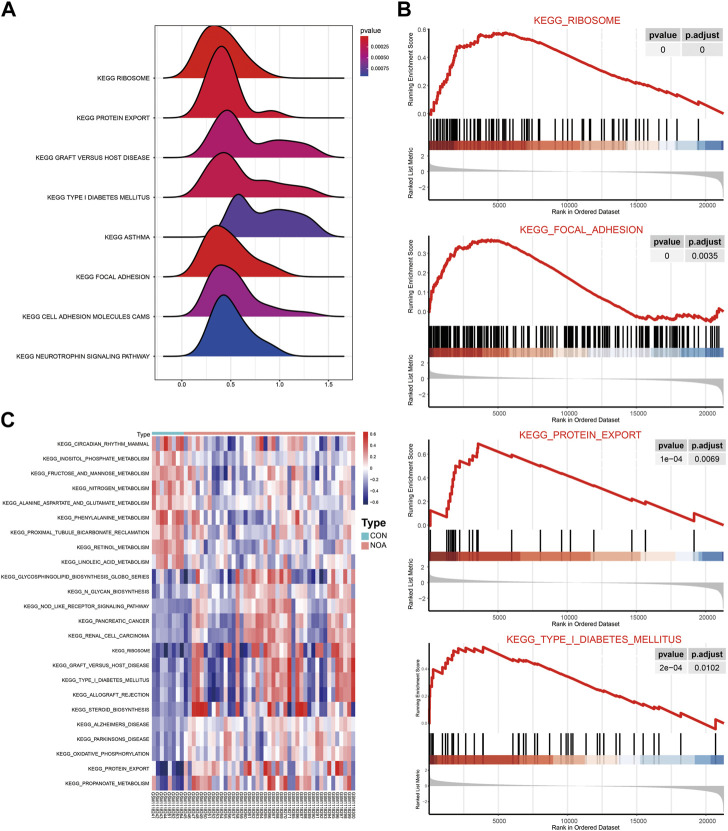
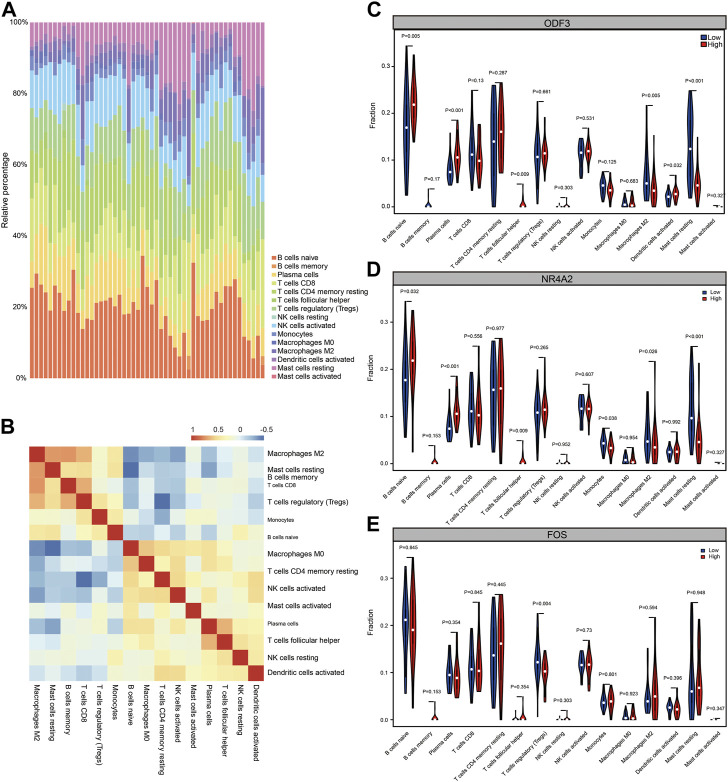
Background: Non-obstructive azoospermia (NOA) is the most severe form of male infertility. Currently, the molecular mechanisms underlying NOA pathology have not yet been elucidated. Hence, elucidation of the mechanisms of NOA and exploration of potential biomarkers are essential for accurate diagnosis and treatment of this disease. In the present study, we aimed to screen for biomarkers and pathways involved in NOA and reveal their potential molecular mechanisms using integrated bioinformatics. Methods: We downloaded two gene expression datasets from the Gene Expression Omnibus (GEO) database. Differentially expressed genes (DEGs) in NOA and matched the control group tissues were identified using the limma package in R software. Subsequently, Gene ontology (GO), Kyoto Encyclopedia of Genes and Genomes (KEGG), gene set enrichment analysis (GSEA), protein-protein interaction (PPI) network, gene-microRNAs network, and transcription factor (TF)-hub genes regulatory network analyses were performed to identify hub genes and associated pathways. Finally, we conducted immune infiltration analysis using CIBERSORT to evaluate the relationship between the hub genes and the NOA immune infiltration levels. Results: We identified 698 common DEGs, including 87 commonly upregulated and 611 commonly downregulated genes in the two datasets. GO analysis indicated that the most significantly enriched gene was protein polyglycylation, and KEGG pathway analysis revealed that the DEGs were most significantly enriched in taste transduction and pancreatic secretion signaling pathways. GSEA showed that DEGs affected the biological functions of the ribosome, focaladhesion, and protein_expor. We further identified the top 31 hub genes from the PPI network, and friends analysis of hub genes in the PPI network showed that NR4A2 had the highest score. In addition, immune infiltration analysis found that CD8+ T cells and plasma cells were significantly correlated with ODF3 expression, whereas naive B cells, plasma cells, monocytes, M2 macrophages, and resting mast cells showed significant variation in the NR4A2 gene expression group, and there were differences in T cell regulatory immune cell infiltration in the FOS gene expression groups. Conclusion: The present study successfully constructed a regulatory network of DEGs between NOA and normal controls and screened three hub genes using integrative bioinformatics analysis. In addition, our results suggest that functional changes in several immune cells in the immune microenvironment may play an important role in spermatogenesis. Our results provide a novel understanding of the molecular mechanisms of NOA and offer potential biomarkers for its diagnosis and treatment.
Keywords: bioinformatics; biomarker; differentially expressed genes; hub genes; non-obstructive azoospermia.
Copyright © 2022 Zhong, Chen, Zhao, Deng, Li, Xie, Zhou, Xian, Li, Luo and Li.
Conflict of interest statement
The authors declare that the research was conducted in the absence of any commercial or financial relationships that could be construed as a potential conflict of interest.
Figures
Similar articles
-
Integrative bioinformatics approaches for identifying potential biomarkers and pathways involved in non-obstructive azoospermia.Transl Androl Urol. 2021 Jan;10(1):243-257. doi: 10.21037/tau-20-1029. Transl Androl Urol. 2021. PMID: 33532314 Free PMC article.
-
Integrated molecular-network analysis reveals infertility-associated key genes and transcription factors in the non-obstructive azoospermia.Eur J Obstet Gynecol Reprod Biol. 2023 Sep;288:183-190. doi: 10.1016/j.ejogrb.2023.07.023. Epub 2023 Aug 4. Eur J Obstet Gynecol Reprod Biol. 2023. PMID: 37549510
-
Identification of Potential Biomarkers Associated with Spermatogenesis in Azoospermia.Clin Lab. 2024 Nov 1;70(11). doi: 10.7754/Clin.Lab.2024.240541. Clin Lab. 2024. PMID: 39506588
-
JUN and ATF3 in Gout: Ferroptosis-related potential diagnostic biomarkers.Heliyon. 2024 Oct 30;10(22):e39957. doi: 10.1016/j.heliyon.2024.e39957. eCollection 2024 Nov 30. Heliyon. 2024. PMID: 39619595 Free PMC article. Review.
-
Identification of potential genes associated with metastasis in osteosarcoma: an integrated bioinformatics analysis.Musculoskelet Surg. 2025 Feb 25. doi: 10.1007/s12306-025-00891-z. Online ahead of print. Musculoskelet Surg. 2025. PMID: 40000579 Review.
Cited by
-
Identifying potential biomarkers for non-obstructive azoospermia using WGCNA and machine learning algorithms.Front Endocrinol (Lausanne). 2023 Oct 3;14:1108616. doi: 10.3389/fendo.2023.1108616. eCollection 2023. Front Endocrinol (Lausanne). 2023. PMID: 37854191 Free PMC article.
-
Unveiling the molecular mechanisms of recurrent miscarriage through endoplasmic reticulum stress related gene expression.Sci Rep. 2025 Jan 9;15(1):1452. doi: 10.1038/s41598-024-77642-w. Sci Rep. 2025. PMID: 39789034 Free PMC article.
-
Exploration of the common genetic landscape of COVID-19 and male infertility.Front Immunol. 2023 Mar 20;14:1123913. doi: 10.3389/fimmu.2023.1123913. eCollection 2023. Front Immunol. 2023. PMID: 37020555 Free PMC article.
-
Novel anoikis-related genes for the diagnosis of non-obstructive azoospermia.Transl Androl Urol. 2025 Apr 30;14(4):940-952. doi: 10.21037/tau-2024-745. Epub 2025 Apr 27. Transl Androl Urol. 2025. PMID: 40376522 Free PMC article.
References
-
- Araújo F. C., Oliveira C. A., Reis A. B., Del Puerto H. L., Martins A. S., Reis F. M. (2009). Expression of the proto-oncogene c-fos and the immunolocalization of c-fos, phosphorylated c-fos and estrogen receptor beta in the human testis. Histol. Histopathol. 24, 1515–1522. PMID: 19795350. 10.14670/HH-24.1515 - DOI - PubMed
LinkOut - more resources
Full Text Sources
Research Materials
Miscellaneous