

Applications of machine learning in metabolomics: Disease modeling and classification
- PMID: 36506316
- PMCID: PMC9730048
- DOI: 10.3389/fgene.2022.1017340
Applications of machine learning in metabolomics: Disease modeling and classification
Abstract
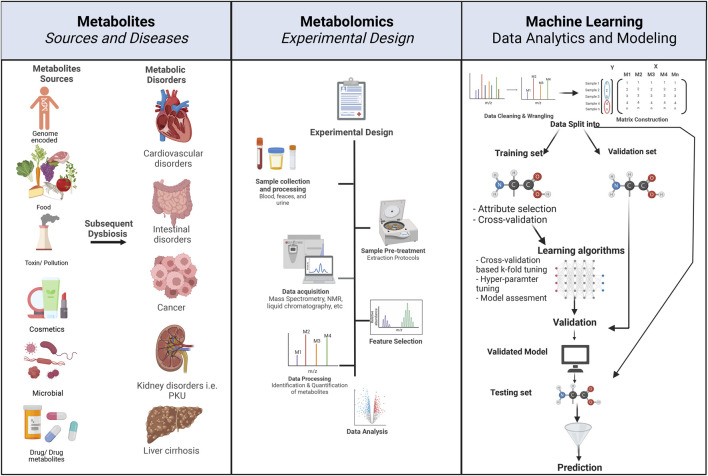
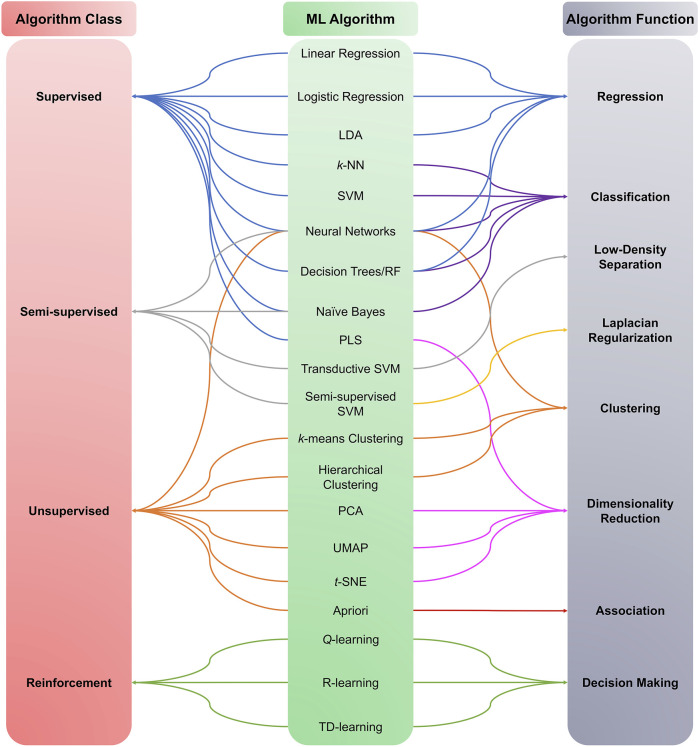
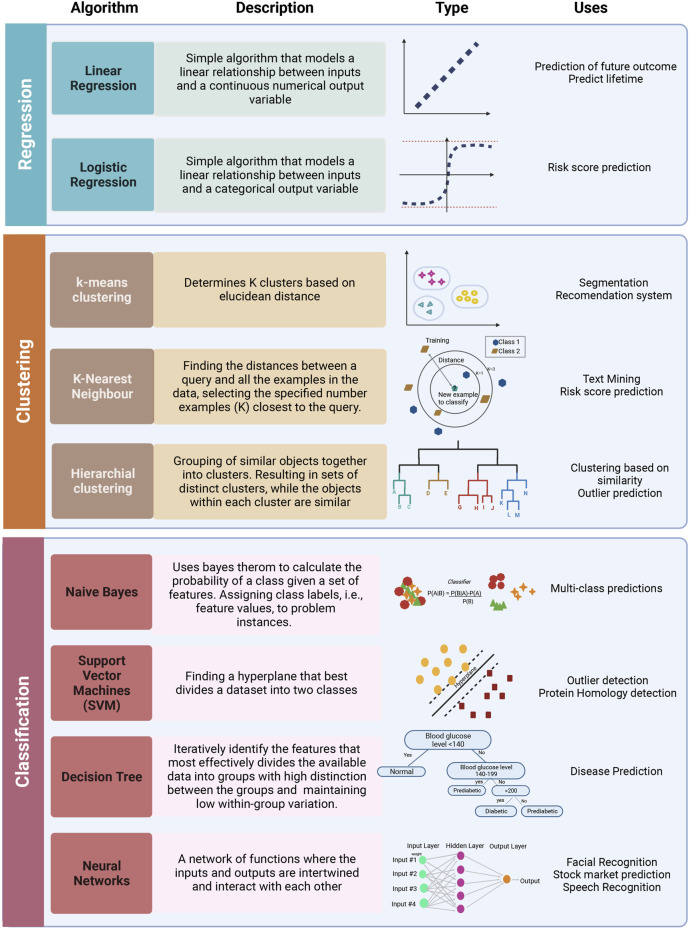
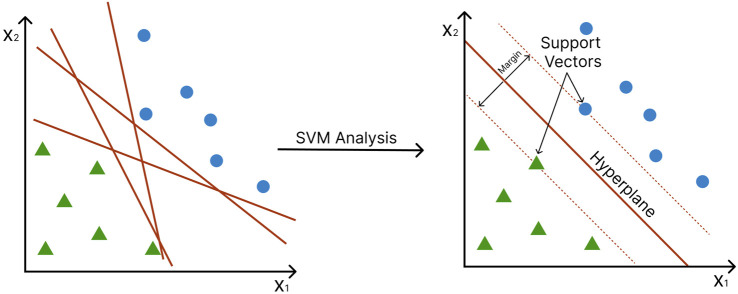
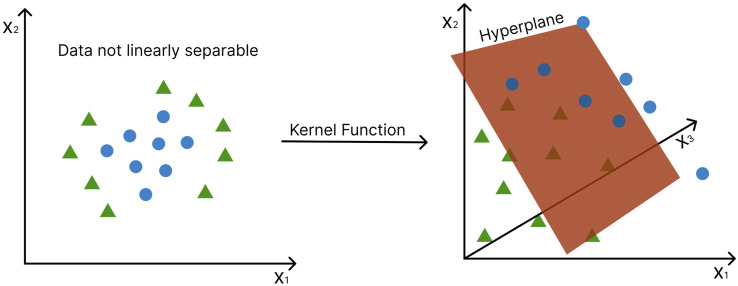
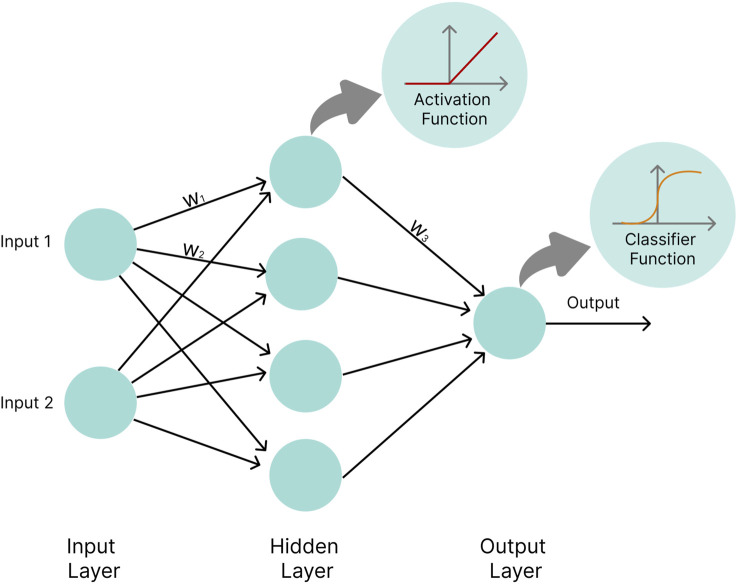
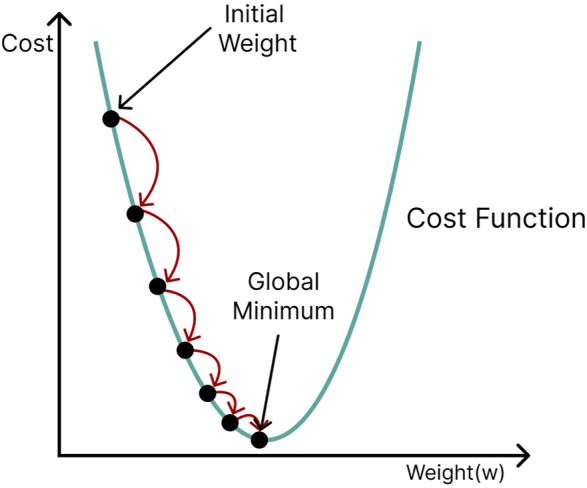
Metabolomics research has recently gained popularity because it enables the study of biological traits at the biochemical level and, as a result, can directly reveal what occurs in a cell or a tissue based on health or disease status, complementing other omics such as genomics and transcriptomics. Like other high-throughput biological experiments, metabolomics produces vast volumes of complex data. The application of machine learning (ML) to analyze data, recognize patterns, and build models is expanding across multiple fields. In the same way, ML methods are utilized for the classification, regression, or clustering of highly complex metabolomic data. This review discusses how disease modeling and diagnosis can be enhanced via deep and comprehensive metabolomic profiling using ML. We discuss the general layout of a metabolic workflow and the fundamental ML techniques used to analyze metabolomic data, including support vector machines (SVM), decision trees, random forests (RF), neural networks (NN), and deep learning (DL). Finally, we present the advantages and disadvantages of various ML methods and provide suggestions for different metabolic data analysis scenarios.
Keywords: biomarkers; deep learning; machine learning; metabolic disorders; metabolomics.
Copyright © 2022 Galal, Talal and Moustafa.
Conflict of interest statement
The authors declare that the research was conducted in the absence of any commercial or financial relationships that could be construed as a potential conflict of interest.
Figures
Similar articles
-
Deep Learning Accurately Predicts Estrogen Receptor Status in Breast Cancer Metabolomics Data.J Proteome Res. 2018 Jan 5;17(1):337-347. doi: 10.1021/acs.jproteome.7b00595. Epub 2017 Nov 27. J Proteome Res. 2018. PMID: 29110491 Free PMC article.
-
Data-driven modeling and prediction of blood glucose dynamics: Machine learning applications in type 1 diabetes.Artif Intell Med. 2019 Jul;98:109-134. doi: 10.1016/j.artmed.2019.07.007. Epub 2019 Jul 26. Artif Intell Med. 2019. PMID: 31383477 Review.
-
A comparative evaluation of the generalised predictive ability of eight machine learning algorithms across ten clinical metabolomics data sets for binary classification.Metabolomics. 2019 Nov 15;15(12):150. doi: 10.1007/s11306-019-1612-4. Metabolomics. 2019. PMID: 31728648 Free PMC article.
-
Evaluation of Classifier Performance for Multiclass Phenotype Discrimination in Untargeted Metabolomics.Metabolites. 2017 Jun 21;7(2):30. doi: 10.3390/metabo7020030. Metabolites. 2017. PMID: 28635678 Free PMC article.
-
Intervention of machine learning in bladder cancer research using multi-omics datasets: systematic review on biomarker identification.Discov Oncol. 2025 Jun 5;16(1):1010. doi: 10.1007/s12672-025-02734-6. Discov Oncol. 2025. PMID: 40471489 Free PMC article. Review.
Cited by
-
Multi-Omics Analysis Reveals the Toxicity of Polyvinyl Chloride Microplastics toward BEAS-2B Cells.Toxics. 2024 May 30;12(6):399. doi: 10.3390/toxics12060399. Toxics. 2024. PMID: 38922079 Free PMC article.
-
Discovery of urinary biosignatures for tuberculosis and nontuberculous mycobacteria classification using metabolomics and machine learning.Sci Rep. 2024 Jul 3;14(1):15312. doi: 10.1038/s41598-024-66113-x. Sci Rep. 2024. PMID: 38961191 Free PMC article.
-
Early detection of feline chronic kidney disease via 3-hydroxykynurenine and machine learning.Sci Rep. 2025 Feb 26;15(1):6875. doi: 10.1038/s41598-025-90019-x. Sci Rep. 2025. PMID: 40011503 Free PMC article.
-
Survival analysis of patient groups defined by unsupervised machine learning clustering methods based on patient metabolomic data.Comput Struct Biotechnol J. 2023 Oct 19;21:5136-5143. doi: 10.1016/j.csbj.2023.10.033. eCollection 2023. Comput Struct Biotechnol J. 2023. PMID: 37920813 Free PMC article.
-
A Comprehensive Machine Learning Approach for COVID-19 Target Discovery in the Small-Molecule Metabolome.Metabolites. 2025 Jan 11;15(1):44. doi: 10.3390/metabo15010044. Metabolites. 2025. PMID: 39852387 Free PMC article.
References
-
- Ahola-Olli A. V., Mustelin L., Kalimeri M., Kettunen J., Jokelainen J., Auvinen J., et al. (2019). Circulating metabolites and the risk of type 2 diabetes: A prospective study of 11, 896 young adults from four Finnish cohorts. Diabetologia 62 (12), 2298–2309. 10.1007/s00125-019-05001-w - DOI - PMC - PubMed
-
- Airola A., Pahikkala T., Waegeman W., De Baets B., Salakoski T. (2011). An experimental comparison of cross-validation techniques for estimating the area under the ROC curve. Comput. Statistics Data Analysis 55 (4), 1828–1844. 10.1016/j.csda.2010.11.018 - DOI
Publication types
LinkOut - more resources
Full Text Sources
Other Literature Sources