. 2022 Nov 24:13:1040039.
doi: 10.3389/fphar.2022.1040039. eCollection 2022.

Application of temperature-responsive HIS-tag fluorophores to differential scanning fluorimetry screening of small molecule libraries

Affiliations

Application of temperature-responsive HIS-tag fluorophores to differential scanning fluorimetry screening of small molecule libraries

Michael H Ronzetti et al. Front Pharmacol. .

Abstract

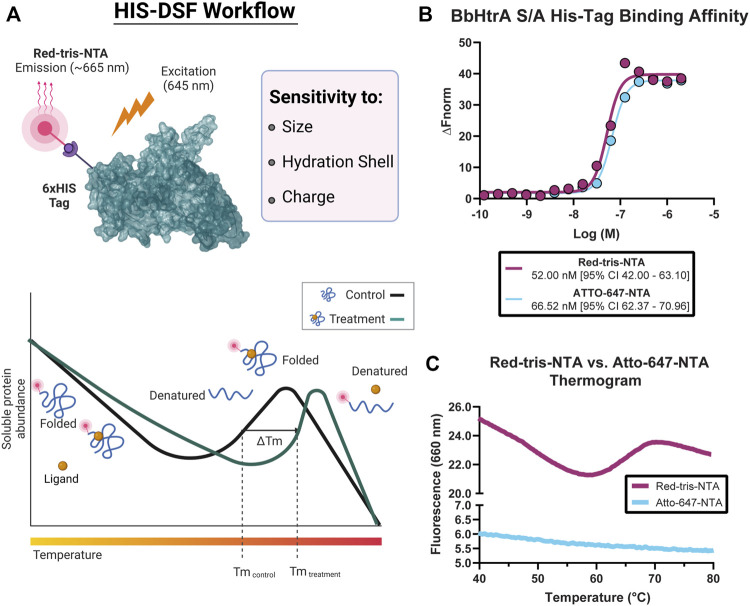
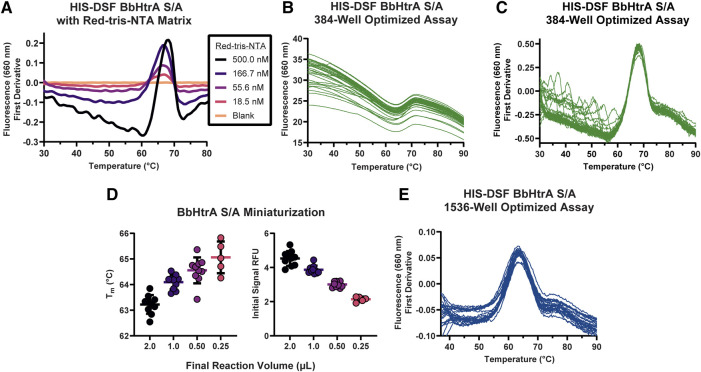
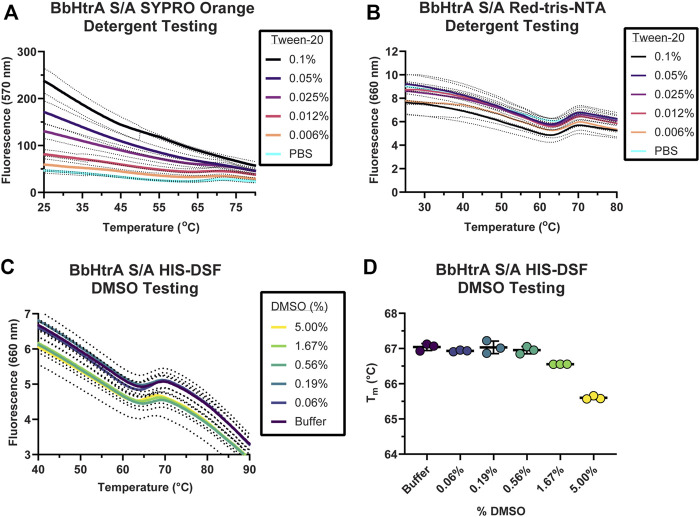
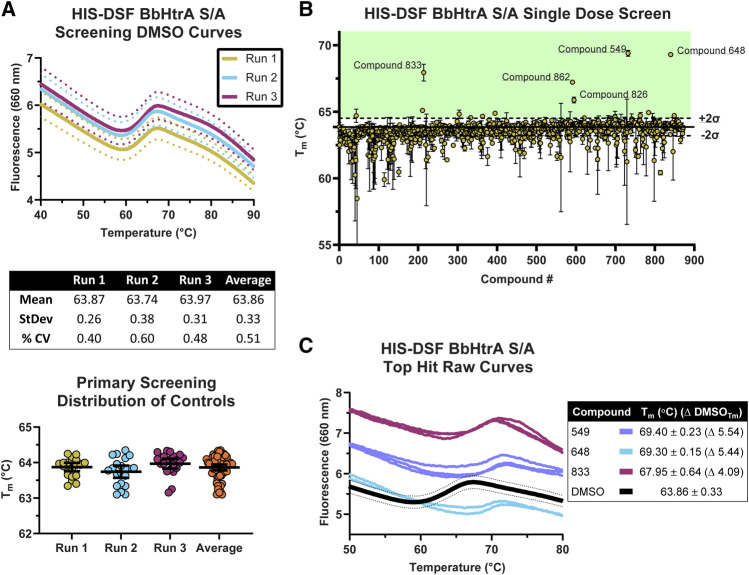
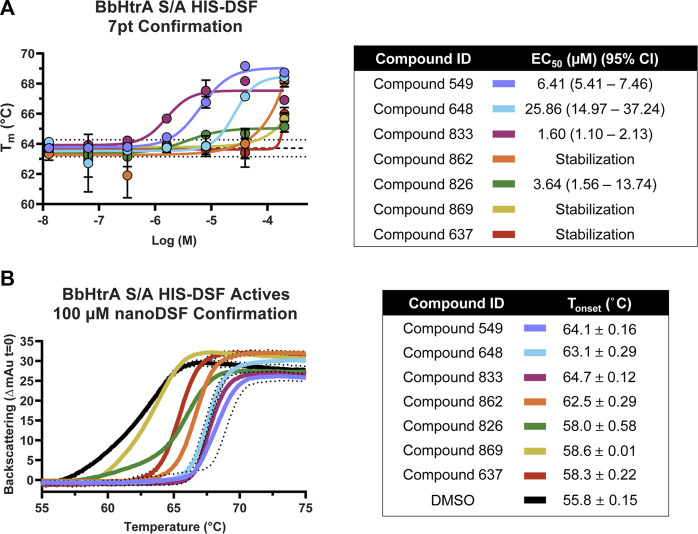
Differential scanning fluorimetry is a rapid and economical biophysical technique used to monitor perturbations to protein structure during a thermal gradient, most often by detecting protein unfolding events through an environment-sensitive fluorophore. By employing an NTA-complexed fluorophore that is sensitive to nearby structural changes in histidine-tagged protein, a robust and sensitive differential scanning fluorimetry (DSF) assay is established with the specificity of an affinity tag-based system. We developed, optimized, and miniaturized this HIS-tag DSF assay (HIS-DSF) into a 1536-well high-throughput biophysical platform using the Borrelial high temperature requirement A protease (BbHtrA) as a proof of concept for the workflow. A production run of the BbHtrA HIS-DSF assay showed a tight negative control group distribution of Tm values with an average coefficient of variation of 0.51% and median coefficient of variation of compound Tm of 0.26%. The HIS-DSF platform will provide an additional assay platform for future drug discovery campaigns with applications in buffer screening and optimization, target engagement screening, and other biophysical assay efforts.

Keywords: biochemistry; biophysical screening; differential scanning fluorimetry; high-throughput sceening; small molecule screening.


Conflict of interest statement

The authors declare that the research was conducted in the absence of any commercial or financial relationships that could be construed as a potential conflict of interest.

Figures

FIGURE 1
FIGURE 1
Overview of the histidine-tagged differential scanning fluorimetry assay (HIS-DSF). (A) Schematic representation of the His-tagged protein of interest labeled specifically by the Red-tris-NTA fluorophore by the Ni(II)-nitrilotriacetic acid (NTA) moiety (top) and the design and workflow of the HIS-DSF assay (bottom). (B) Evaluation of the affinity for the NTA-fluorophores towards HIS-tagged BbHtrA S/A by MST. (C) Testing HIS-tag directed fluorophores in a differential scanning fluorimetry experiment. Labeled protein (as described in the Materials and Methods section) was run in a standard DSF melting experiment to check for the presence of melting curves.
FIGURE 2
FIGURE 2
Establishing conditions and miniaturization of the HIS-DSF assay. (A) A titration matrix of BbHtrA S/A and Red-tris-NTA concentrations was profiled for its performance in a DSF temperature ramp. Pictured is a representative experiment of the 3.5 µM protein concentration group, with individual curves representing different concentrations of Red-tris-NTA or buffer. (B) Raw thermogram traces for n = 36 replicates of the matrix-derived best concentrations of protein and dye in 384-well format. (C) First derivative of the n = 36 replicate wells of the optimized HIS-DSF reaction. (D) Scatter plot of Tm and initial signal RFU values from miniaturization of the HIS-DSF BbHtrA S/A reaction into 1536-well format. Lines represent the mean of ten replicates with error bars representing the standard deviation. (E) The first derivatives of raw thermogram traces for n = 36 replicates of the optimized and miniaturized HIS-DSF BbHtrA S/A reaction in 1536-well format.
FIGURE 3
FIGURE 3
Testing buffer conditions for the HIS-DSF assay. (A,B) Melting behavior of BbHtrA S/A in presence of different concentrations of Tween-20 detergent reported by SYPRO Orange (A) or when labeled with Red-tris-NTA (B). Lines represent the mean of three replicates with dots representing the standard deviation. (C) Raw thermogram of the optimized HIS-DSF BbHtrA S/A reaction in the presence of different concentrations of DMSO. Lines represent the mean of three replicates with dotted lines representing the standard deviation. (D) Scatter plot of the Tm values from the optimized HIS-DSF BbHtrA S/A reaction in the presence of different concentrations of DMSO. Lines represent the mean of three replicates with error bars representing the standard deviation.
FIGURE 4
FIGURE 4
Screening of the NCATS Protease Inhibitor small molecule library using the optimized HIS-DSF assay. (A) Thermograms of the negative control DMSO wells from the three screening replicates. Each differently colored line represents the means of 24 negative control wells in a single replicate screening run with dotted lines representing the 95% confidence interval. Negative control wells are also clustered according to their Tm for each screening run, with whisker plots representing the mean with error bars showing the 95% confidence interval. (B) Distribution of the Tm values for each compound in the small molecule library arranged by masked compound ID. Each point represents the mean of the three screening runs with error bars representing the 95% confidence interval. The solid line represents the mean of the negative control DMSO wells, with dashed lines above and below representing two times the standard deviation of the negative control DMSO wells, with the green shaded area representing the area where compounds are selected for follow-up testing. (C) Thermograms of the top three hits in the HIS-DSF primary screen. Each line represents an individual replicate from each screening run, while the DMSO thermogram line represents the mean of the negative control wells with dotted lines representing the 95% confidence interval.
FIGURE 5
FIGURE 5
Confirmation and follow-up on the BbHtrA S/A hit molecules from the HIS-DSF primary screen. (A) Dose-response curves for the compounds that validated from the primary screen. Each point shown is the mean for five replicates at an individual concentration, with error bars representing the standard deviation of the replicates. The dose-response values were fit with a four-parameter log-logistic fit to derive the EC50 and 95% confidence interval. (B) Single dose stabilization as detected by nanoDSF for the 7 compounds that confirmed by dose-response HIS-DSF. The lines represent the mean backscattering signals for 3 replicates, with dotted lines representing the standard deviation of the mean.
FIGURE 6
FIGURE 6
BbHtrA proteolytic activity in the presence of hit molecules. (A) Dose-response curves for hit molecules in a casein-BODIPY proteolysis assay using BbHtrA WT. Points represent the mean at each individual dose with error bars representing the standard deviation, with a dashed line and dotted lines representing the mean and ±2 standard deviations of negative control samples. The dose-response values are fit with a four-parameter log logistic fit to derive the IC50. (B) SDS-PAGE gel of casein digests with BbHtrA WT in the presence of 100 µM compound. Gels were stained with Imperial Blue protein stain overnight.

Similar articles

Cited by

References

    1. Ablinger E., Leitgeb S., Zimmer A. (2013). Differential scanning fluorescence approach using a fluorescent molecular rotor to detect thermostability of proteins in surfactant-containing formulations. Int. J. Pharm. 441, 255–260. 10.1016/j.ijpharm.2012.11.035 - DOI - PubMed
    1. Amaning K., Lowinski M., Vallee F., Steier V., Marcireau C., Ugolini A., et al. (2013). The use of virtual screening and differential scanning fluorimetry for the rapid identification of fragments active against MEK1. Bioorg. Med. Chem. Lett. 23, 3620–3626. 10.1016/j.bmcl.2013.04.003 - DOI - PubMed
    1. Backert S., Bernegger S., Skorko-Glonek J., Wessler S. (2018). Extracellular HtrA serine proteases: An emerging new strategy in bacterial pathogenesis. Cell. Microbiol. 20, e12845. 10.1111/cmi.12845 - DOI - PubMed
    1. Baljinnyam B., Ronzetti M., Yasgar A., Simeonov A. (2020a2089). Applications of differential scanning fluorometry and related technologies in characterization of protein-ligand interactions. Methods Mol. Biol. 2089, 47–68. 10.1007/978-1-0716-0163-1_4 - DOI - PubMed
    1. Baljinnyam B., Ronzetti M., Yasgar A., Simeonov A. (2020b). “Applications of differential scanning fluorometry and related technologies in characterization of protein–ligand interactions,” in Targeting enzymes for pharmaceutical development: Methods and protocols. Editor Labrou N. E. (New York, NY: Springer US; ). - PubMed

LinkOut - more resources