. 2022 Dec 22;25(12):105720.
doi: 10.1016/j.isci.2022.105720. Epub 2022 Dec 5.

The SARS-CoV-2 spike S375F mutation characterizes the Omicron BA.1 variant

Affiliations

The SARS-CoV-2 spike S375F mutation characterizes the Omicron BA.1 variant

Izumi Kimura et al. iScience. .

Abstract

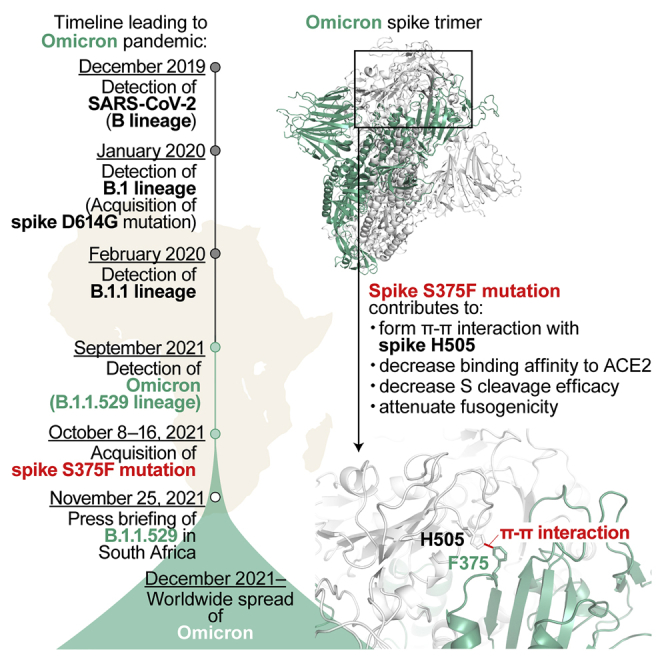
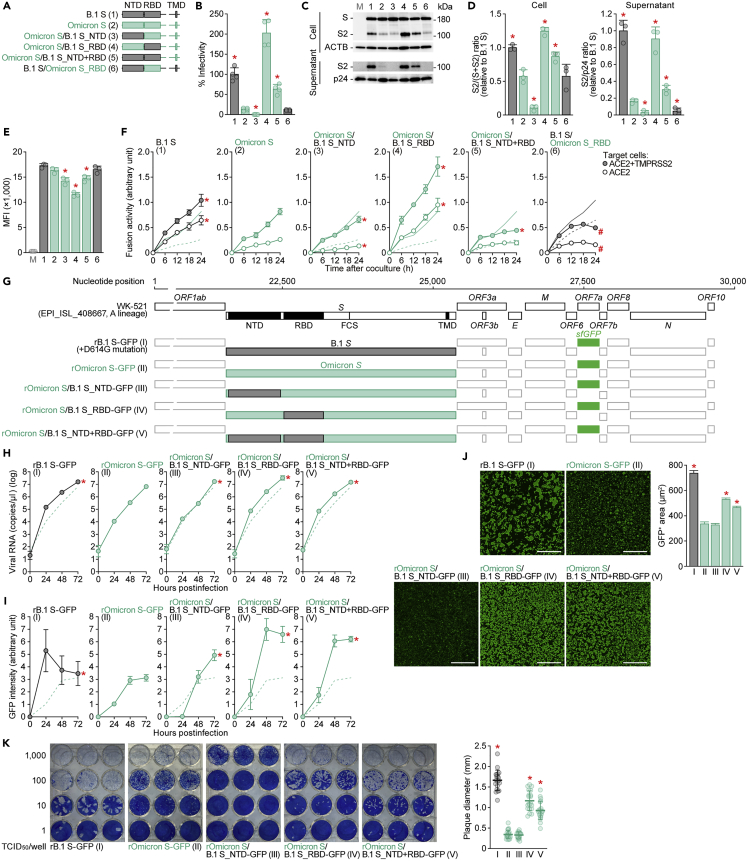
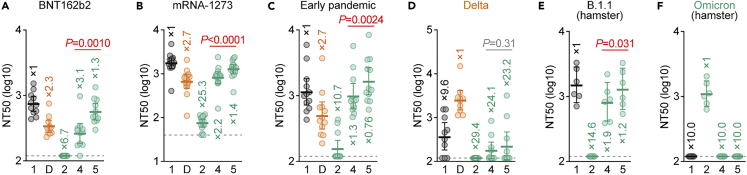
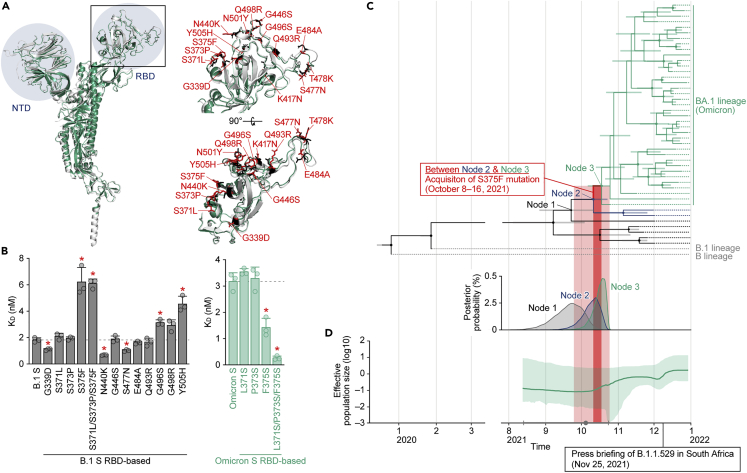
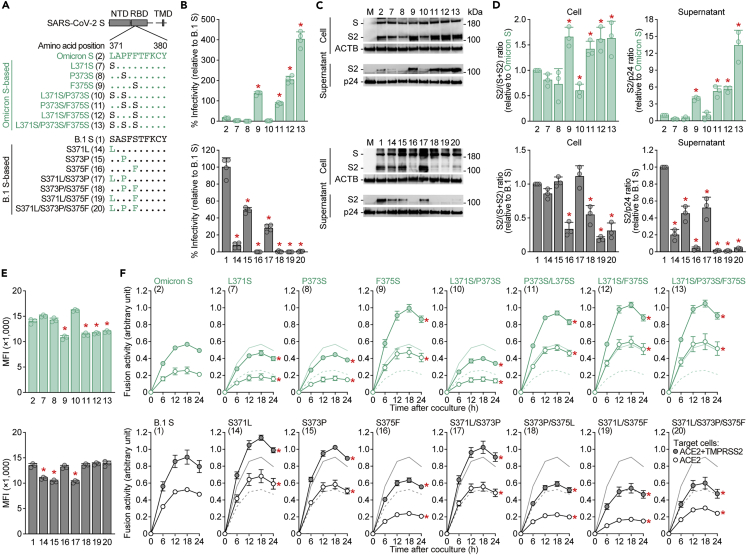
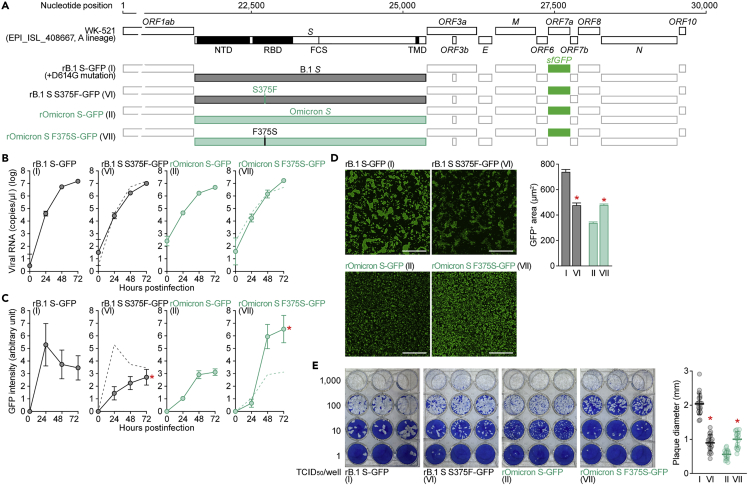
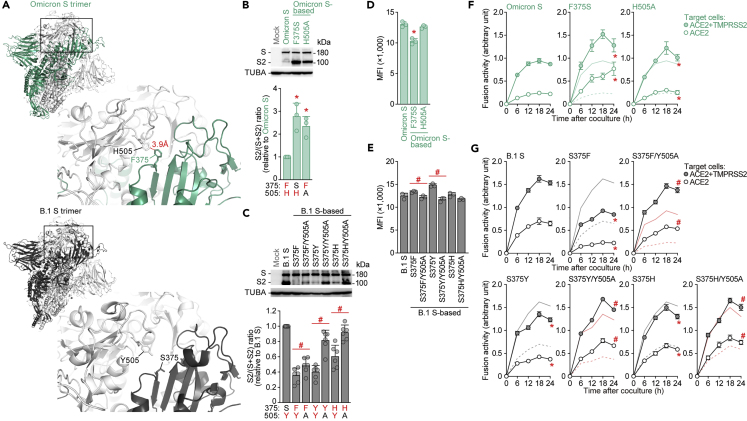
Recent studies have revealed the unique virological characteristics of Omicron, particularly those of its spike protein, such as less cleavage efficacy in cells, reduced ACE2 binding affinity, and poor fusogenicity. However, it remains unclear which mutation(s) determine these three virological characteristics of Omicron spike. Here, we show that these characteristics of the Omicron spike protein are determined by its receptor-binding domain. Of interest, molecular phylogenetic analysis revealed that acquisition of the spike S375F mutation was closely associated with the explosive spread of Omicron in the human population. We further elucidated that the F375 residue forms an interprotomer pi-pi interaction with the H505 residue of another protomer in the spike trimer, conferring the attenuated cleavage efficiency and fusogenicity of Omicron spike. Our data shed light on the evolutionary events underlying the emergence of Omicron at the molecular level.

Keywords: Molecular biology; Virology.


Conflict of interest statement

The authors declare that no competing interests exist.

Figures

None
Graphical abstract
Figure 1
Figure 1
Virological properties conferred by the Omicron RBD (A) Scheme of S chimeras used in this study. The numbers in parentheses are identical to those in Figures 1B–1E and 2. NTD, N-terminal domain; RBD, receptor-binding domain; TMD, transmembrane domain. (B) Pseudovirus assay. HIV-1-based reporter viruses pseudotyped with SARS-CoV-2 S chimeras (summarized in Figure 1A) were prepared. The pseudoviruses were inoculated into HOS-ACE2/TMPRSS2 cells at 1 ng HIV-1 p24 antigen, and the percentages of infectivity compared to that of the virus pseudotyped with B.1 S (spike 1) are shown. (C and D) Western blot. Representative blots of S-expressing cells and supernatants (C) and quantified band intensity (the ratio of S2 to the full-length S plus S2 proteins for “cell”; the ratio of S2 to HIV-1 p24 for “supernatant”) (D) are shown. M, mock (empty vector-transfected). Uncropped blots are shown in Figure S4. (E) Flow cytometry. The summarized results of the surface S expression are shown. MFI, mean fluorescent intensity; M, mock (empty vector-transfected). (F) SARS-CoV-2 S-based fusion assay. The fusion activity was measured as described in the STAR Methods, and fusion activity (arbitrary units) is shown. For the target cells, HEK293 cells expressing ACE2 and TMPRSS2 (filled) and HEK293 cells expressing ACE2 (open) were used. The results for B.1 S or Omicron S are shown in other panels as black and green lines, respectively. The results in HEK293-ACE2/TMPRSS2 cells and HEK293-ACE2 cells are shown as normal or broken lines, respectively. (G) Scheme of the S-chimeric recombinant SARS-CoV-2 used in this study. FCS, furin cleavage site. The backbone is SARS-CoV-2 strain WK-521 (GISAID ID: EPI_ISL_408667, A lineage). Note that the ORF7a gene is swapped with the sfGFP gene. The numbers in parentheses are identical to those in Figures 1H–1K. (H–J) SARS-CoV-2 infection. VeroE6/TMPRSS2 cells were infected with a series of chimeric recombinant SARS-CoV-2 (shown in G) at MOI (m.o.i.) 0.01. Viral RNA in the supernatant (H) and GFP intensity (I) were measured using routine techniques. Note that the yaxes of the graphs shown in H are log scales. The result for Omicron (virus II) is shown in other panels as a broken green line. (J) Syncytium formation. Left, GFP-positive area at 48 h.p.i. Scale bar, 500 μm. Right, summarized results. I, n = 6,483 cells; II, n = 5,393 cells; III, n = 8,704 cells; IV, n = 13,188 cells; and V, n = 12,749 cells. Representative images are shown in Figure S1. (K) Plaque assay. Left, representative figures.Right, summary of the plaque diameters (20 plaques per virus). Data are expressed as the mean with SD (B, D-F, and H–K) or the median with 95% confidence interval (CI) (J). Assays were performed in quadruplicate (B, H, and I) or triplicate (D–F). Each dot indicates the result of an individual replicate (B, D and E) or an individual plaque (K). Statistically significant differences (∗p <0.05) versus Omicron S (pseudovirus 2 for B, D and E, virus II for J and K) were determined by two-sided Student’s t test (B and E), two-sided paired t test (D), or two-sided Mann–Whitney U test (J and K). In F, H and I, statistically significant differences versus Omicron (spike 2 or virus II) [∗familywise error rates (FWERs)<0.05] (except for the rightmost panel in F) or B.1 (spike 1 or virus I) [#familywise error rates (FWERs)<0.05] (rightmost panel in F) through timepoints were determined by multiple regression. FWERs were calculated using the Holm method. See also Figures S1 and S4.
Figure 2
Figure 2
Immune resistance conferred by the Omicron RBD Neutralization assays were performed with pseudoviruses harboring a series of S protein sequences (summarized in Figure 1A). The numbers are identical to those in Figure 1A. D, Delta variant. Vaccinated sera [BNT162b2 (A, 11 donors); or mRNA-1273 (B, 16 donors)], convalescent sera of individuals infected with an early pandemic virus (before May 2020) (C, 12 donors), or Delta (D, 10 donors) and convalescent sera of hamsters infected with B.1.1 (E, 6 hamsters) or Omicron (F, 6 hamsters) were used. The list of sera used in this experiment is shown in Table S1. Each serum sample was analyzed in triplicate to determine the 50% neutralization titer (NT50). Each dot represents one NT50 value, and the geometric mean and 95% CI are shown. The numbers indicate the fold changes of resistance versus each antigenic variant. Horizontal gray lines indicate the detection limit of each assay (120 for A and C–F; 40 for B). Statistically significant differences between spikes 4 and 5 were determined by a two-sided Wilcoxon signed-rank test. See also Table S1.
Figure 3
Figure 3
Mutations in the Omicron RBD and the evolution of Omicron (A) Structural insights into the mutations in the Omicron RBD. Left, overlaid cryo-EM structures of SARS-CoV-2 B.1 S (PDB: 7KRQ) (white) and Omicron S (PDB: 7T9J) (green) are shown. The NTD and RBD are indicated in blue. The region in the RBD indicated by a square is enlarged in the top right panel. Right, mutated residues in the RBD. The residues in B.1 S and Omicron S are shown in black and red, and the mutations in Omicron S are indicated. (B) ACE2 binding affinity of a series of SARS-CoV-2 S RBD (residues 336–528) mutants tested by yeast surface display. The KD values of the binding of the SARS-CoV-2 S RBD expressed on yeast to soluble ACE2 are shown. (C and D) Evolution of Omicron. (C) Top, a time tree of 44 Omicron variants and two outgroups (B and B.1 lineages). The same tree annotated with the GISAID ID, PANGO lineage and sampling date at each terminal node is shown in Figure S2. Green, Omicron variants containing the S371L, S373P and S375F mutations; blue, Omicron variants containing the S371L and S373P mutations; black, Omicron variants without the S371L/S373P/S375F mutations; and gray, the two outgroups (B and B.1 lineages). The bars on each internal node indicate the 95% highest posterior density (HPD) interval of the estimated time. The size of the circle on each internal node is proportional to the value of posterior probability. Note that “Node 1” corresponds to the time to before the emergence of the S371L and S373P mutations; “Node 2” corresponds to the time after the acquisition of the S371L and S373P mutations and before the emergence of the S375F mutations; and “Node 3” corresponds to the fixation time of the S371L/S373P/S375F mutations in the Omicron variants. The estimated time of each node is as follows: Node 1, September 23, 2021 (95% HPD August 26, 2021 to October 10, 2021); Node 2, October 8, 2021 (95% HPD September 24, 2021 to October 21, 2021); and Node 3, October 16, 2021 (95% HPD October 5, 2021 to October 23, 2021). Bottom, distribution of the posterior probability of the time to the tMRCA of Node 1 (black), Node 2 (blue), and Node 3 (green). (D) Bayesian skyline plot showing the history of the effective population size of 44 Omicron variants. The 95% HPD is shaded in green. The dot (in gray) indicates the estimated tMRCA of the 44 variants (October 5, 2021), and the error bar (in gray) indicates the lower (August 13, 2021) and upper (October 23, 2021) boundaries of the 95% HPD tMRCA. In B, the data are expressed as the mean with SD. The assay was performed in triplicate, and each dot indicates the result of an individual replicate. The horizontal broken lines indicate the value of B.1 S (left) and Omicron S (right), respectively. Statistically significant differences (∗p <0.05) versus B.1 S (left) or Omicron S (right) were determined by two-sided Student’s t tests, and FWERs were calculated using the Holm method. In C and D, the estimated time of S375F emergence [i.e., between “Node 2” and “Node 3” (October 8–16, 2021) in C] is shaded in dark red. The lower and upper boundaries of the 95% HPD tMRCA of “Node 2" and “Node 3”, respectively (i.e., September 24 to October 23, 2021) is shaded in light red. See also Figure S2.
Figure 4
Figure 4
Virological features conferred by the S S375F mutation (A) Scheme of the S mutants used in this study. The numbers in parentheses are identical to those in Figures 4B–4F and S3. (B) Pseudovirus assay. HIV-1-based reporter viruses pseudotyped with SARS-CoV-2 S mutants (summarized in A) were prepared. The pseudoviruses were inoculated into HOS-ACE2/TMPRSS2 cells at 1 ng HIV-1 p24 antigen, and the percent infectivity compared to that of the virus pseudotyped with Omicron S (spike 2, top) or B.1 S (spike 1, bottom) are shown. (C and D) Western blot. Representative blots of S-expressing cells and supernatants (C) and quantified band intensity (the ratio of S2 to the full-length S plus S2 proteins for “cell”; the ratio of S2 to HIV-1 p24 for “supernatant”) (D) are shown. M, mock (empty vector-transfected). Uncropped blots are shown in Figure S4. (E) Flow cytometry. The summarized results of the surface S expression are shown. (F) SARS-CoV-2 S-based fusion assay. The fusion activity was measured as described in STAR Methods, and fusion activity (arbitrary units) is shown. For the target cells, HEK293 cells expressing ACE2 and TMPRSS2 (filled) and HEK293 cells expressing ACE2 (open) were used. The results for Omicron S (top) or B.1 S (bottom) are shown in other panels as green and black lines, respectively. The results in HEK293-ACE2/TMPRSS2 cells and HEK293-ACE2 cells are shown as normal and broken lines, respectively. Data are expressed as the mean with SD. Assays were performed in quadruplicate (B) or triplicate (D–F). In B, D and E, each dot indicates the result of an individual replicate. Statistically significant differences (∗p <0.05) versus the respective parental S [Omicron S (pseudovirus 2, top panels) or B.1 S (spike 1, bottom panels)] were determined by two-sided Student’s t test (B and E) or two-sided paired t test (D). In F, statistically significant differences (∗FWERs<0.05) versus the respective parental S [Omicron S (spike 2, top panels) or B.1 S (spike 1, bottom panels)] through timepoints were determined by multiple regression. FWERs were calculated using the Holm method. See also Figures S3 and S4.
Figure 5
Figure 5
Effect of the S S375F mutation on viral growth dynamics (A) Scheme of the S-chimeric recombinant SARS-CoV-2 used in this study. The numbers in parentheses are identical to those in Figures 5B–5E. (B–D) SARS-CoV-2 infection. VeroE6/TMPRSS2 cells were infected with a series of S-chimeric recombinant SARS-CoV-2 (summarized in A) at an m.o.i. 0.01. The viral RNA in the supernatant (B) and GFP intensity (C) were measured routinely. Note that the yaxes of the graphs shown in B are log scales. The results for the respective parental S are shown in other panels as broken green lines. Assays were performed in quadruplicate (B and C). (D) Syncytium formation. Left, GFP-positive area at 48 h.p.i. Scale bar, 500 μm. Right, summarized results. I, n = 6,483 cells; VI, n = 2,780 cells; II, n = 5,393 cells; and VII, 12,857 cells. The results for B.1-GFP (virus I) and Omicron-GFP (virus II) in C and D (right) are identical to those shown in Figures 1I and 1J (right). Representative images are shown in Figure S1. (E) Plaque assay. Left, representative figures.Right, summary of the plaque diameters (20 plaques per virus). Each dot indicates the result of an individual plaque. Data are expressed as the mean with SD (B, C, and E) or the median with 95% CI (D). In B and C, statistically significant differences (∗FWERs<0.05) versus Omicron-GFP (virus II) through timepoints were determined by multiple regression. FWERs were calculated using the Holm method. In D and E, statistically significant differences (∗p <0.05) versus Omicron-GFP (virus II) were determined by a two-sided Mann–Whitney U test. See also Figure S1.
Figure 6
Figure 6
Effect of the pi-pi interaction between 375F and 505H (A) Structural insights into the SARS-CoV-2 S trimer. Top, the structure of the Omicron S trimer (PDB: 7T9J) reconstructed as described in the STAR Methods. Bottom, cryo-EM structure of the B.1 S trimer (PDB: 7KRQ). The regions indicated in squared are enlarged in the bottom right panels. In the enlarged panels, the residues at position 375 [F in an Omicron S monomer indicated in green (top); S in a B.1 S monomer indicated in black (bottom)] and 505 [H in an Omicron S monomer indicated in white (top); Y in a B.1 S monomer indicated in white (bottom)] are shown. The putative pi-pi interaction between F375 and H505 in the Omicron S trimer is indicated in red (3.9 Å) (B and C) Western blot. Representative blots of S-expressing cells (top) and quantified band intensity (the ratio of S2 to the full-length S plus S2 proteins) (bottom) are shown. In the bottom panels, the residues at positions 375 and 505 are indicated, and aromatic residues (F, H or Y) are indicated in red. Uncropped blots are shown in Figure S4. (D and E) Flow cytometry. The summarized results of the surface S expression are shown. (F and G) SARS-CoV-2 S-based fusion assay. The fusion activity was measured as described in the STAR Methods, and fusion activity (arbitrary units) is shown. For the target cells, HEK293 cells expressing ACE2 and TMPRSS2 (filled) and HEK293 cells expressing ACE2 (open) were used. In F, normal lines, Omicron S with HEK293-ACE2/TMPRSS2 cells; broken lines, Omicron S with HEK293-ACE2 cells. In the panels of S375F, S375Y and S375H in G, normal black lines, B.1 S using HEK293-ACE2/TMPRSS2 cells; broken black lines, B.1 S using HEK293-ACE2 cells; normal red lines. In the panels for S375F/Y505A, S375Y/Y505A and S375H/Y505A in G, normal red line, the result for the respective mutant without the Y505A mutation using HEK293-ACE2/TMPRSS2 cells; broken red line, the result for the respective mutant without the Y505A mutation using HEK293-ACE2 cells. Data are expressed as the mean with SD (B–G). Assays were performed in triplicate (B, D–G) or sextuplicate (C). In B–E, each dot indicates the result of an individual replicate. Statistically significant differences versus Omicron S (∗p <0.05) and between the mutant with and without the Y505A mutation (#p <0.05) were determined by two-sided paired t test (B and C) or two-sided Student’s t test (D and E). In F and G, statistically significant differences versus Omicron S (∗FWERs<0.05) or the mutant without the Y505A mutation (#FWERs<0.05) through timepoints were determined by multiple regression. FWERs were calculated using the Holm method. See also Figure S4.

References

    1. WHO Tracking SARS-CoV-2 Variants. 2022. https://www.who.int/en/activities/tracking-SARS-CoV-2-variants/
    1. National Institute for Communicable Diseases, S.A New COVID-19 Variant Detected in South Africa (November 25, 2021) 2021. https://www.nicd.ac.za/new-covid-19-variant-detected-in-south-africa/
    1. Wu F., Zhao S., Yu B., Chen Y.M., Wang W., Song Z.G., Hu Y., Tao Z.W., Tian J.H., Pei Y.Y., et al. A new coronavirus associated with human respiratory disease in China. Nature. 2020;579:265–269. doi: 10.1038/s41586-020-2008-3. - DOI - PMC - PubMed
    1. Hou Y.J., Chiba S., Halfmann P., Ehre C., Kuroda M., Dinnon K.H., 3rd, Leist S.R., Schäfer A., Nakajima N., Takahashi K., et al. SARS-CoV-2 D614G variant exhibits efficient replication ex vivo and transmission in vivo. Science. 2020;370:1464–1468. doi: 10.1126/science.abe8499. - DOI - PMC - PubMed
    1. Korber B., Fischer W.M., Gnanakaran S., Yoon H., Theiler J., Abfalterer W., Hengartner N., Giorgi E.E., Bhattacharya T., Foley B., et al. Tracking changes in SARS-CoV-2 spike: evidence that D614G increases infectivity of the COVID-19 virus. Cell. 2020;182:812–827.e19. doi: 10.1016/j.cell.2020.06.043. - DOI - PMC - PubMed