. 2022 Nov 23:16:1066528.
doi: 10.3389/fnins.2022.1066528. eCollection 2022.

Integrated transcriptomic and metabolomic profiling reveals dysregulation of purine metabolism during the acute phase of spinal cord injury in rats

Affiliations

Integrated transcriptomic and metabolomic profiling reveals dysregulation of purine metabolism during the acute phase of spinal cord injury in rats

Zhong Zeng et al. Front Neurosci. .

Abstract

Introduction: Spinal cord injury (SCI) results in drastic dysregulation of microenvironmental metabolism during the acute phase, which greatly affects neural recovery. A better insight into the potential molecular pathways of metabolic dysregulation by multi-omics analysis could help to reveal targets that promote nerve repair and regeneration in the future.

Materials and methods: We established the SCI model and rats were randomly divided into two groups: the acute-phase SCI (ASCI) group (n = 14, 3 days post-SCI) and the sham group with day-matched periods (n = 14, without SCI). In each group, rats were sacrificed at 3 days post-surgery for histology study (n = 3), metabolome sequencing (n = 5), transcriptome sequencing (n = 3), and quantitative real-time polymerase chain reaction (n = 3). The motor function of rats was evaluated by double-blind Basso, Beattie, and Bresnahan (BBB) Locomotor Scores at 0, 1, 2, 3 days post-SCI in an open field area. Then the transcriptomic and metabolomic data were integrated in SCI model of rat to reveal the underlying molecular pathways of microenvironmental metabolic dysregulation.

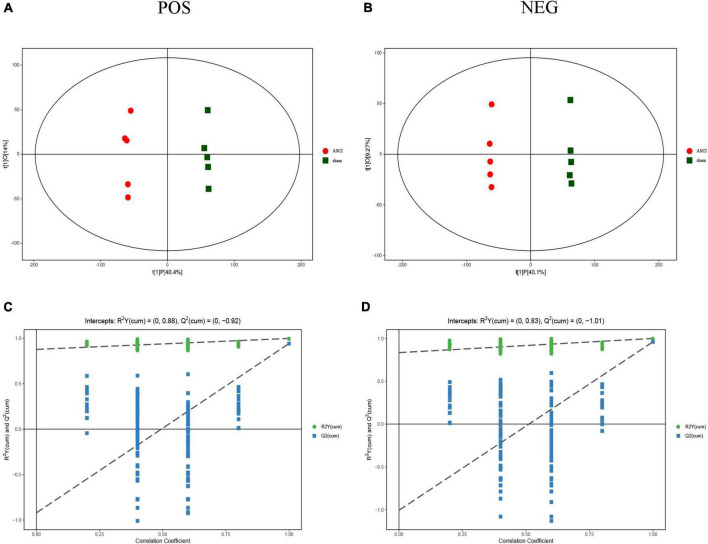
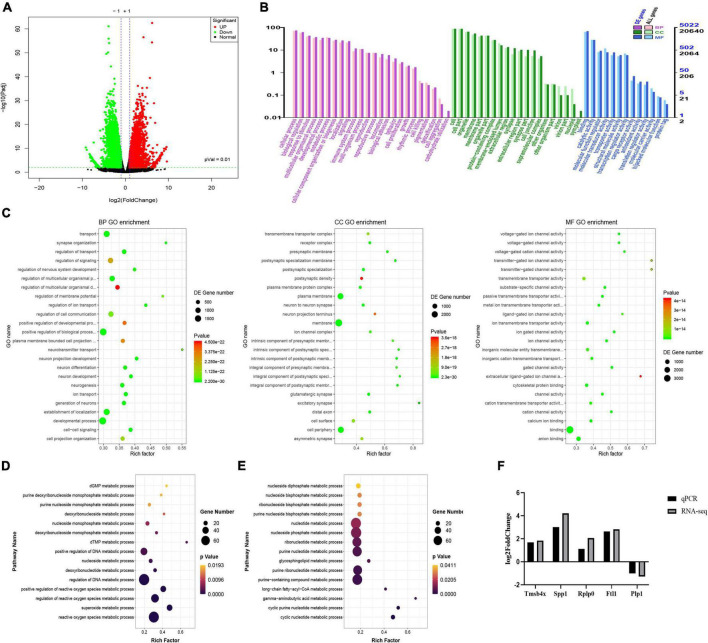
Results: The histology of the microenvironment was significantly altered in ASCI and the locomotor function was significantly reduced in rats. Metabolomics analysis showed that 360 metabolites were highly altered during the acute phase of SCI, of which 310 were up-regulated and 50 were down-regulated, and bioinformatics analysis revealed that these differential metabolites were mainly enriched in arginine and proline metabolism, D-glutamine and D-glutamate metabolism, purine metabolism, biosynthesis of unsaturated fatty acids. Transcriptomics results showed that 5,963 genes were clearly altered, of which 2,848 genes were up-regulated and 3,115 genes were down-regulated, and these differentially expressed genes were mainly involved in response to stimulus, metabolic process, immune system process. Surprisingly, the Integrative analysis revealed significant dysregulation of purine metabolism at both transcriptome and metabolome levels in the acute phase of SCI, with 48 differential genes and 16 differential metabolites involved. Further analysis indicated that dysregulation of purine metabolism could seriously affect the energy metabolism of the injured microenvironment and increase oxidative stress as well as other responses detrimental to nerve repair and regeneration.

Discussion: On the whole, we have for the first time combined transcriptomics and metabolomics to systematically analyze the potential molecular pathways of metabolic dysregulation in the acute phase of SCI, which will contribute to broaden our understanding of the sophisticated molecular mechanisms of SCI, in parallel with serving as a foundation for future studies of neural repair and regeneration after SCI.

Keywords: integrated analysis; metabolomics; purine metabolism; spinal cord injury; transcriptomics.


Conflict of interest statement

The authors declare that the research was conducted in the absence of any commercial or financial relationships that could be construed as a potential conflict of interest.

Figures

FIGURE 1
FIGURE 1
Motor function and histology results during the acute-phase spinal cord injury. (A) HE and Nissl staining of the spinal cord horizontally after spinal cord injury. (B) Motor function deficits after spinal cord injury were assessed by Basso, Beattie, and Bresnahan Locomotor Scores (data were presented as means ± standard deviation, n = 14, Student’s unpaired t-test at different time point, *P < 0.05, sham vs. the acute-phase spinal cord injury). Scale bar = 200/50 μm, applicable to all corresponding sections. BBB, Basso, Beattie, and Bresnahan Locomotor Scores; ASCI, the acute-phase spinal cord injury.
FIGURE 2
FIGURE 2
Score scatter plot of orthogonal projections to latent structures-discriminant analysis (OPLS-DA) model and permutation test of OPLS-DA model for group sham vs. the acute-phase spinal cord injury in both positive ion mode and negative ion mode. (A,B) OPLS-DA model, horizontal axis indicates the predicted principal component scores of the first principal component, demonstrating between-sample group differences, and vertical axis indicates the orthogonal principal component scores, demonstrating within-sample group differences, with each scatter representing a sample and the scatter shape and color indicating different experimental groupings. (C,D) Permutation test of OPLS-DA model shows that the model is good and no overfitting phenomenon. POS, positive ion mode; NEG, negative ion mode; ASCI, the acute-phase spinal cord injury.
FIGURE 3
FIGURE 3
Metabolomic results for group sham vs. the acute-phase spinal cord injury in both positive ion mode and negative ion mode. (A,B) Volcano plot in both positive ion mode and negative ion mode. Each dot represents a metabolite, with significantly upregulated metabolites are indicated in red, significantly down-regulated metabolites are indicated in blue, and non-significantly different metabolites are in gray based on variable importance in the projection > 1 and P < 0.05. (C,D) Heatmap of hierarchical clustering analysis in both positive ion mode and negative ion mode. The horizontal axis represents different experimental groups, the vertical axis represents the differential metabolites compared in that group, the color blocks at different positions represent the relative expression of metabolites in the corresponding position, red color indicates that the substance is highly expressed in the group, blue color indicates that the substance is lowly expressed in the group. (E,F) Pathway analysis in both positive ion mode and negative ion mode. Each bubble in the bubble diagram represents a metabolic pathway, the horizontal axis where the bubble is located and the bubble size indicate the size of the influence factor of that pathway in the analysis, and the vertical axis where the bubble is located and the bubble color indicate the P-value of the enrichment analysis (taking the negative natural logarithm, namely −ln(p)). POS: positive ion mode; NEG, negative ion mode; ASCI, the acute-phase spinal cord injury.
FIGURE 4
FIGURE 4
Transcriptome changes during the acute-phase spinal cord injury. (A) Changes in genes between the sham and acute-phase spinal cord injury groups. Compared with the sham group, red indicates significant upregulation, green indicates significant downregulation, and black indicates no significant change in the acute-phase spinal cord injury, based on P < 0.01. (B) Gene ontology annotation classification statistics chart. The horizontal axis is the gene ontology classification, the vertical axis is the percentage of the number of genes on the left and the number of genes on the right. (C) The top 20 pathways enriched for differentially expressed genes in biological process, cellular component and molecular function are shown in order. (D) Metabolic processes involved in upregulated genes. The vertical axis is the name of the metabolic processes, and the horizontal axis is the number of genes annotated to that metabolic process and its number as a proportion of the total number of genes annotated on it. (E) Metabolic processes involved in downregulated genes. (F) Quantitative real-time polymerase chain reaction validation of transcriptome data. The result verified that the expression trends of the five genes selected randomly were consistent with the transcriptomic data, where Tmsb4x, Spp1, Rplp0, Ftl1 were upregulated and Plp1 was downregulated. GO, gene ontology; BP, biological process; CC, cellular component; MF, molecular function; QPCR, quantitative real-time polymerase chain reaction; Rplp0, ribosomal protein lateral stalk subunit P0; Tmsb4x, thymosin beta 4, X-linked; Ftl1, ferritin light chain 1; Spp1, secreted phosphoprotein 1; Plp1, proteolipid protein 1.
FIGURE 5
FIGURE 5
Integration analysis of transcriptomics and metabolomics. (A) Pathways enriched with both genes and metabolites. Each bubble in the bubble diagram represents a pathway, the horizontal axis where the bubble is located and the bubble size indicate the size of the influence factor of that pathway in the analysis, and the vertical axis where the bubble is located and the bubble color indicate the P-value of the enrichment analysis (taking the negative natural logarithm, namely −ln(p)). (B) The molecular mechanisms of dysregulation of purine metabolism at the gene and metabolite levels. Circles represent metabolites and colored ones represent differential metabolites, and rectangles represent genes and colored ones represent differential genes.
FIGURE 6
FIGURE 6
Schematic diagram of this study.
FIGURE 7
FIGURE 7
Simplified diagram of purine metabolism dysregulation in the acute phase of spinal cord injury.

Similar articles

Cited by

References

    1. Ahuja C. S., Fehlings M. (2016). Concise review: Bridging the gap: Novel neuroregenerative and neuroprotective strategies in spinal cord injury. Stem. Cells Transl. Med. 5 914–924. 10.5966/sctm.2015-0381 - DOI - PMC - PubMed
    1. Ahuja C. S., Wilson J. R., Nori S., Kotter M. R. N., Druschel C., Curt A., et al. (2017). Traumatic spinal cord injury. Nat. Rev. Dis. Primers 3:17018. 10.1038/nrdp.2017.18 - DOI - PubMed
    1. Alizadeh A., Dyck S. M., Karimi-Abdolrezaee S. (2019). Traumatic spinal cord injury: An overview of pathophysiology, models and acute injury mechanisms. Front. Neurol. 10:282. 10.3389/fneur.2019.00282 - DOI - PMC - PubMed
    1. Anjum A., Yazid M. D., Fauzi Daud M., Idris J., Ng A. M. H., Selvi Naicker A., et al. (2020). Spinal cord injury: Pathophysiology, multimolecular interactions, and underlying recovery mechanisms. Int. J. Mol. Sci. 21:7533. 10.3390/ijms21207533 - DOI - PMC - PubMed
    1. Asantewaa G., Harris I. S. (2021). Glutathione and its precursors in cancer. Curr. Opin. Biotechnol. 68 292–299. 10.1016/j.copbio.2021.03.001 - DOI - PubMed

LinkOut - more resources