

Comparative transcriptomic profiling of peach and nectarine cultivars reveals cultivar-specific responses to chilled postharvest storage
- PMID: 36507427
- PMCID: PMC9733835
- DOI: 10.3389/fpls.2022.1062194
Comparative transcriptomic profiling of peach and nectarine cultivars reveals cultivar-specific responses to chilled postharvest storage
Abstract
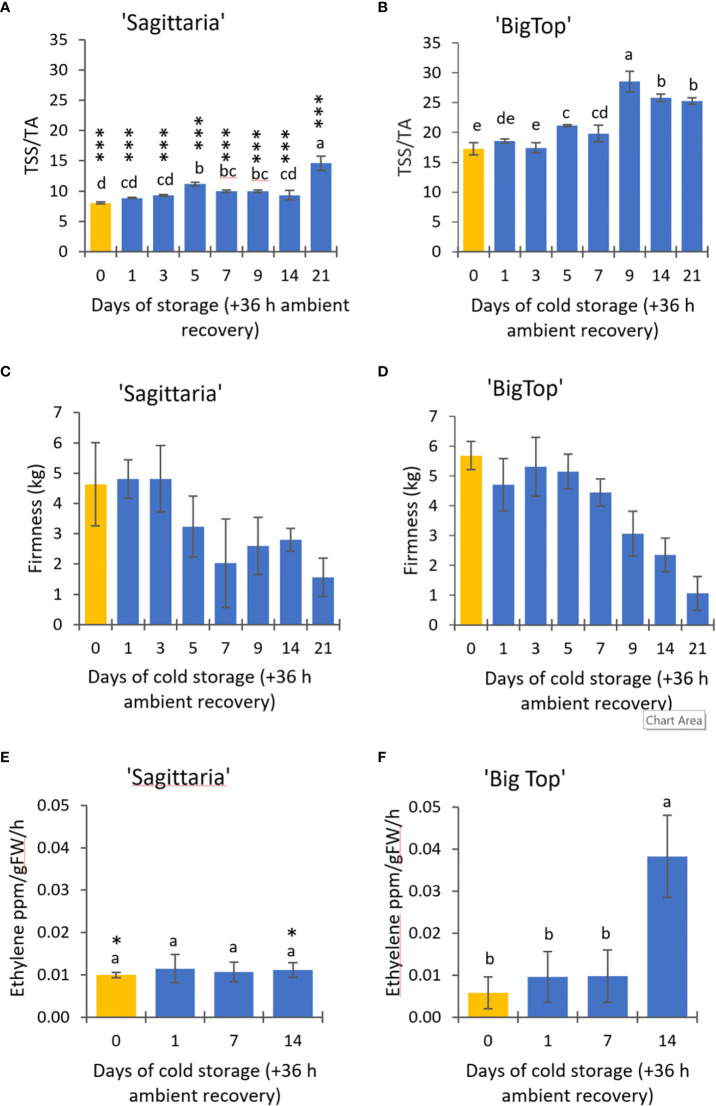
Introduction: Peach (Prunus persica (L.) Batsch,) and nectarine fruits (Prunus persica (L.) Batsch, var nectarine), are characterized by a rapid deterioration at room temperature. Therefore, cold storage is widely used to delay fruit post-harvest ripening and extend fruit commercial life. Physiological disorders, collectively known as chilling injury, can develop typically after 3 weeks of low-temperature storage and affect fruit quality.
Methods: A comparative transcriptomic analysis was performed to identify regulatory pathways that develop before chilling injury symptoms are detectable using next generation sequencing on the fruits of two contrasting cultivars, one peach (Sagittaria) and one nectarine, (Big Top), over 14 days of postharvest cold storage.
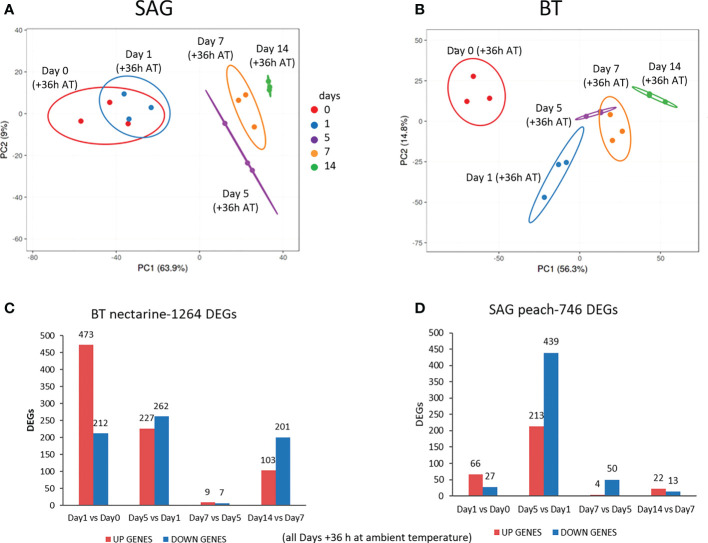
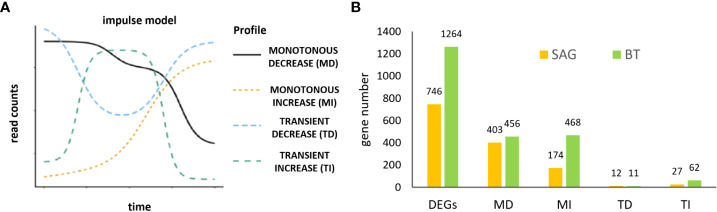
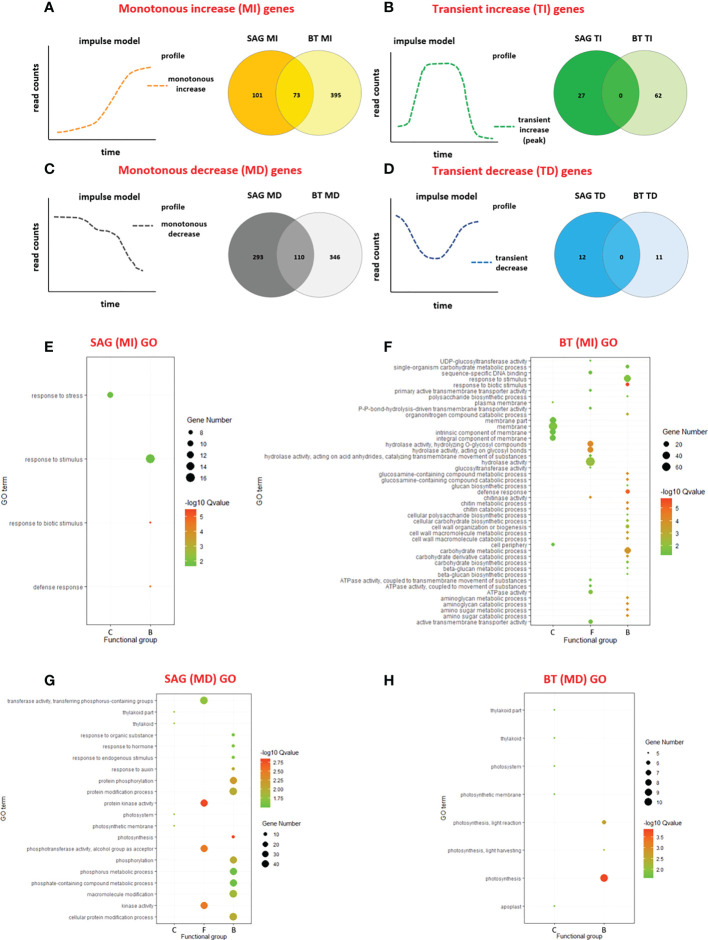
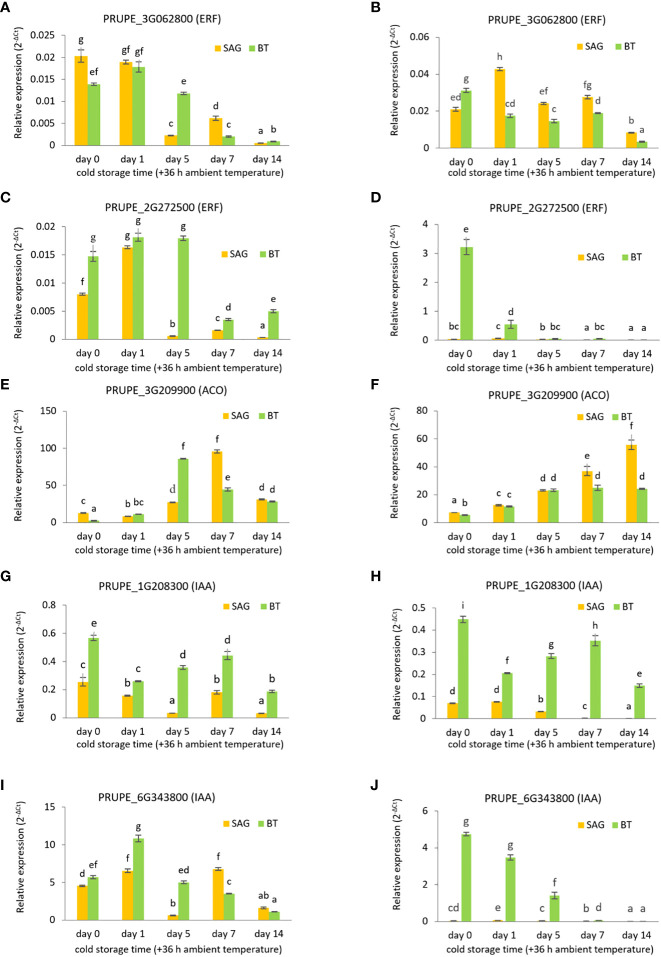
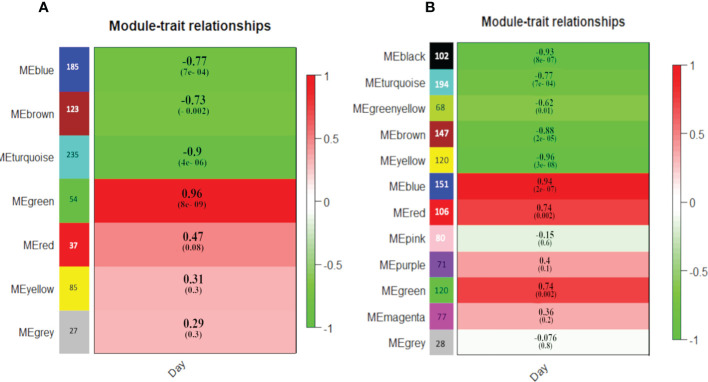
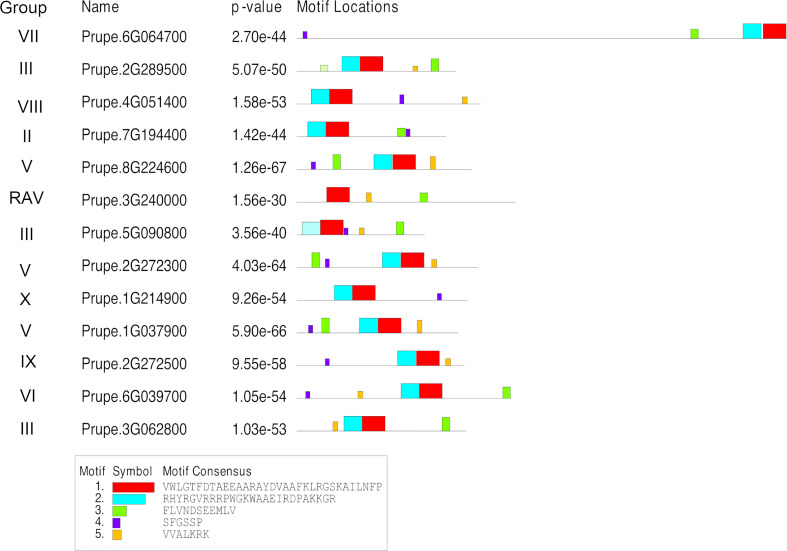
Results: There was a progressive increase in the number of differentially expressed genes between time points (DEGs) in both cultivars. More (1264) time point DEGs were identified in 'Big Top' compared to 'Sagittaria' (746 DEGs). Both cultivars showed a downregulation of pathways related to photosynthesis, and an upregulation of pathways related to amino sugars, nucleotide sugar metabolism and plant hormone signal transduction with ethylene pathways being most affected. Expression patterns of ethylene related genes (including biosynthesis, signaling and ERF transcription factors) correlated with genes involved in cell wall modification, membrane composition, pathogen and stress response, which are all involved later during storage in development of chilling injury.
Discussion: Overall, the results show that common pathways are activated in the fruit of 'Big Top' nectarine and 'Sagittaria' peach in response to cold storage but include also differences that are cultivar-specific responses.
Keywords: ERF transcription factors; Prunus; ethylene; postharvest; transcriptome.
Copyright © 2022 Muto, Bruno, Madeo, Ludlow, Ferrari, Stimpson, LoGiudice, Picardi, Ferrante, Pasti, Müller, Chiappetta, Rogers, Bitonti and Spadafora.
Conflict of interest statement
The authors declare that the research was conducted in the absence of any commercial or financial relationships that could be construed as a potential conflict of interest.
Figures
Similar articles
-
Identification of potential molecular markers for detection of lengthy chilled storage of Prunus persica L. fruit.Heliyon. 2024 Dec 5;10(24):e40992. doi: 10.1016/j.heliyon.2024.e40992. eCollection 2024 Dec 30. Heliyon. 2024. PMID: 39720059 Free PMC article.
-
Transcriptomic profiling during the post-harvest of heat-treated Dixiland Prunus persica fruits: common and distinct response to heat and cold.PLoS One. 2012;7(12):e51052. doi: 10.1371/journal.pone.0051052. Epub 2012 Dec 6. PLoS One. 2012. PMID: 23236430 Free PMC article.
-
Transcriptomic and Metabolic Analyses Reveal the Mechanism of Ethylene Production in Stony Hard Peach Fruit during Cold Storage.Int J Mol Sci. 2021 Oct 20;22(21):11308. doi: 10.3390/ijms222111308. Int J Mol Sci. 2021. PMID: 34768737 Free PMC article.
-
Molecular mechanisms involved in postharvest chilling tolerance of pomegranate fruit.J Sci Food Agric. 2019 Oct;99(13):5617-5623. doi: 10.1002/jsfa.9933. Epub 2019 Aug 12. J Sci Food Agric. 2019. PMID: 31321784 Review.
-
Proteomic and metabolomic studies on chilling injury in peach and nectarine.Front Plant Sci. 2022 Oct 4;13:958312. doi: 10.3389/fpls.2022.958312. eCollection 2022. Front Plant Sci. 2022. PMID: 36267944 Free PMC article. Review.
Cited by
-
Transcriptome Co-Expression Network Analysis of Peach Fruit with Different Sugar Concentrations Reveals Key Regulators in Sugar Metabolism Involved in Cold Tolerance.Foods. 2023 Jun 1;12(11):2244. doi: 10.3390/foods12112244. Foods. 2023. PMID: 37297487 Free PMC article.
-
Biochemical and molecular changes in peach fruit exposed to cold stress conditions.Mol Hortic. 2023 Nov 13;3(1):24. doi: 10.1186/s43897-023-00073-0. Mol Hortic. 2023. PMID: 37953307 Free PMC article. Review.
-
Identification of potential molecular markers for detection of lengthy chilled storage of Prunus persica L. fruit.Heliyon. 2024 Dec 5;10(24):e40992. doi: 10.1016/j.heliyon.2024.e40992. eCollection 2024 Dec 30. Heliyon. 2024. PMID: 39720059 Free PMC article.
References
-
- Aubert C., Bony P., Chalot G., Landry P., Lurol S. (2014). Effects of storage temperature, storage duration, and subsequent ripening on the physicochemical characteristics, volatile compounds, and phytochemicals of western red nectarine (Prunus persica l. batsch). J. Agric. Food Chem. 62, 4707–4724. doi: 10.1021/jf4057555 - DOI - PubMed
LinkOut - more resources
Full Text Sources