. 2023 Feb 14;11(1):e0288422.
doi: 10.1128/spectrum.02884-22. Epub 2022 Dec 12.

Staphylococcus aureus Breast Implant Infection Isolates Display Recalcitrance To Antibiotic Pocket Irrigants

Affiliations

Staphylococcus aureus Breast Implant Infection Isolates Display Recalcitrance To Antibiotic Pocket Irrigants

Jesus M Duran Ramirez et al. Microbiol Spectr. .

Abstract

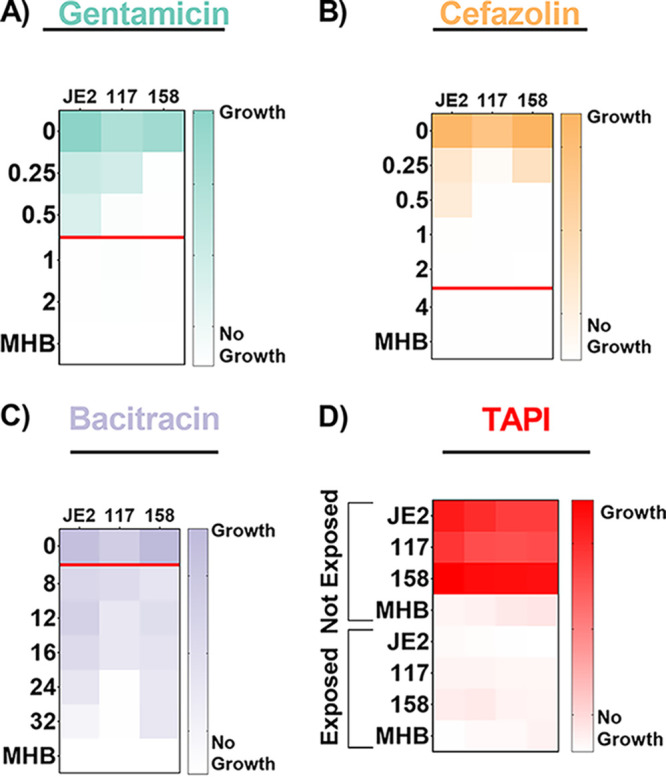
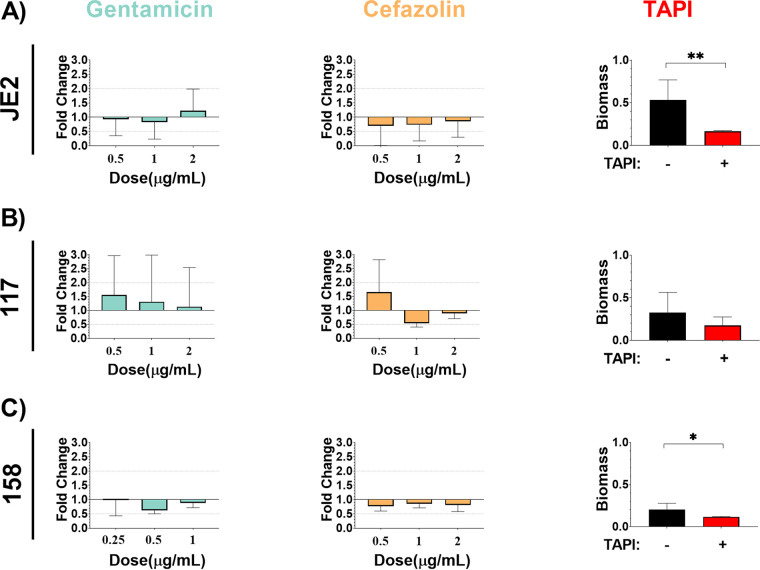
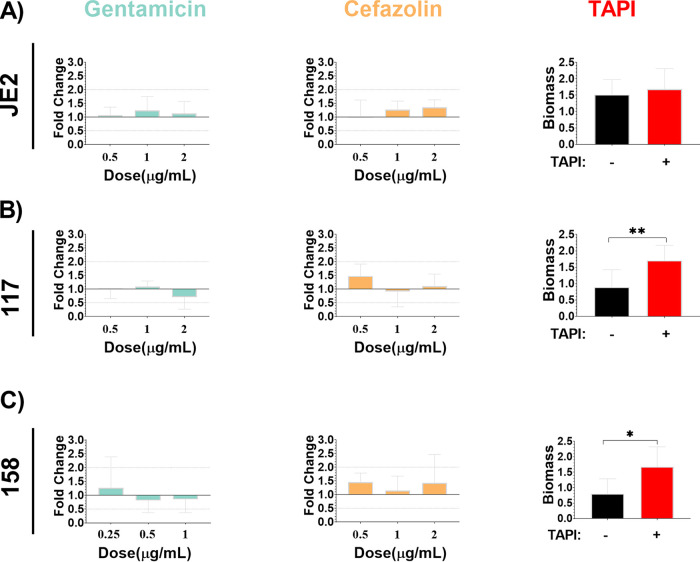
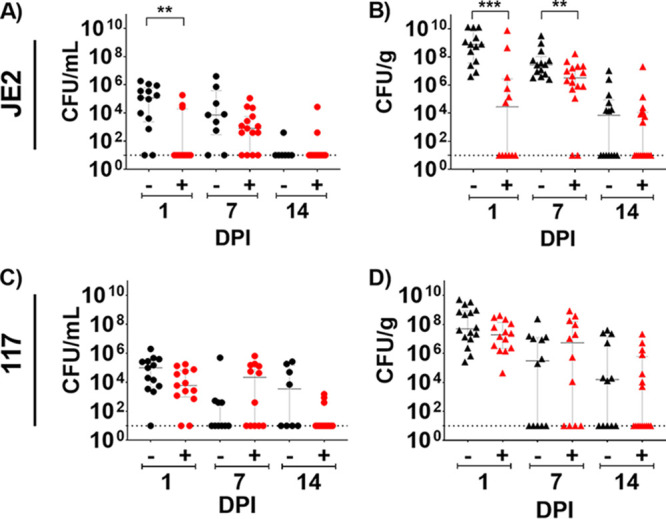
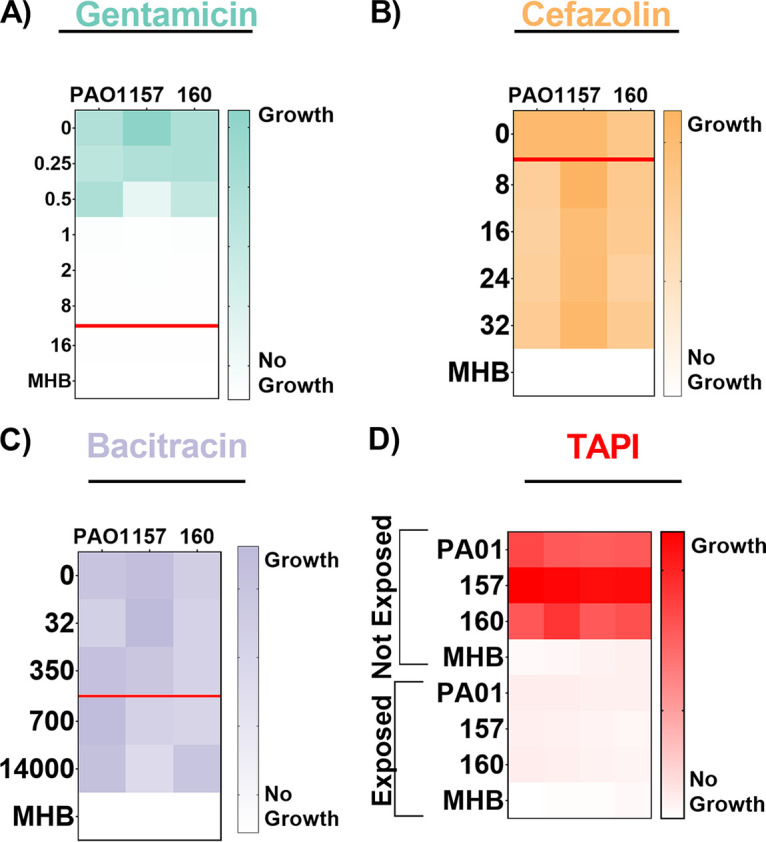
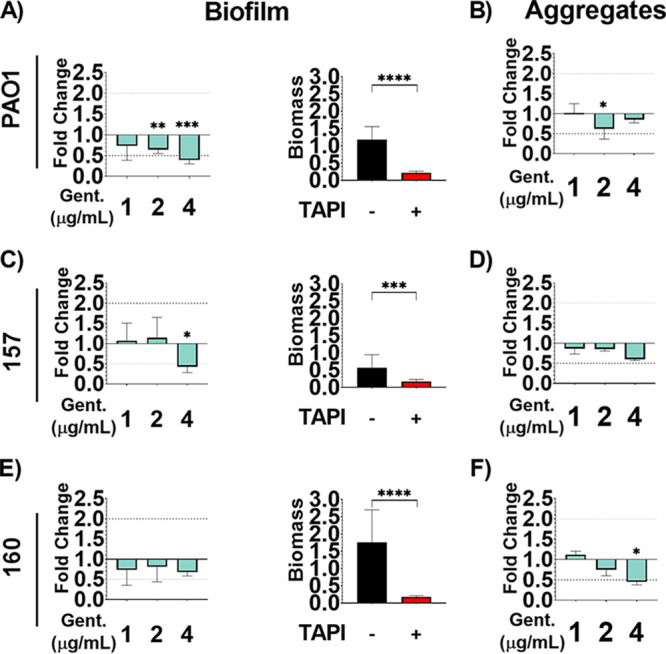
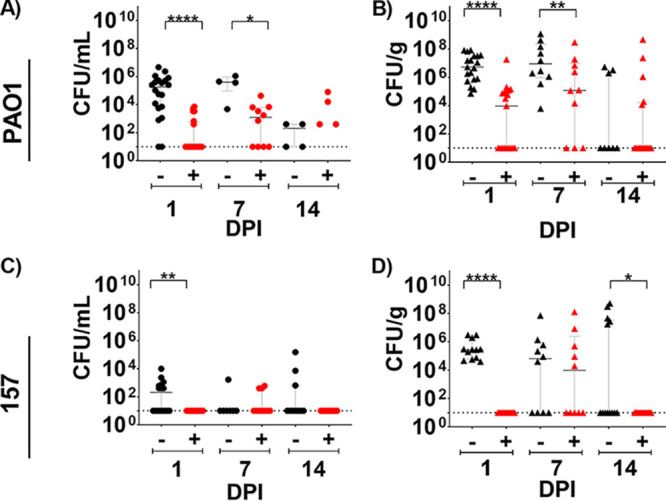
Breast implant-associated infections (BIAIs) are the primary complication following placement of breast prostheses in breast cancer reconstruction. Given the prevalence of breast cancer, reconstructive failure due to infection results in significant patient distress and health care expenditures. Thus, effective BIAI prevention strategies are urgently needed. This study tests the efficacy of one infection prevention strategy: the use of a triple antibiotic pocket irrigant (TAPI) against Staphylococcus aureus, the most common cause of BIAIs. TAPI, which consists of 50,000 U bacitracin, 1 g cefazolin, and 80 mg gentamicin diluted in 500 mL of saline, is used to irrigate the breast implant pocket during surgery. We used in vitro and in vivo assays to test the efficacy of each antibiotic in TAPI, as well as TAPI at the concentration used during surgery. We found that planktonically grown S. aureus BIAI isolates displayed susceptibility to gentamicin, cefazolin, and TAPI. However, TAPI treatment enhanced biofilm formation of BIAI strains. Furthermore, we compared TAPI treatment of a S. aureus reference strain (JE2) to a BIAI isolate (117) in a mouse BIAI model. TAPI significantly reduced infection of JE2 at 1 and 7 days postinfection (dpi). In contrast, BIAI strain 117 displayed high bacterial burdens in tissues and implants, which persisted to 14 dpi despite TAPI treatment. Lastly, we demonstrated that TAPI was effective against Pseudomonas aeruginosa reference (PAO1) and BIAI strains in vitro and in vivo. Together, these data suggest that S. aureus BIAI strains employ unique mechanisms to resist antibiotic prophylaxis treatment and promote chronic infection. IMPORTANCE The incidence of breast implant associated infections (BIAIs) following reconstructive surgery postmastectomy remains high, despite the use of prophylactic antibiotic strategies. Thus, surgeons have begun using additional antibiotic-based prevention strategies, including triple antibiotic pocket irrigants (TAPIs). However, these strategies fail to reduce BIAI rates for these patients. To understand why these therapies fail, we assessed the antimicrobial resistance patterns of Staphylococcus aureus strains, the most common cause of BIAI, to the antibiotics in TAPI (bacitracin, cefazolin, and gentamicin). We found that while clinically relevant BIAI isolates were more susceptible to the individual antibiotics compared to a reference strain, TAPI was effective at killing all the strains in vitro. However, in a mouse model, the BIAI isolates displayed recalcitrance to TAPI, which contrasted with the reference strain, which was susceptible. These data suggest that strains causing BIAI may encode specific recalcitrance mechanisms not present within reference strains.

Keywords: Pseudomonas aeruginosa; Staphylococcus aureus; antibiotic resistance; breast implant infections; triple antibiotic pocket irrigant.


Conflict of interest statement

The authors declare a conflict of interest. Myckatyn receives royalties for product development, funds for an investigator initiated trial associated with acellular dermal matrices in breast reconstruction, and advisory board remuneration from RTI Surgical. He receives an investigator initiated award from Sientra that studies the metabolomics of breast tissue expander infection. None relate directly to the topic matter of this study and no industry funds were received for completing this study. He has no other disclosures. All other authors declare no other conflicts of interest.

Figures

FIG 1
FIG 1
Antibiotic susceptibility patterns of S. aureus strains. (A to C) Strains JE2, 117, and 158 were exposed to increasing concentrations of gentamicin (A), cefazolin (B), or bacitracin (C). (A) JE2 displays resistance to gentamicin, with a minimum inhibitory concentration (MIC) of 1.0 μg/mL, while 117 and 158 are susceptible, as they exhibit MICs of 0.5 and 0.25 μg/mL, respectively. (B) JE2, 117, and 158 are all susceptible to cefazolin, with MICs of 1.0, 0.5, and 0.5 μg/mL, respectively. (C) JE2, 117, and 158 are all resistant to bacitracin, as they exhibit MICs of >32, 24, and >32 μg/mL, respectively. The red line represents the MIC breakpoint for each antibiotic for S. aureus. An MIC value at or above the MIC breakpoint classifies the pathogen as resistant to the antibiotic. (D) Susceptibility of S. aureus strains to triple antibiotic pocket irrigant (TAPI) was determined based on an increase in optical density, indicating growth of strains, when exposed to TAPI compared to those not exposed to TAPI. JE2, 117, and 158 display susceptibility to TAPI. MICs were determined using an optical density at 600 nm (OD600) threshold lower than 0.1, and heat maps display a representative of one of the three replicates. MHB, Mueller-Hinton broth.
FIG 2
FIG 2
S. aureus biofilms formed under in vitro conditions display recalcitrance to TAPI antibiotics. JE2 (A), 117 (B), and 158 (C) were allowed to form biofilm and were then exposed to increasing concentration of antibiotics. (A) JE2 biofilm (mean, 0.4406; standard deviation [SD], 0.2192; standard error of the mean [SE], 0.05315) was not significantly affected following exposure to increasing concentrations of gentamicin (0.5 μg/mL: P value, 0.9404; mean, 0.4083; SD, 0.2528; SE, 0.1460; and 1 μg/mL: P value, 0.5360; mean, 0.3653; SD, 0.2630; SE, 0.1518; and 2 μg/mL: P value, 0.5351; mean, 0.5410; SD, 0.3338; SE, 0.1927) or cefazolin (0.5 μg/mL: P value, 0.2314; mean, 0.3073; SD, 0.3052; SE, 0.1526; and 1 μg/mL: P value, 0.2314; mean, 0.3220; SD, 0.2488; SE, 0.1244; and 2 μg/mL: P value, 0.6869; mean, 0.3770; SD, 0.2464; SE, 0.1232). TAPI, however, significantly reduced the amount of biomass formed by JE2 (P value, 0.0018; mean, 0.1637; SD, 0.0140; SE, 0.003932). (B) 117 biofilm (mean, 0.2885; SD, 0.2274; SE, 0.06857) was not significantly affected following exposure to increasing concentrations of gentamicin (0.5 μg/mL: P value, 0.6608; mean, 0.4570; SD, 0.4167; SE, 0.2083; and 1 μg/mL: P value, 0.9714; mean, 0.3860; SD, 0.4954; SE, 0.2477; and 2 μg/mL: P value, 0.8491; mean, 0.3348; SD, 0.4128; SE, 0.2064), cefazolin (0.5 μg/mL: P value, 0.5549; mean, 0.4863; SD, 0.3433; SE, 0.1982; and 1 μg/mL: P value, 0.3429; mean, 0.1593; SD, 0.04207; SE, 0.02104; and 2 μg/mL: P value, 0.7325; mean, 0.2625; SD, 0.05548; SE, 0.02265) or to TAPI (P value, 0.3773; mean, 0.1746; SD, 0.1001; SE, 0.04477). (C) 158 biofilm (mean, 0.2013; SD, 0.07619; SE, 0.02694) was not significantly affected following exposure to increasing concentrations of gentamicin (0.25 μg/mL: P value, 0.6303; mean, 0.2217; SD, 0.1243; SE, 0.07178; and 0.5 μg/mL: P value, 0.4970; mean, 0.1410; SD, 0.02862; SE, 0.01652; and 1 μg/mL: P value, 0.8518; mean, 0.1987; SD, 0.03819; SE, 0.01559) or cefazolin (0.5 μg/mL: P value, 0.7758; mean, 0.1733; SD, 0.03911; SE, 0.02258; and 1 μg/mL: P value, 0.9507; mean, 0.1922; SD, 0.03274; SE, 0.01337; and 2 μg/mL: P value, 0.9433; mean, 0.1814; SD, 0.05110; SE, 0.02285). However, TAPI significantly reduced the amount of biomass formed by 158 (P value, 0.0485; mean, 0.1170; SD, 0.004761; SD, 0.002380). The Mann-Whitney U test was used to determine statistical significance, where ** indicates P < 0.01, and *** indicates P < 0.0005. P > 0.05 indicates no significant difference. Bar graphs include the means and SDs.
FIG 3
FIG 3
S. aureus biofilms formed under in vitro conditions that mimic the host environment display recalcitrance to TAPI antibiotics. JE2 (A), 117 (B), and 158 (C) were allowed to form biofilm in the presence of human plasma and were then exposed to increasing concentrations of antibiotics. (A) JE2 biofilm (mean, 1.387; SD, 0.8289; SE, 0.2010) was not significantly affected following exposure to increasing concentrations of gentamicin (0.5 μg/mL: P value, 0.6895, mean, 1.473, SD, 0.4182, SE, 0.2414; 1 μg/mL: P value, 0.4158; mean, 1.718; SD, 0.7085; SE, 0.4091; and 2 μg/mL: P value, 0.6895; mean, 1.568; SD, 0.6093; SE, 0.3518), cefazolin (0.5 μg/mL: P value, 0.6977; mean, 1.404; SD, 0.8419; SE, 0.4209; 1 μg/mL: P value, 0.2750; mean, 1.763; SD, 0.4310; SE, 0.2155; and 2 μg/mL: P value, 0.1718; mean, 1.874; SD, 0.3805; SE, 0.1902) or to TAPI (P value, 0.4633; mean, 1.680; SD, 0.63060; SE, 0.2384). (B) 117 biofilm (mean, 0.9390; SD, 0.5298; SE, 0.1529) was not significantly affected following exposure to increasing concentrations of gentamicin (0.5 μg/mL: P value, 0.9527; mean, 0.9323; SD, 0.3203; SE, 0.1601; and 1 μg/mL: P value, 0.5989; mean, 1.027; SD, 0.1928; SE, 0.0963; and 2 μg/mL: P value, 0.5989; mean, 0.6678; SD, 0.4147; SE, 0.2073) or cefazolin (0.5 μg/mL: P value, 0.5549; mean, 1.381; SD, 0.4167; SE, 0.2406; and 1 μg/mL: P value, 0.6835; mean 0.8608; SD, 0.5292; SE, 0.2646; and 2 μg/mL: P value, 0.6820; mean, 1.041; SD, 0.4144; SE, 0.1692) but was significantly increased when exposed to TAPI (P value, 0.0268; mean, 1.702; SD, 0.4690; SE, 0.2098). (C) 158 biofilm (mean, 0.7978; SD, 0.4863; SE, 0.1621) was not significantly affected following exposure to increasing concentrations of gentamicin (0.25 μg/mL: P value, >0.9999; mean, 0.8670; SD, 0.7762; SE, 0.4481; and 0.5 μg/mL: P value, 0.7273; mean, 0.5587; SD, 0.3031; SE, 0.1750; and 1 μg/mL: P value, 0.6070; mean, 0.5858; SD, 0.3300; SE, 0.1347) or cefazolin (0.5 μg/mL: P value, 0.4818; mean, 0.9963; SD, 2.2337; SE, 0.1349; and 1 μg/mL: P value, 0.5827; mean, 0.7883; SD, 0.3636; SE, 0.1484; and 2 μg/mL: P value, 0.6064; mean, 0.9816; SD, 0.7121; SE, 0.3184) but was significantly increased when exposed to TAPI (P value, 0.0336; mean, 1.676; SD, 0.6467; SE, 0.3235). The Mann-Whitney U test was used to determine statistical significance, where ** indicates P < 0.01, and *** indicates P < 0.0005. P > 0.05 indicates no significant difference. Bar graphs include the mean and standard deviation.
FIG 4
FIG 4
Mouse model of S. aureus breast implant-associated infection (BIAI). (A) Implants recovered from saline-treated mice displayed high colony forming units (CFU) of JE2 at 1 day postinfection (dpi) (mean, 3.8 × 10⁵; SD, 5.65 × 10⁵; SE, 1.57 × 10⁵), which persisted at 7 dpi (mean, 5.32 × 10⁵; SD, 1.32 × 10⁶; SE, 4.41 × 10⁵). However, mice were able to control JE2 infection by 14 dpi (mean, 6.57 × 101; SD, 1.47 × 10²; SE, 5.57 × 101). Triple antibiotic pocket irrigant (TAPI) significantly reduced JE2 CFU on implants compared to the saline-treated control mice at 1 dpi (P value, 0.0030; mean, 2.05 × 10⁴; SD, 5.29 × 10⁴; SE, 1.53 × 10⁴). However, by 7 dpi (P value, 0.2049; mean, 1.17 × 10⁴; SD, 2.91 × 10⁴; SE, 7.51 × 10³), there was no difference in CFU recovered from TAPI or saline-treated mice. At 14 dpi (P value, >0.9999; mean, 1.82 × 10³; SD, 6.89 × 10³; SE, 1.78 × 10³), most mice cleared JE2 regardless of treatment. (B) Tissue from saline-treated mice displayed high CFU of JE2 at 1 and 7 dpi (mean, 3.43 × 10⁹; SD, 5.44 × 10⁹; SE, 1.51 × 10⁹; and mean, 3.32 × 10⁸; SD, 8.63 × 10⁸; SE, 2.31 × 10⁸, respectively). However, half the mice were able to control the infection by 14 dpi (mean, 9.50 × 10⁵; SD, 2.83 × 10⁶; SE, 7.56 × 10⁵). TAPI significantly reduced CFU in the tissue compared to the saline-treated mice at 1 and 7 dpi (P value, 0.0002; mean, 6.72 × 10⁸; SD, 2.19 × 10⁹; SE, 6.32 × 10⁸; and P value, 0.0089; mean, 1.86 × 10⁷; SD, 4.10 × 10⁷; SE, 1.03 × 10⁷, respectively). Again, about half the mice cleared the infection with JE2 regardless of treatment by 14 dpi (P value, 0.4409; mean, 1.27 × 10⁶; SD, 5.05 × 10⁸; SE, 1.26 × 10⁶). (C) Implants recovered from saline-treated mice displayed high CFU of 117 at 1 dpi (mean, 2.84 × 10⁵; SD, 5.40 × 10⁵; SE, 1.50 × 10⁵), which persisted at both 7 and 14 dpi (mean, 4.97 × 10⁴; SD, 1.57 × 10⁵; SE, 4.96 × 10⁴; and mean, 6.31 × 10⁴, SD, 1.03 × 10⁵; SE, 3.64 × 10⁴, respectively). There was no significant difference in CFU recovered from implants of TAPI-treated mice at 1 dpi (P value, 0.0640; mean, 3.87 × 10⁴; SD, 5.81 × 10⁴; SE, 1.61 × 10⁴), 7 dpi (P value, 0.2481; mean, 1.01 × 10⁵; SD, 1.85 × 10⁵; SE, 5.34 × 10⁴), and 14 dpi (P value, 0.0557; mean, 1.95 × 10²; SD, 4.37 × 10²; SE, 1.13 × 10²) compared to saline-treated mice. (D) Tissue from saline-treated mice displayed high CFU of 117 at 1 dpi (mean, 8.35 × 10⁷; SD, 1.28 × 10⁸; SE, 3.43 × 10⁷), which persisted at both 7 and 14 dpi (mean, 1.25 × 10⁸; SD, 2.49 × 10⁸; SE, 7.18 × 10⁷; and mean, 1.80 × 10⁶; SD, 5.31 × 10⁶; SE, 1.33 × 10⁶, respectively). There was no difference in CFU recovered from tissues of TAPI-treated mice at 1 dpi (P value, 0.1417; mean, 8.35 × 10⁷; SD, 1.28 × 10⁸; SE, 3.43 × 10⁷), 7 dpi (P value, 0.3638; mean, 1.25 × 10⁸; SD, 2.49 × 10⁸; SE, 7.18 × 10⁷), and 14 dpi (P value, 0.2980; mean, 1.80 × 10⁶; SD, 5.31 × 10⁷; SE, 1.33 × 10⁷) compared to saline-treated mice. Red represents TAPI-treated mice, while black denotes saline-treated mice. Each circle represents the CFU recovered from an implant of each mouse. Each triangle denotes the CFU retrieved from tissue near the implant of each mouse. The Mann-Whitney U test was used to determine statistical significance, where ** indicates P < 0.01, and *** indicates P < 0.0005. P > 0.05 indicates no significant differences. Bar graphs represent the median and the interquartile range.
FIG 5
FIG 5
Antibiotic susceptibility patterns of P. aeruginosa strains. PAO1, 157, and 160 strains were exposed to increasing concentrations of gentamicin (A), cefazolin (B), or (C) bacitracin. (A) PAO1, 157, and 160 all displayed minimum inhibitory concentrations (MICs) of 1 μg/mL, indicating that they are susceptible to gentamicin. (B) PAO1, 157, and 160 all displayed MICs of >32 μg/mL, indicating that they are all resistant to cefazolin. (C) PAO1, 157, and 160 all displayed MICs of >1,400 μg/mL, indicating that they are all resistant to bacitracin. The red line represents the MIC breakpoint for each antibiotic for P. aeruginosa. A MIC value at or above the MIC breakpoint classifies the pathogen as resistant to the antibiotic. (D) Susceptibility of P. aeruginosa strains to triple antibiotic pocket irrigant (TAPI) was determined based on an increase in optical density, indicating growth of strains, when exposed to TAPI compared to those not exposed. PAO1, 157, and 160 are susceptible to TAPI. The MICs were determined using an OD600 threshold lower than 0.1, and the heat maps display a representative of one of the three replicates.
FIG 6
FIG 6
Communities formed by P. aeruginosa are susceptible to the triple antibiotic irrigant (TAPI) antibiotics. P. aeruginosa strains were allowed to form biofilms and aggregates and were then exposed to increasing concentrations of gentamicin, the antibiotic at which the planktonic bacteria were susceptible. (A) 2 and 4 μg/mL (twice and four times the minimum inhibitory concentration [MIC], respectively) of gentamicin (P value, 0.0082; mean, 0.7618; SD, 0.1118; SE, 0.04563; and P value, 0.0002; mean, 0.4638; SD, 0.1091; SE, 0.04452, respectively) significantly reduced the biomass of PAO1 biofilms (mean, 1.186; SD, 0.3695; SE, 0.09874), while the 1 μg/mL (MIC) concentration (P value, 0.0672; mean, 0.8623; SD, 0.33811, SE, 0.1348) did not cause a significant change. TAPI also significantly reduced PAO1 biofilm (P value, <0.0001; mean, 0.2180; SD, 0.04770; SE, 0.01803). (B) 2 μg/mL (twice the MIC) of gentamicin (P value, 0.0500; mean, 1.745; SD, 0.7246; SE, 0.4184) significantly reduced PAO1 aggregate biomass (mean, 2.804; SD, 0.7165; SE, 0.4137), while the 1 μg/mL (MIC) concentration (P value, 0.5000; mean, 2.848; SD, 0.6535; SE, 0.3773) and the 4 μg/mL (twice the MIC) concentration (P value, 0.2000; mean, 2.393; SD, 0.2317; SE, 0.1338) did not. (C) 4 μg/mL (four times the MIC) of gentamicin (P value, 0.0117; mean, 0.2412; SD, 0.08226; SE, 0.03358) significantly reduced the biomass of the biofilm form by the BIAI strain 157 (mean, 0.5656; SD, 0.3793; SE, 0.1014), while 1 μg/mL (MIC) and 2 μg/mL (twice the MIC) did not cause a significant change in biomass (P value, 0.4020; mean, 0.6021; SD, 0.2303; SE, 0.08144; and P value, 0.4334; mean, 0.6453; SD, 0.2885; SE, 0.1178, respectively). TAPI also significantly reduced the biofilm biomass (P value, 0.0006; mean, 0.1757; SD, 0.05315; SE, 0.02170). (D) No concentration of gentamicin (1 μg/mL [MIC]: P value, 0.5000; mean, 1.696; SD, 0.2623; SE, 0.1514; and 2 μg/mL [twice the MIC]: P value, 0.2000; mean, 1.677; SD, 0.09586; SE, 0.05535; and 4 μg/mL [four times the MIC]: P value, 0.1000; mean, 1.181; SD, 0.06364; SE, 0.04500) tested affected the biomass of aggregates formed by the BIAI strain 157 (mean, 1.965; SD, 0.4182; SE, 0.2415). (E) No concentration of gentamicin (1 μg/mL: P value, 0.3650; mean, 1.286; SD, 0.6711; SE, 0.2373; and 2 μg/mL: P value, 0.6590; mean, 1.414; SD, 0.6464; SE, 0.2639; and 4 μg/mL: P value, 0.4940; mean, 1.95; SD, 0.1758; SE, 0.07176) tested affected the biofilm formed by the BIAI strain 160 (mean, 1.753; SD, 0.9438; SE, 0.2522). However, TAPI significantly reduced the biofilm biomass (P value < 0.0001; mean, 0.1828; SD, 0.03024; SE, 0.1234). (F) 4 μg/mL (four times the MIC) of gentamicin (4 μg/mL: P value, 0.0500; mean, 1.912; SD, 0.3149; SE, 0.1818) significantly reduced the biomass of the aggregates formed by the BIAI strain 160 (mean, 4.241; SD, 1.225; SE, 1.7073), while 1 μg/mL (MIC) (P value, 0.4000; mean, 4.735; SD, 0.3771; SE, 0.217) and 2 μg/mL (twice the MIC) (P value, 0.2000; mean, 3.184; SD, 0.6403; SE, 0.3697) did not. The Mann-Whitney U test was used to determine statistical significance, where ** indicates P < 0.01, and *** indicates P < 0.0005. P > 0.05 indicates no significant differences. The bar graphs include the means and SD.
FIG 7
FIG 7
P. aeruginosa mouse breast implant-associated infection (BIAI) model. (A) Implants recovered from saline-treated, control mice displayed high colony forming units (CFU) of PAO1 at 1 day postinfection (dpi) (mean 5.69 × 10⁵; SD 1.11 × 10⁶; SE 2.47 × 10⁵), which persisted at 7 dpi (mean, 4.78 × 10⁵; SD, 4.56 × 10⁵; SE, 2.28 × 10⁵). However, mice were able to eliminate PAO1 by 14 dpi (mean, 2.05 × 10²; SD, 2.25 × 10²; SE, 1.13 × 10²). TAPI significantly reduced CFU on implants compared to control mice at 1 and 7 dpi (P value, <0.0001; mean, 1.03 × 10³; SD, 2.09 × 10³; SE, 4.67 × 10²; and P value, 0.0120; mean, 6.16 × 10³; SD, 1.30 × 10⁴; SE, 4.11 × 10³, respectively). At 14 dpi, most mice eliminated PAO1 regardless of treatment (P value, 0.1504; mean, 7.45 × 10³; SD, 2.22 × 10⁴; SE, 6.17 × 10³). (B) Tissue from control mice displayed high CFU of PAO1 at 1 dpi (mean, 2.05 × 10⁷; SD, 2.79 × 10⁷; SE, 6.39 × 10⁵), which persisted at 7 dpi (mean, 1.79 × 10⁸; SD, 3.68 × 10⁸; SE, 1.16 × 10⁸). At 14 dpi, most mice eliminated PAO1 from the tissue (mean, 1.32 × 10⁶; SD, 2.03 × 10⁶; SE, 7.18 × 10⁵). TAPI significantly reduced PAO1 CFU in the tissue compared to control mice at 1 dpi (P value, <0.0001; mean, 1.00 × 10⁶; SD, 4.17 × 10⁶; SE, 9.56 × 10⁵). However, at 7 dpi, similar CFU were recovered from the tissue of TAPI-treated compared to control mice (P value, 0.0748; mean, 3.19 × 10⁷; SD, 9.12 × 10⁷; SE, 2.88 × 10⁷). At 14 dpi, most TAPI-treated mice eliminated PAO1 from the tissue, which was similar to control mice (P value, 0.7327; mean, 3.03 × 10⁷; SD, 1.15 × 10⁸; SE, 2.87 × 10⁷). (C) CFU of BIAI strain 157 could be detected on implants recovered from control mice at 1 dpi (mean, 1.00 × 10³; SD, 2.48 × 10³; SE, 6.19 × 10²). However, at 7 and 14 dpi, most control mice eliminated 157 from the implants (mean, 2.49 × 10²; SD, 6.31 × 10²; SE, 2.39 × 10²; and mean, 1.45 × 10⁴; SD, 4.56 × 10⁴; SE, 1.38 × 10⁴, respectively). TAPI significantly reduced the 157 CFU compared to control mice, as no bacteria were recovered from implants of TAPI-treated mice at 1 and 14 dpi (P value, 0.0057; mean, 10; SD, 0; SE, 0; and P value, 0.0159; mean, 10; SD, 0; SE, 0, respectively), while only a few TAPI-treated mice had detectable CFU on implants at 7 dpi (P value, 0.6691; mean, 1.47 × 10²; SD, 2.27 × 10²l SE, 7.19 × 101). (D) Tissue from control mice displayed high CFU of BIAI strain 157 at 1 and 7 dpi (mean, 8.12 × 10⁵; SD, 1.19 × 10⁶; SE, 3.42 × 10⁵ and mean, 7.39 × 10⁶; SD, 2.26 × 10⁷; SE, 7.14 × 10⁶, respectively). However, more than half of the control mice had no detectable 157 CFU at 14 dpi (mean, 6.82 × 10⁷; SD, 1.54 × 10⁸; SE, 4.12 × 10⁷). TAPI significantly reduced CFU in the tissue compared to the control mice at 1 and 14 dpi (P value, <0.0001; mean, 1.00E1; SD 0; SE 0; and P value, 0.0159; mean, 1.00E1; SD, 0; SE, 0, respectively). While there was no difference in CFU between TAPI and control mice at 7 dpi, few mice had detectable CFU of 157 in the tissue (P value, 0.7863; mean, 1.39 × 10⁷; SD, 4.09 × 10⁷, SE, 1.29 × 10⁷). Red represents TAPI-treated mice, while black denotes control mice. Each circle represents the CFU recovered from an implant of each mouse. Each triangle denotes the CFU retrieved from tissue near the implant of each mouse. The Mann-Whitney U test was used to determine statistical significance, where ** indicates P < 0.01, and *** indicates P < 0.0005. P > 0.05 indicates no significant difference. Graphs represent the median and the interquartile range.

Similar articles

Cited by

References

    1. Darouiche RO. 2001. Device-associated infections: a macroproblem that starts with microadherence. Clin Infect Dis 33:1567–1572. doi:10.1086/323130. - DOI - PubMed
    1. Barr SP, Topps AR, Barnes NL, Henderson J, Hignett S, Teasdale RL, McKenna A, Harvey JR, Kirwan CC, Northwest Breast Surgical Research Collaborative . 2016. Infection prevention in breast implant surgery—a review of the surgical evidence, guidelines and a checklist. Eur J Surg Oncol 42:591–603. doi:10.1016/j.ejso.2016.02.240. - DOI - PubMed
    1. Olsen MA, Nickel KB, Fox IK, Margenthaler JA, Ball KE, Mines D, Wallace AE, Fraser VJ. 2015. Incidence of surgical site infection following mastectomy with and without immediate reconstruction using private insurer claims data. Infect Control Hosp Epidemiol 36:907–914. doi:10.1017/ice.2015.108. - DOI - PMC - PubMed
    1. Brindle CT, Porter S, Bijlani K, Arumugam S, Matias R, Najafi R, Fisher J. 2018. Preliminary results of the use of a stabilized hypochlorous acid solution in the management of Ralstonia pickettii biofilm on silicone breast implants. Aesthet Surg J 38:S52–S61. doi:10.1093/asj/sjx229. - DOI - PubMed
    1. Cohen JB, Carroll C, Tenenbaum MM, Myckatyn TM. 2015. Breast implant-associated infections: the role of the national surgical quality improvement program and the local microbiome. Plast Reconstr Surg 136:921–929. doi:10.1097/PRS.0000000000001682. - DOI - PubMed

Publication types

MeSH terms