

Diverse Methylmercury (MeHg) Producers and Degraders Inhabit Acid Mine Drainage Sediments, but Few Taxa Correlate with MeHg Accumulation
- PMID: 36507660
- PMCID: PMC9948709
- DOI: 10.1128/msystems.00736-22
Diverse Methylmercury (MeHg) Producers and Degraders Inhabit Acid Mine Drainage Sediments, but Few Taxa Correlate with MeHg Accumulation
Abstract
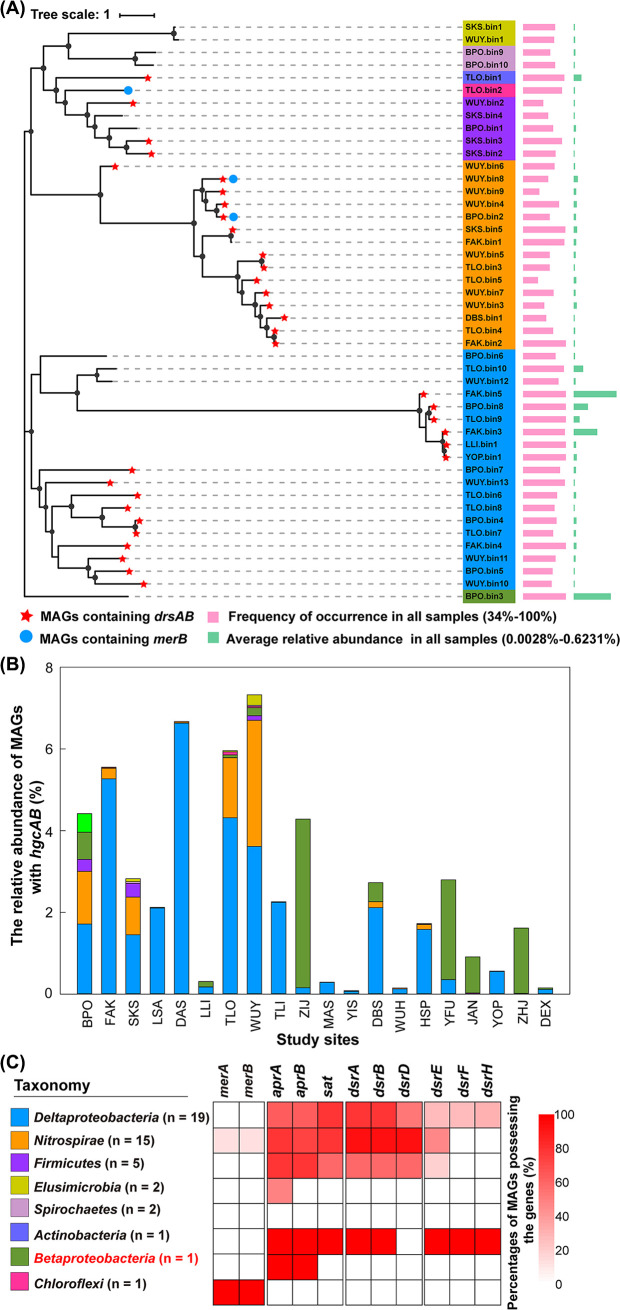
Methylmercury (MeHg) is a notorious neurotoxin, and its production and degradation in the environment are mainly driven by microorganisms. A variety of microbial MeHg producers carrying the gene pair hgcAB and degraders carrying the merB gene have been separately reported in recent studies. However, surprisingly little attention has been paid to the simultaneous investigation of the diversities of microbial MeHg producers and degraders in a given habitat, and no studies have been performed to explore to what extent these two contrasting microbial groups correlate with MeHg accumulation in the habitat of interest. Here, we collected 86 acid mine drainage (AMD) sediments from an area spanning approximately 500,000 km2 in southern China and profiled the sediment-borne putative MeHg producers and degraders using genome-resolved metagenomics. 46 metagenome-assembled genomes (MAGs) containing hgcAB and 93 MAGs containing merB were obtained, including those from various taxa without previously known MeHg-metabolizing microorganisms. These diverse MeHg-metabolizing MAGs were formed largely via multiple independent horizontal gene transfer (HGT) events. The putative MeHg producers from Deltaproteobacteria and Firmicutes as well as MeHg degraders from Acidithiobacillia were closely correlated with MeHg accumulation in the sediments. Furthermore, these three taxa, in combination with two abiotic factors, explained over 60% of the variance in MeHg accumulation. Most of the members of these taxa were characterized by their metabolic potential for nitrogen fixation and copper tolerance. Overall, these findings improve our understanding of the ecology of MeHg-metabolizing microorganisms and likely have implications for the development of management strategies for the reduction of MeHg accumulation in the AMD sediments. IMPORTANCE Microorganisms are the main drivers of MeHg production and degradation in the environment. However, little attention has been paid to the simultaneous investigation of the diversities of microbial MeHg producers and degraders in a given habitat. We used genome-resolved metagenomics to reveal the vast phylogenetic and metabolic diversities of putative MeHg producers and degraders in AMD sediments. Our results show that the diversity of MeHg-metabolizing microorganisms (particularly MeHg degraders) in AMD sediments is much higher than was previously recognized. Via multiple linear regression analysis, we identified both microbial and abiotic factors affecting MeHg accumulation in AMD sediments. Despite their great diversity, only a few taxa of MeHg-metabolizing microorganisms were closely correlated with MeHg accumulation. This work underscores the importance of using genome-resolved metagenomics to survey MeHg-metabolizing microorganisms and provides a framework for the illumination of the microbial basis of MeHg accumulation via the characterization of physicochemical properties, MeHg-metabolizing microorganisms, and the correlations between them.
Keywords: acid mine drainage (AMD); demethylator; metagenome; methylator; methylmercury; sediment.
Conflict of interest statement
The authors declare no conflict of interest.
Figures


Similar articles
-
Expanded Phylogenetic Diversity and Metabolic Flexibility of Mercury-Methylating Microorganisms.mSystems. 2020 Aug 18;5(4):e00299-20. doi: 10.1128/mSystems.00299-20. mSystems. 2020. PMID: 32817383 Free PMC article.
-
Carbon Amendments Alter Microbial Community Structure and Net Mercury Methylation Potential in Sediments.Appl Environ Microbiol. 2018 Jan 17;84(3):e01049-17. doi: 10.1128/AEM.01049-17. Print 2018 Feb 1. Appl Environ Microbiol. 2018. PMID: 29150503 Free PMC article.
-
Potential for mercury methylation by Asgard archaea in mangrove sediments.ISME J. 2023 Mar;17(3):478-485. doi: 10.1038/s41396-023-01360-w. Epub 2023 Jan 13. ISME J. 2023. PMID: 36639538 Free PMC article.
-
A review on mercury biogeochemistry in mangrove sediments: Hotspots of methylmercury production?Sci Total Environ. 2019 Aug 25;680:140-150. doi: 10.1016/j.scitotenv.2019.04.451. Epub 2019 May 8. Sci Total Environ. 2019. PMID: 31112813 Review.
-
Biogeochemical controls on methylmercury in soils and sediments: Implications for site management.Integr Environ Assess Manag. 2017 Mar;13(2):249-263. doi: 10.1002/ieam.1822. Epub 2016 Sep 3. Integr Environ Assess Manag. 2017. PMID: 27427265 Review.
Cited by
-
Mining-impacted rice paddies select for Archaeal methylators and reveal a putative (Archaeal) regulator of mercury methylation.ISME Commun. 2023 Jul 15;3(1):74. doi: 10.1038/s43705-023-00277-x. ISME Commun. 2023. PMID: 37454192 Free PMC article.
-
Microbial potential to mitigate neurotoxic methylmercury accumulation in farmlands and rice.Nat Commun. 2025 Jun 2;16(1):5102. doi: 10.1038/s41467-025-60458-1. Nat Commun. 2025. PMID: 40456770 Free PMC article.
-
Glutathione reductase plays a role in the metabolism of methylmercury degradation in Rhodotorula mucilaginosa.Microbiol Spectr. 2025 Feb 4;13(2):e0239524. doi: 10.1128/spectrum.02395-24. Epub 2025 Jan 16. Microbiol Spectr. 2025. PMID: 39817752 Free PMC article.
-
Effect of acute exposure of Hg on physiological parameters and transcriptome expression in silkworms (Bombyx mori).Front Vet Sci. 2024 Jun 11;11:1405541. doi: 10.3389/fvets.2024.1405541. eCollection 2024. Front Vet Sci. 2024. PMID: 38919158 Free PMC article.
References
-
- Rytuba JJ. 2003. Mercury from mineral deposits and potential environmental impact. Env Geol 43:326–338. doi:10.1007/s00254-002-0629-5. - DOI
-
- Li Y, Cai Y. 2013. Progress in the study of mercury methylation and demethylation in aquatic environments. Chin Sci Bull 58:177–185. doi:10.1007/s11434-012-5416-4. - DOI
Publication types
MeSH terms
Substances
Associated data
LinkOut - more resources
Full Text Sources
