. 2023 Feb 14;11(1):e0241622.
doi: 10.1128/spectrum.02416-22. Epub 2022 Dec 12.

Effects of Silage Diet on Meat Quality through Shaping Gut Microbiota in Finishing Pigs

Affiliations

Effects of Silage Diet on Meat Quality through Shaping Gut Microbiota in Finishing Pigs

Jiakuan Niu et al. Microbiol Spectr. .

Abstract

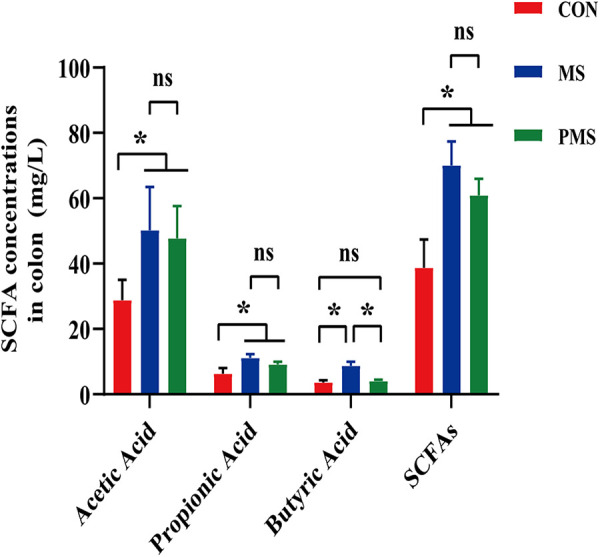
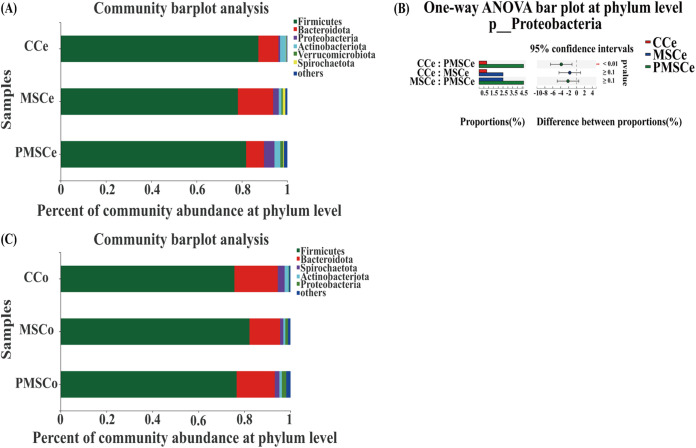
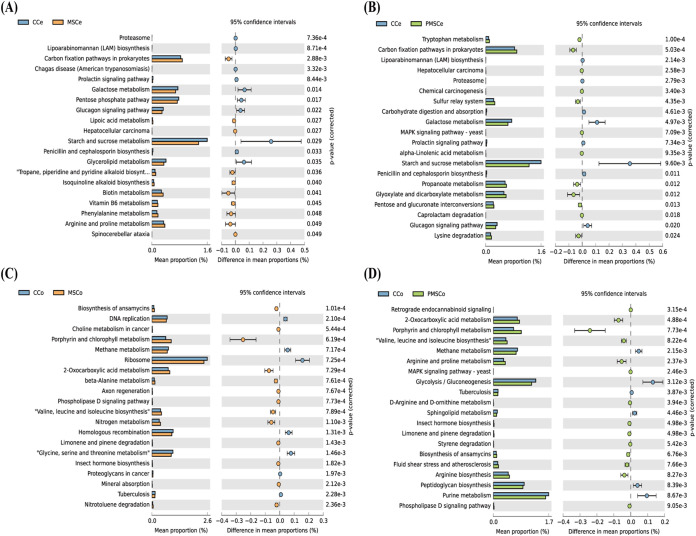
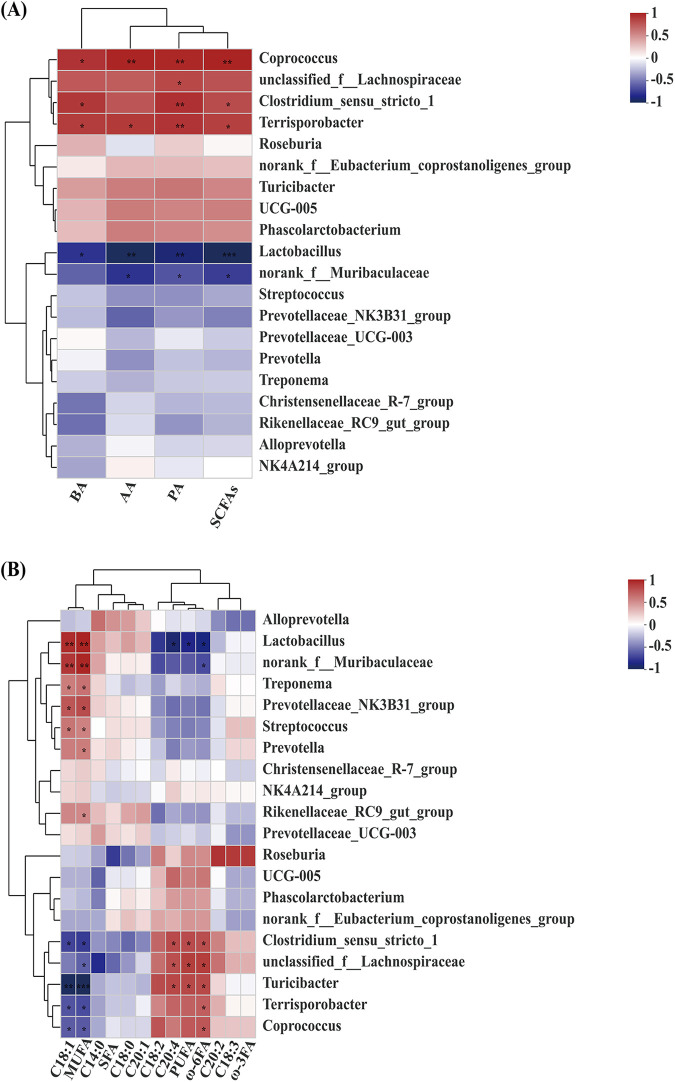
With increasing demand for high-quality pork, development of green and healthy feed for finishing pigs is urgently needed. In this study, the effects and mechanisms of mulberry and paper mulberry silages on growth performance, meat quality, and intestinal health of finishing pigs were explored. Intestinal microbiota were profiled, and microbially produced short-chain fatty acids (SCFAs) were measured. The average daily gain (ADG) and feed conversion rate (FCR) with mulberry and paper mulberry silages were not significantly different from those of the control. Meat quality as measured by pork marbling and fatty acids in the longissimus dorsi was better with mulberry silage. The highest concentration of SCFAs was also with mulberry silage. According to 16S rRNA sequencing, Clostridium_sensu_stricto_1, Terrisporobacter, and Lachnospiraceae, which are important in SCFA production, were biomarkers of mulberry silage. PICRUSt functional analysis of intestinal microbes indicated that galactose metabolism, starch and sucrose metabolism, and carbohydrate digestion and absorption decreased significantly in silage treatments but increased in the control. Correlations between intestinal microbes and SCFAs and fatty acids indicated Clostridium_sensu_stricto_1, Terrisporobacter, and Lachnospiraceae were closely associated with SCFA and fatty acid contents. The results indicated that mulberry silage could increase SCFA content through shaping intestinal microbes to affect the deposition of fatty acids, which laid a solid theoretical foundation for improving pork quality. IMPORTANCE To avoid competition between people and animals for food, it is essential to develop nontraditional feeds. In this study, the effects of the silages of the unconventional feed resources mulberry and paper mulberry on meat quality of finishing pigs were examined. With mulberry silage in the diet, meat quality improved as indicated by meat color, marbling score, and beneficial fatty acids in the longissimus dorsi muscle. Pigs fed mulberry silage had the highest concentrations of short-chain fatty acids (SCFAs), and 16S rRNA sequencing identified Clostridium_sensu_stricto_1, Terrisporobacter, and Lachnospiraceae as biomarkers, which are important in SCFA production. Functions of intestinal microbes in the two silage groups primarily involved amino acid metabolism and SCFA production. Correlations between intestinal microbes and SCFAs and fatty acids indicated that Clostridium_sensu_stricto-1, Terrisporobacter, and Lachnospiraceae were closely associated with SCFA contents in the intestine and fatty acids in the longissimus dorsi.

Keywords: SCFAs; finishing pigs; gut microbiota; meat quality; mulberry silage; paper mulberry silage.


Conflict of interest statement

The authors declare no conflict of interest.

Figures

FIG 1
FIG 1
Effects of mulberry and paper mulberry silages on meat quality and fatty acids in the longissimus dorsi muscle of finishing pigs. (A) Marbling score of pork; (B to E) content of fatty acids in longissimus dorsi muscle. CON, control; MS, mulberry silage; PMS, paper mulberry silage. One sample was randomly selected from each replicate in the same treatment (i.e., 4 samples per treatment [n = 4]). The data were evaluated by one-way ANOVA, and the difference between the average values was evaluated by Duncan’s test (*, P < 0.05; **, P < 0.01; ns, nonsignificant difference). The error bars show the standard deviation (SD).
FIG 2
FIG 2
Concentration of short-chain fatty acids in the colon of finishing pigs. CON, control; MS, mulberry silage; PMS, paper mulberry silage. One sample was randomly selected from each replicate in the same treatment (i.e., 4 samples per treatment [n = 4]). The data were evaluated by one-way ANOVA, and the difference between the average values was evaluated by Duncan’s test (*, P < 0.05; **, P < 0.01; ns, nonsignificant difference). The error bars show the SD.
FIG 3
FIG 3
Composition of and differences in intestinal microbes at the phylum level. (A) Microbial composition of the cecum at the phylum level; (B) differential expression of microbes in different groups; (C) microbial composition of the colon at the phylum level. The data are means ± SD. *, 0.01 < P < 0.05; **, P < 0.01. CCe, cecum of the control; MSCe, cecum of the mulberry silage group; PMSCe, cecum of the paper mulberry silage group; CCo, colon of the control; MSCo, colon of the mulberry silage group; PMSCo, colon of the paper mulberry silage group. One sample was randomly selected from each replicate in same treatment (i.e., 4 samples in cecum and 4 samples in colon per treatment [n = 4]).
FIG 4
FIG 4
Screening of microbial biomarkers of the cecum at the genus level. (A) Differential analysis of cecum microbes at the genus level; (B and C) differential volcano map (x-axis coordinate, log2 fold change [FC]; y-axis coordinate, adjusted P value). Each point in the graph represents an operational taxonomic unit (OTU), and the two lines parallel to the y axis represent FC = 2 and FC = −2. The dotted line parallel to the x axis represents −log10 (0.05), and the points above the dotted line represent OTUs with significance at P < 0.05. For each OTU, when P is <0.05 and at an FC of ≥2, the OTU has an intergroup difference. (D and F) Linear discriminant analysis (LDA) effect size (LEfSe) analysis representing differentially abundant taxa in the cecum (CCe and MSCe and CCe and PMSCe); (E and G) LDA cladogram (CCe and MSCe and CCe and PMSCe); (H and I) differential expression of intestinal microbes: (H) Lactobacillus and (I) Christensenellaceae_R-7_group. Values are the mean ± SD. *, 0.01 < P < 0.05; **, P < 0.01. CCe, cecum of the control; MSCe, cecum of the mulberry silage group; PMSCe, cecum of the paper mulberry silage group. There were 4 samples in cecum per treatment (n = 4).
FIG 5
FIG 5
Screening of microbial biomarkers of the colon at the genus level. (A) Differential analysis of colon microbes at the genus level; (B and C) differential volcano map (x-axis coordinate, log2 fold change [FC]; y-axis coordinate, adjusted P value). Each point in the graph represents an operational taxonomic unit (OTU), and the two lines parallel to the y axis represent FC = 2 and FC = −2. The dotted line parallel to the x axis represents −log10 (0.05), and the points above the dotted line represent OTUs with significance at P < 0.05. For each OTU, when P is <0.05 and at an FC of ≥2, the OTU has an intergroup difference. (D and F) Linear discriminant analysis (LDA) effect size (LEfSe) analysis representing differentially abundant taxa in the colon (CCo and MSCo and CCo and PMSCo); (E and G) LDA cladogram (CCo and MSCo and CCo and PMSCo); (H to M) differential expression of intestinal microbes: (H) Clostridium_sensu_stricto_1, (I) Terrisporobacter, (J) Lactobacillus, (K) Lachnospiraceae, (L) Phascolarctobacterium, and (M) Rikenellaceae_RC9_gut group. Values are means ± SD. *, 0.01 < P < 0.05; **, P < 0.01. CCo, colon of the control; MSCo, colon of the mulberry silage group; PMSCo, colon of the paper mulberry silage group. There were 4 samples in colon per treatment (n = 4).
FIG 6
FIG 6
Prediction of metabolic pathways regulated by intestinal microbes. (A) Top 20 metabolic pathways with the most significant differences between CCe and MSCe; (B) top 20 metabolic pathways with the most significant differences between CCe and PMSCe; (C) top 20 metabolic pathways with the most significant differences between CCo and MSCo; (D) top 20 metabolic pathways with the most significant differences between CCo and PMSCo. CCe, cecum of the control; MSCe, cecum of the mulberry silage group; PMSCe, cecum of the paper mulberry silage group; CCo, colon of the control; MSCo, colon of the mulberry silage group; PMSCo, colon of the paper mulberry silage group.
FIG 7
FIG 7
Correlation analysis of intestinal microbes with short-chain fatty acids and longissimus dorsi muscle fatty acids. (A) Correlation analysis of intestinal microbes with short-chain fatty acids; (B) correlation analysis of intestinal microbes with longissimus dorsi muscle fatty acids. The x axis presents environmental factors, and correlation coefficients (r) and P values were obtained by calculation. Coefficients are displayed in different colors as indicated by the legend on the right, with red representing a positive correlation and blue representing a negative correlation. P values were adjusted by FDR using the Benjamini-Hochberg method (FDR < 0.05). *, 0.01 < P < 0.05; **, P < 0.01; ***, P < 0.001.

References

    1. Scollan ND, Price EM, Morgan SA, Huws SA, Shingfield KJ. 2017. Can we improve the nutritional quality of meat? Proc Nutr Soc 76:603–618. doi: 10.1017/S0029665117001112. - DOI - PubMed
    1. Yanfang Y, Hongyan L, Bing Z, Junwen W, Xuping S, Jinzhi H, Jianyuan Y, Yanfei Z, Zeyuan D. 2018. Nutritional and functional components of mulberry leaves from different varieties: evaluation of their potential as food materials. Int J Food Prop 21:1495–1507. doi: 10.1080/10942912.2018.1489833. - DOI
    1. Srivastava S, Kapoor R, Thathola A, Srivastava RP. 2006. Nutritional quality of leaves of some genotypes of mulberry (Morus alba). Int J Food Sci Nutr 57:305–313. doi: 10.1080/09637480600801837. - DOI - PubMed
    1. Al-Kirshi R, Alimon AR, Zulkifli I, Sazili A, Zahari MW, Ivan M. 2010. Utilization of mulberry leaf meal (Morus alba) as protein supplement in diets for laying hens. Ital J Anim Sci 9:50–66.
    1. Lin WC, Lee MT, Chang SC, Chang YL, Shih CH, Yu B, Lee TT. 2017. Effects of mulberry leaves on production performance and the potential modulation of antioxidative status in laying hens. Poult Sci 96:1191–1203. doi: 10.3382/ps/pew350. - DOI - PubMed

Publication types

LinkOut - more resources