. 2022 Dec 5;194(47):E1599-E1609.
doi: 10.1503/cmaj.221335.

Serial cross-sectional estimation of vaccine-and infection-induced SARS-CoV-2 seroprevalence in British Columbia, Canada

Affiliations

Serial cross-sectional estimation of vaccine-and infection-induced SARS-CoV-2 seroprevalence in British Columbia, Canada

Danuta M Skowronski et al. CMAJ. .

Abstract

Background: The evolving proportion of the population considered immunologically naive versus primed for more efficient immune memory response to SARS-CoV-2 has implications for risk assessment. We sought to chronicle vaccine- and infection-induced seroprevalence across the first 7 waves of the COVID-19 pandemic in British Columbia, Canada.

Methods: During 8 cross-sectional serosurveys conducted between March 2020 and August 2022, we obtained anonymized residual sera from children and adults who attended an outpatient laboratory network in the Lower Mainland (Greater Vancouver and Fraser Valley). We used at least 3 immunoassays per serosurvey to detect SARS-CoV-2 spike and nucleocapsid antibodies. We assessed any seroprevalence (vaccineor infection-induced, or both), defined by positivity on any 2 assays, and infection-induced seroprevalence, also defined by dual-assay positivity but requiring both antinucleocapsid and antispike detection. We used estimates of infection-induced seroprevalence to explore underascertainment of infections by surveillance case reports.

Results: By January 2021, we estimated that any seroprevalence remained less than 5%, increasing with vaccine rollout to 56% by May-June 2021, 83% by September-October 2021 and 95% by March 2022. Infection-induced seroprevalence remained less than 15% through September-October 2021, increasing across Omicron waves to 42% by March 2022 and 61% by July-August 2022. By August 2022, 70%-80% of children younger than 20 years and 60%-70% of adults aged 20-59 years had been infected, but fewer than half of adults aged 60 years and older had been infected. Compared with estimates of infection-induced seroprevalence, surveillance case reports underestimated infections 12-fold between September 2021 and March 2022 and 92-fold between March 2022 and August 2022.

Interpretation: By August 2022, most children and adults younger than 60 years had evidence of both SARS-CoV-2 vaccination and infection. As previous evidence suggests that a history of both exposures may induce stronger, more durable hybrid immunity than either exposure alone, older adults - who have the lowest infection rates but highest risk of severe outcomes - continue to warrant prioritized vaccination.


Conflict of interest statement

Competing interests: Danuta Skowronski reports grants from the Canadian Institutes of Health Research and the British Columbia Centre for Disease Control Foundation for Public Health, paid to her institution, for other SARS-CoV-2 work. Romina Reyes is chair of the BC Diagnostic Accreditation Program committee. Mel Krajden reports grants paid to his institution from Roche, Hologic and Siemens. No other competing interests were declared.

Figures

Figure 1:
Figure 1:
Provincial surveillance case reports to the British Columbia Centre for Disease Control (BCCDC) by epidemiological week from January 2020 to September 2022, with timing of serosurveys and select public health measures, in BC, Canada. We group case tallies by epidemiological week (7-d period) as per standard surveillance methods for comparing data by period from year to year. Epidemic waves are enumerated sequentially and are displayed with the predominant variant of concern (VOC). Publicly funded access to nucleic acid amplification tests (NAATs) or rapid antigen tests (RATs) is displayed below the X-axis. For details on public health measures, vaccines, schedules and coverage estimates, see Appendix 1, Supplementary Material 1, available at www.cmaj.ca/lookup/doi/10.1503/cmaj.221335/tab-related-content. *Nonessential travel discouraged, health care service delivery adjusted, public gatherings > 50 people prohibited. Provincial state of emergency declared. †Interactions limited to households or “core bubble” (immediate family or those in same dwelling) or to a maximum of 2 other people if living alone. ‡Dine-in food services and indoor fitness activities banned, only essential travel permitted. §Gradual return to gatherings, recreational travel, in-person work, which was interrupted by the fourth wave. ¶Indoor and personal gatherings limited, 50% capacity limit at venues of > 1000 people, sports tournaments paused. Social restrictions lifted during epidemiological week 7, 2022. **Mask mandates lifted during epidemiological week 10, 2022. ††The first 2 spike-based mRNA vaccine formulations were authorized during epidemiological weeks 50 and 52, 2020, respectively, with mRNA vaccines comprising most doses (> 90%) administered in BC and Canada across the pandemic. In epidemiological week 8, 2021, a chimpanzee adenoviral-vectored (ChAdOx1) vaccine was also authorized. ‡‡Vaccines (mRNA) initially deployed to high-risk individuals, including residents and staff of long-term care and assisted-living facilities, essential visitors within those settings and health care workers. §§Community-based vaccine roll-out, prioritized by age, beginning with the oldest adults in mid-March 2021. Access to booster doses followed similar prioritization sequence, inclusive of clinically extremely vulnerable individuals of any age. ¶¶Single-dose vaccine card required for entry into social and recreational settings starting in epidemiological week 37, 2021; 2-dose cards were required beginning in epidemiological week 43, 2021. Vaccine cards were ultimately repealed in epidemiological week 14, 2022.
Figure 2:
Figure 2:
Seroprevalence (any and infection-induced) by age group and serosurvey (serosurvey 4 in January 2021, serosurvey 5 in May–June 2021, serosurvey 6 in September–October 2021, serosurvey 7 in March 2022, serosurvey 8 in July–August 2022). Darker bars represent the infection-induced seroprevalence, which may or may not include vaccinated individuals. Lighter plus darker bars together provide a combined estimate of “any” seroprevalence (vaccine-induced, infection-induced or both). Displayed seroprevalence estimates are based on Bayesian analysis, standardized for age, sex and health authority within the Lower Mainland, British Columbia, Canada. Analysis details are in Appendix 1, Supplementary Material 2, available at www.cmaj.ca/lookup/doi/10.1503/cmaj.221335/tab-related-content. Full results are in Table 2 and Appendix 1, Supplementary Table 4 (any seroprevalence) and Appendix 1, Supplementary Table 5 (infection-induced seroprevalence). Note: CrI = credible interval.
Figure 3:
Figure 3:
Difference in infection-induced seroprevalence by age group between the sixth and seventh (September–October 2021 to March 2022), and the seventh and eighth (March to July–August 2022) serosurveys. Displayed seroprevalence estimates are based on Bayesian analysis — standardized for age, sex and health authority within the Lower Mainland, British Columbia, Canada — and are predicated on the assumption of no reinfections and no antibody waning. In that context, estimates represent the rate of new infections between specified serosurveys, stratified by age group. Analysis details are in Appendix 1, Supplementary Material 4, available at www.cmaj.ca/lookup/doi/10.1503/cmaj.221335/tab-related-content. Full results are in Table 3 and Appendix 1, Supplementary Table 9. Note: CrI = credible interval.
Figure 4:
Figure 4:
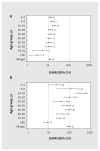
Period-specific surveillance underascertainment ratios (SUARs), overall and by age group between (A) the sixth and seventh (September– October 2021 to March 2022) serosurveys, and (B) the seventh and eighth (March 2022 to July–August 2022) serosurveys, Lower Mainland, British Columbia, Canada. Precise values, including period-specific surveillance case report tallies, new infection rates and SUARs, are in Table 3 and Appendix 1, Supplementary Table 9, available at www.cmaj.ca/lookup/doi/10.1503/cmaj.221335/tab-related-content. Note: CrI = credible interval.

Similar articles

Cited by

References

    1. Skowronski DM, Hottes TS, McElhaney JE, et al. . Immuno-epidemiologic correlates of pandemic H1N1 surveillance observations: higher antibody and lower cell-mediated immune responses with advanced age. J Infect Dis 2011; 203:158–67. - PMC - PubMed
    1. Skowronski DM, Hottes TS, Janjua NZ, et al. . Prevalence of seroprotection against the pandemic (H1N1) virus after the 2009 pandemic. CMAJ 2010;182:1851–6. - PMC - PubMed
    1. Skowronski DM, Chambers C, Sabaiduc S, et al. . Pre- and post-pandemic estimates of 2009 pandemic influenza A(H1N1) seroprotection to inform surveillance-based incidence, by age, during the 2013–2014 epidemic in Canada. J Infect Dis 2015;211:109–14. - PubMed
    1. Van Kerkhove MD, Hirve S, Koukounari A, et al. . Estimating age-specific cumulative incidence for the 2009 influenza pandemic: a meta-analysis of A(H1N1)pdm09 serological studies from 19 countries. Influenza Other Respir Viruses 2013;7:872–86. - PMC - PubMed
    1. Skowronski DM, Moser FS, Janjua NZ, et al. . H3N2v and other influenza epidemic risk based on age-specific estimates of sero-protection and contact network interactions. PLoS One 2013;8:e54015. - PMC - PubMed