. 2023 Feb 28;14(1):e0237022.
doi: 10.1128/mbio.02370-22. Epub 2022 Dec 12.

Herpes Simplex Virus 1-Induced Ferroptosis Contributes to Viral Encephalitis

Affiliations

Herpes Simplex Virus 1-Induced Ferroptosis Contributes to Viral Encephalitis

Xi-Qiu Xu et al. mBio. .

Abstract

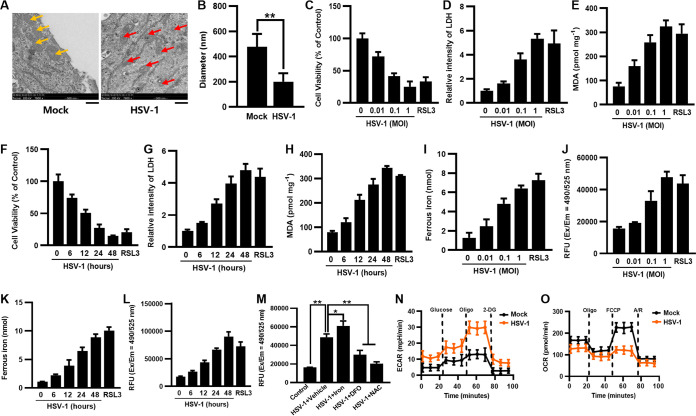
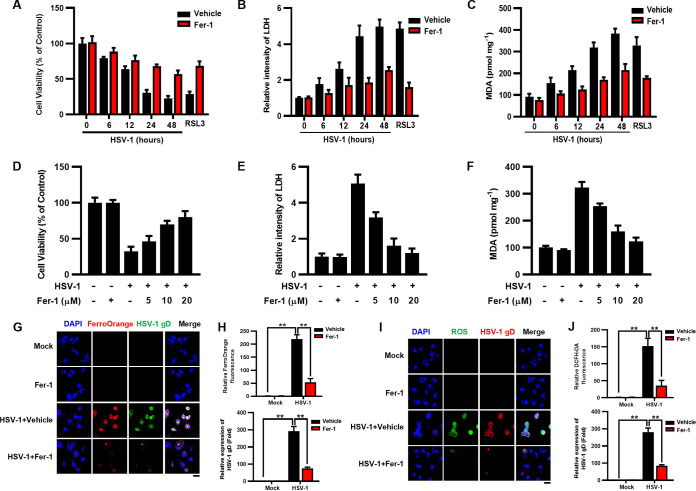
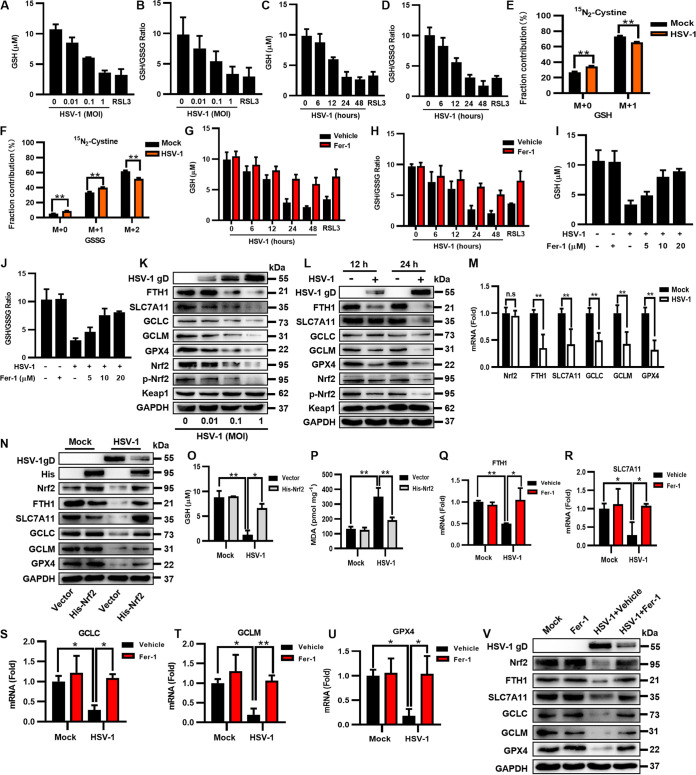
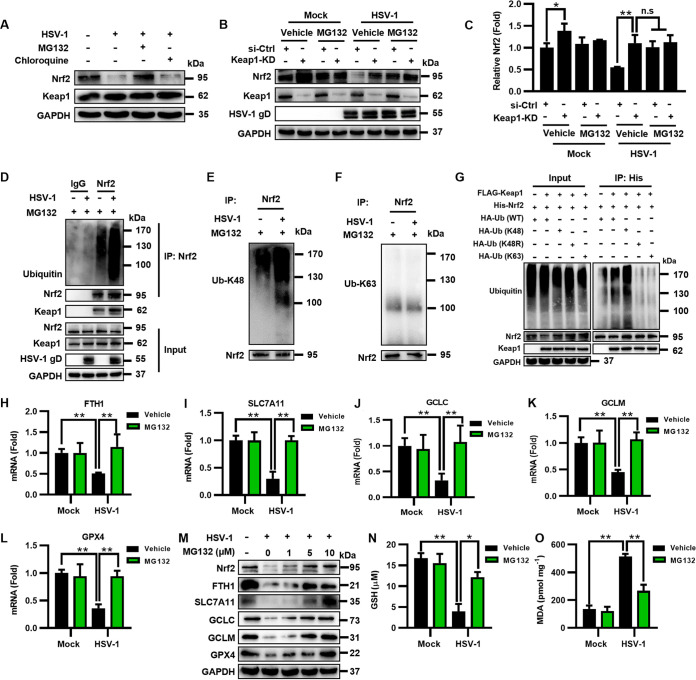
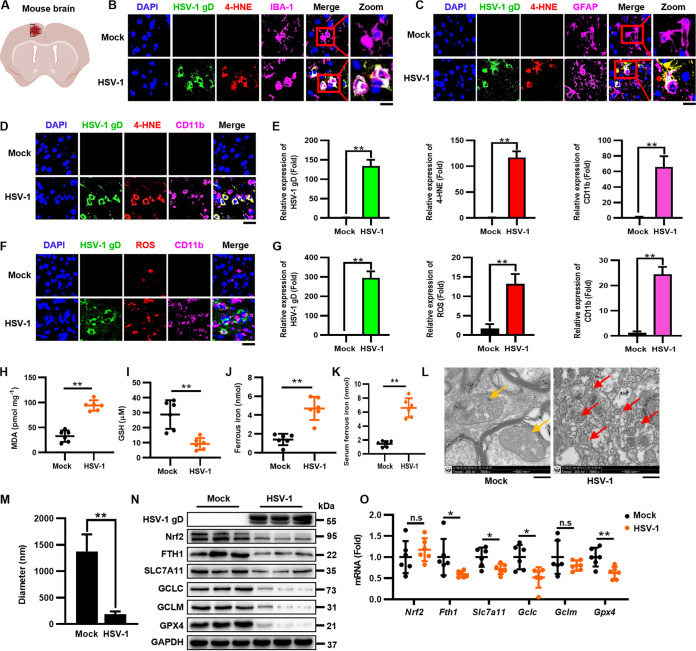
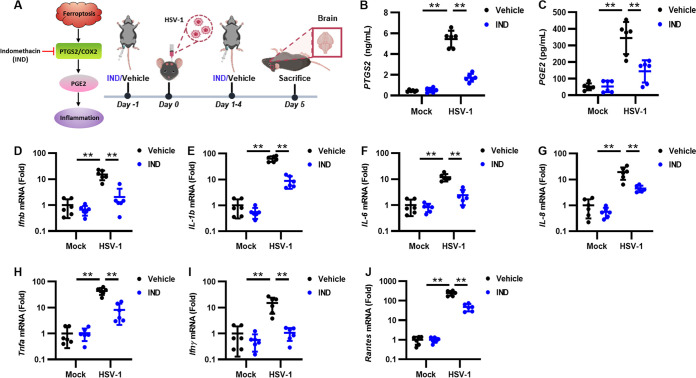
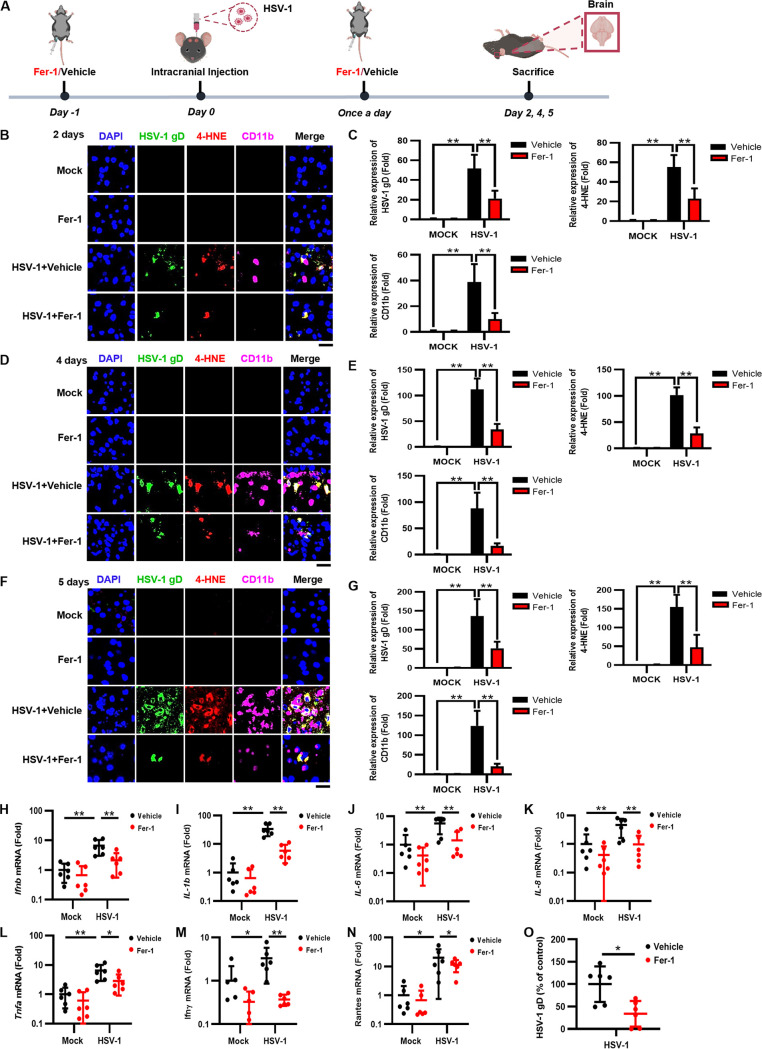
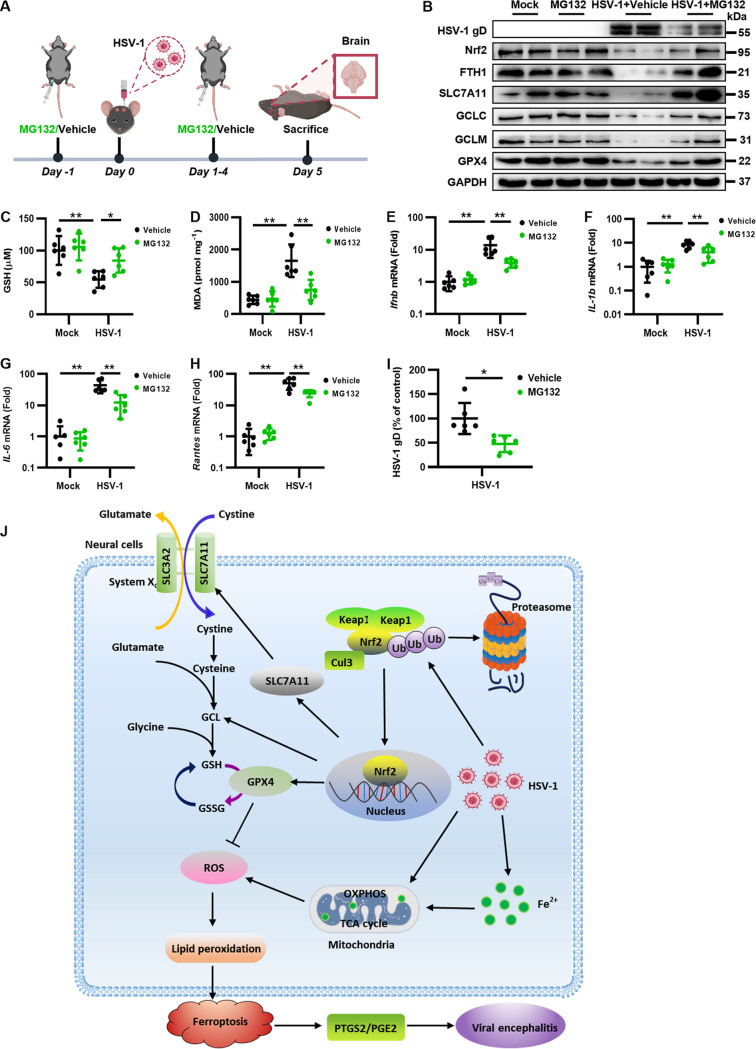
Herpes simplex virus 1 (HSV-1) is a DNA virus belonging to the family Herpesviridae. HSV-1 infection causes severe neurological disease in the central nervous system (CNS), including encephalitis. Ferroptosis is a nonapoptotic form of programmed cell death that contributes to different neurological inflammatory diseases. However, whether HSV-1 induces ferroptosis in the CNS and the role of ferroptosis in viral pathogenesis remain unclear. Here, we demonstrate that HSV-1 induces ferroptosis, as hallmarks of ferroptosis, including Fe2+ overload, reactive oxygen species (ROS) accumulation, glutathione (GSH) depletion, lipid peroxidation, and mitochondrion shrinkage, are observed in HSV-1-infected cultured human astrocytes, microglia cells, and murine brains. Moreover, HSV-1 infection enhances the E3 ubiquitin ligase Keap1 (Kelch-like ECH-related protein 1)-mediated ubiquitination and degradation of nuclear factor E2-related factor 2 (Nrf2), a transcription factor that regulates the expression of antioxidative genes, thereby disturbing cellular redox homeostasis and promoting ferroptosis. Furthermore, HSV-1-induced ferroptosis is tightly associated with the process of viral encephalitis in a mouse model, and the ferroptosis-activated upregulation of prostaglandin-endoperoxide synthase 2 (PTGS2) and prostaglandin E2 (PGE2) plays an important role in HSV-1-caused inflammation and encephalitis. Importantly, the inhibition of ferroptosis by a ferroptosis inhibitor or a proteasome inhibitor to suppress Nrf2 degradation effectively alleviated HSV-1 encephalitis. Together, our findings demonstrate the interaction between HSV-1 infection and ferroptosis and provide novel insights into the pathogenesis of HSV-1 encephalitis. IMPORTANCE Ferroptosis is a nonapoptotic form of programmed cell death that contributes to different neurological inflammatory diseases. However, whether HSV-1 induces ferroptosis in the CNS and the role of ferroptosis in viral pathogenesis remain unclear. In the current study, we demonstrate that HSV-1 infection induces ferroptosis, as Fe2+ overload, ROS accumulation, GSH depletion, lipid peroxidation, and mitochondrion shrinkage, all of which are hallmarks of ferroptosis, are observed in human cultured astrocytes, microglia cells, and murine brains infected with HSV-1. Moreover, HSV-1 infection enhances Keap1-dependent Nrf2 ubiquitination and degradation, which results in substantial reductions in the expression levels of antiferroptotic genes downstream of Nrf2, thereby disturbing cellular redox homeostasis and promoting ferroptosis. Furthermore, HSV-1-induced ferroptosis is tightly associated with the process of viral encephalitis in a mouse model, and the ferroptosis-activated upregulation of PTGS2 and PGE2 plays an important role in HSV-1-caused inflammation and encephalitis. Importantly, the inhibition of ferroptosis by either a ferroptosis inhibitor or a proteasome inhibitor to suppress HSV-1-induced Nrf2 degradation effectively alleviates HSV-1-caused neuro-damage and inflammation in infected mice. Overall, our findings uncover the interaction between HSV-1 infection and ferroptosis, shed novel light on the physiological impacts of ferroptosis on the pathogenesis of HSV-1 infection and encephalitis, and provide a promising therapeutic strategy to treat this important infectious disease with a worldwide distribution.

Keywords: HSV-1; Nrf2-Keap1; PTGS2/PGE2; ferroptosis; viral encephalitis.


Conflict of interest statement

The authors declare no conflict of interest.

Figures

FIG 1
FIG 1
HSV-1 induces ferroptosis in U373 cells. (A) U373 cells were infected or not infected with (MOI = 0.1) for 24 h, and images were obtained by transmission electron microscopy at magnifications of ×7,800. The yellow arrows indicate normal mitochondria in mock-infected cells, and the red ones indicate shrunken mitochondria in HSV-1-infected cells. Representative images are shown. Bars, 500 nm. (B) The diameter of the mitochondria was quantified. **, P < 0.01 (as measured by an unpaired t test). (C to H) U373 cells were infected with HSV-1 at an MOI of 0.01, 0.1, or 1 for 24 h (C to E) or an MOI of 0.1 for 6, 12, 24, or 48 h (F to H). Cells treated with RSL3 (5 μM) for 24 h were used as the positive control. (C and F) Cell viability was determined by a CCK8 assay, and the level of cell viability in uninfected cells was defined as 100%. (D and G) LDH released into the supernatants was determined by a cytotoxicity assay, and the level of LDH in uninfected cells was defined as 1-fold. (E and H) The MDA concentrations in cell lysates were determined by an MDA assay. (I and K) The ferrous iron concentrations in cell lysates were determined by an iron assay. (J and L) The ROS levels in cell lysates were determined by an ROS fluorometric assay. RFU, relative fluorescence units; Ex/Em, excitation/emission wavelength. (M) U373 cells were treated with exogenous iron (10 μM), deferoxamine (DFO) (100 μM), or N-acetylcysteine (NAC) (5 mM), followed by infection with HSV-1 (MOI = 0.1) for 24 h. The ROS levels in the cell lysates were determined by an ROS fluorometric assay. Data represent means ± SD from three repeated experiments. *, P < 0.05; **, P < 0.01 (as measured by two-way ANOVA). (N and O) U373 cells were infected with HSV-1 (MOI = 0.1) for 24 h and subjected to Seahorse analysis. Real-time changes in the ECAR (N) or OCR (O) of HSV-1-infected U373 cells after treatment with the indicated inhibitors are shown A/R, antimycin A and rotenone.
FIG 2
FIG 2
Fer-1 inhibits HSV-1-induced ferroptosis in U373 cells. (A to F) U373 cells were treated with Fer-1 (10 μM) or the vehicle (DMSO), followed by infection with HSV-1 (MOI = 0.1) for 6, 12, 24, or 48 h (A to C), or U373 cells were treated with Fer-1 (5, 10, or 20 μM) or the vehicle (DMSO), followed by infection with HSV-1 (MOI = 0.1) for 24 h (D to F). (A and D) Cell viability was determined by a CCK8 assay, and the level of cell viability in uninfected cells treated with the vehicle was defined as 100%. (B and E) LDH released into the supernatants was determined by a cytotoxicity assay, and the level of LDH in uninfected cells treated with the vehicle was defined as 1-fold. (C and F) The MDA concentrations in cell lysates were determined by an MDA assay. (G to J) U373 cells were infected with HSV-1 (MOI = 0.1), treated with or without Fer-1 for 24 h, and then subjected to immunofluorescence staining. The levels of Fe2+ (G and H) and ROS (I and J) were determined using FerroOrange (red) and DCFH-DA (green) probes, respectively. The levels of HSV-1 infection were determined using anti-HSV-1 gD antibody. DAPI was used for nuclear staining (blue). Bars, 20 μm. The relative fluorescence intensities of FerroOrange, DCFH-DA, and HSV-1 gD were quantified using ImageJ software, and the level of fluorescence signals in uninfected cells treated with the vehicle was defined as 1-fold (H and J). Representative images were acquired using fluorescence microscopy. **, P < 0.01 (as measured by two-way ANOVA).
FIG 3
FIG 3
HSV-1 interrupts the biosynthesis of GSH by downregulating the protein level of Nrf2 in U373 cells. (A to D) U373 cells were infected with HSV-1 at an MOI of 0.01, 0.1, or 1 for 24 h (A and B) or an MOI of 0.1 for 6, 12, 24, or 48 h (C and D). The intracellular GSH level and the GSH/GSSG ratio were measured using a GSSG/GSH quantification kit. (E and F) U373 cells were incubated in cystine-free medium supplemented with 0.26 mM [15N2]cystine and then infected with HSV-1 (MOI = 0.1) for 12 h. The extracted metabolites were analyzed by LC-MS/MS, and the distributions of isotopically labeled GSH and GSSG are presented. Data represent means ± SD from three repeated experiments. **, P < 0.01 (as measured by two-way ANOVA). (G to J) U373 cells were treated with Fer-1 (10 μM) or the vehicle (DMSO), followed by infection with HSV-1 (MOI = 0.1) for 6, 12, 24, or 48 h (G and H), or U373 cells were treated with Fer-1 (5, 10, or 20 μM) or the vehicle (DMSO), followed by infection with HSV-1 (MOI = 0.1) for 24 h (I and J). The intracellular GSH level and the GSH/GSSG ratio were measured using a GSSG/GSH quantification kit. (K and L) U373 cells were infected with HSV-1 at an MOI of 0.01, 0.1, or 1 for 24 h (K) or an MOI of 0.1 for 12 or 24 h (L). Total proteins were subjected to Western blotting with antibodies to HSV-1 gD, FTH1, SLC7A11, GCLC, GCLM, GPX4, Nrf2, p-Nrf2, Keap1, and GAPDH. (M) The expression levels of the indicated genes in U373 cells infected with HSV-1 (MOI = 0.1) were determined by qRT-PCR at 24 hpi. The relative mRNA level of each gene in uninfected cells was defined as 1-fold. Data represent means ± SD from three repeated experiments. **, P < 0.01; n.s, no significance (as measured by an unpaired t test). (N to P) U373 cells were transfected with a plasmid encoding His-Nrf2 or an empty vector and then infected with HSV-1 (MOI = 0.1). (N) At 24 hpi, total proteins were subjected to Western blotting with the indicated antibodies. (O) The intracellular GSH level was measured using a GSSG/GSH quantification kit. (P) The intracellular MDA concentration was determined by an MDA assay. Data represent means ± SD from three repeated experiments. *, P < 0.05; **, P < 0.01 (as measured by two-way ANOVA). (Q to V) U373 cells were treated with Fer-1 (10 μM) or the vehicle (DMSO), followed by infection with HSV-1 (MOI = 0.1) for 24 h. (Q to U) Total RNAs were subjected to qRT-PCR to determine the expression levels of the indicated genes, and the relative mRNA level of each indicated gene in uninfected cells treated with the vehicle was defined as 1-fold. Data represent means ± SD from three repeated experiments. *, P < 0.05; **, P < 0.01 (as measured by two-way ANOVA). (V) Total proteins were subjected to Western blotting with the indicated antibodies.
FIG 4
FIG 4
HSV-1 inhibits Nrf2 by accelerating its ubiquitination and degradation dependent on Keap1. (A) U373 cells were infected with HSV-1 (MOI = 0.1) and then treated with the vehicle (DMSO), MG132 (10 μM), or chloroquine (10 μM). At 24 hpi, total proteins were extracted and subjected to Western blotting with the indicated antibodies. (B and C) U373 cells were transfected with siRNA targeting Keap1 (Keap1-KD) or control siRNA (si-Ctrl) for 24 h and then infected with HSV-1 (MOI = 0.1) in the presence or absence of MG132 (10 μM). (B) At 24 hpi, total proteins were subjected to Western blotting with the indicated antibodies. (C) Relative quantification of Nrf2 normalized by GAPDH was performed using ImageJ software, and the relative protein level of Nrf2 in uninfected si-Ctrl cells treated with the vehicle was defined as 1-fold. *, P < 0.05; **, P < 0.01; n.s, no significance (as measured by two-way ANOVA). (D) U373 cells were infected with HSV-1 (MOI = 0.1) in the presence or absence of MG132 (10 μM) for 24 h and subjected to coimmunoprecipitation with anti-Nrf2 or anti-IgG antibody, followed by immunoblotting with the indicated antibodies. (E and F) The Nrf2-bound precipitates were analyzed using anti-UbK48 and anti-UbK63 antibodies. (G) HEK293T cells were cotransfected with FLAG-Keap1 and His-Nrf2 together with HA-UbWT, HA-UbK48, HA-UbK48R, or HA-UbK63 for 24 h and subjected to coimmunoprecipitation with anti-His antibody, followed by immunoblotting with the indicated antibodies. An empty vector was used to make sure that the total amounts of plasmids used in each sample were equal. (H to L) U373 cells were treated with MG132 (10 μM) or the vehicle (DMSO), followed by infection with HSV-1 (MOI = 0.1) for 24 h. Total RNAs were subjected to qRT-PCR to determine the expression levels of the indicated genes, and the relative mRNA level of each indicated gene in uninfected cells treated with the vehicle was defined as 1-fold. Data represent means ± SD from three repeated experiments. **, P < 0.01 (as measured by two-way ANOVA). (M) U373 cells were infected with HSV-1 (MOI = 0.1) and then treated with MG132 at a concentration of 1, 5, or 10 μM. At 24 hpi, total proteins were subjected to Western blotting with the indicated antibodies. (N and O) U373 cells were treated with MG132 (10 μM) or the vehicle (DMSO), followed by infection with HSV-1 (MOI = 0.1) for 24 h. (N) The intracellular GSH level was measured using a GSSG/GSH quantification kit. (O) The intracellular MDA concentration was determined using an MDA assay.
FIG 5
FIG 5
HSV-1 induces ferroptosis in murine brain astrocytes and microglia cells. Groups of 8-week-old C57BL/6 mice were i.c. injected with 1 × 105 PFU HSV-1 or mock infected (n = 6 for each group). Mice were euthanized at 5 dpi, and brains were extracted. (A) Field of representative images of mouse brains. (B and C) The cerebral cortex sections of brains from infected or mock-infected mice were fixed and subjected to immunostaining with anti-HSV-1 gD antibody (green), the 4-HNE probe (red), anti-IBA-1 antibody (pink), and anti-GFAP antibody (pink). DAPI was used for nuclear staining (blue). Representative images were acquired using fluorescence microscopy. Bars, 20 μm. (D to G) The cerebral cortex sections of the brains from infected or mock-infected mice were fixed and subjected to immunostaining with anti-HSV-1 gD antibody (green), the 4-HNE probe (red), the ROS probe (red), and anti-CD11b antibody (pink). DAPI was used for nuclear staining (blue). Representative images were acquired using fluorescence microscopy. Bars, 20 μm. The relative expression of the indicated fluorescence signals was quantified using ImageJ software. Data represent means ± SD. **, P < 0.01 (as measured by an unpaired t test). (H to J) The intracellular levels of MDA, Fe2+, and GSH in each group of brain lysates were measured by an MDA assay (H), an iron assay (I), and a GSSG/GSH quantification kit (J). (K) The intracellular levels of Fe2+ in the serum of HSV-1-infected mice were measured using an iron assay quantification kit. Data represent means ± SD. **, P < 0.01 (as measured by an unpaired t test). (L) The brain lysates were subjected to transmission electron microscopy at magnifications of ×7,800. The yellow arrows indicate normal mitochondria in the brains of uninfected mice, and the red ones indicate shrunken mitochondria in the brains of HSV-1-infected mice. Representative images are shown. (M) The diameter of the mitochondria was quantified. **, P < 0.01 (as measured by an unpaired t test). (N) Total proteins extracted from representative samples (n = 3) from different groups were subjected to Western blotting with the indicated antibodies. (O) The expression levels of the indicated genes in the different groups were determined by qRT-PCR, and the relative mRNA level of each indicated gene in the different groups was defined as 1-fold. Data represent means ± SD from three repeated experiments. *, P < 0.05; **, P < 0.01; n.s, no significance (as measured by an unpaired t test).
FIG 6
FIG 6
HSV-1 ferroptosis-activated upregulation of PTGS2 and PGE2 contributes to viral encephalitis. (A) Groups of 8-week-old C57BL/6 mice (n = 6 for each group) were i.p. injected with IND (10 mg/kg) or the vehicle (DMSO) 24 h before challenge with 1 × 105 PFU of HSV-1 or mock infected, followed by treatment once a day for 5 days. Mice were euthanized at 5 dpi, and brains were extracted. (B and C) The levels of PTGS2 and PGE2 in serum were determined by ELISAs. (D to J) Total RNAs were extracted from the brains of mice from different groups and subjected to qRT-PCR to determine the expression levels of the indicated proinflammatory genes, and the relative mRNA level of each indicated gene in uninfected mice treated with the vehicle was defined as 1-fold. Data represent means ± SD. **, P < 0.01 (as measured by two-way ANOVA).
FIG 7
FIG 7
Fer-1 treatment protects mice against HSV-1 encephalitis. (A) Groups of 8-week-old C57BL/6 mice (n = 6 for each group) were i.p. injected with Fer-1 (10 mg/kg) or the vehicle (DMSO) 24 h before challenge with 1 × 105 PFU of HSV-1 or mock infected, followed by treatment once a day. Mice were euthanized at 2, 4, or 5 dpi, and brains were extracted. (B to G) The cerebral cortex sections of the brains at different time points were fixed and subjected to immunostaining with anti-HSV-1 gD antibody (green), the 4-HNE probe (red), and anti-CD11b antibody (pink). DAPI was used for nuclear staining (blue). Representative images were acquired using fluorescence microscopy. Bars, 20 μm. The relative expression levels of the indicated fluorescence signals were quantified using ImageJ software. **, P < 0.01 (as measured by two-way ANOVA). (H to O) Total RNAs were extracted from the brains of mice from different groups and subjected to qRT-PCR to determine the expression levels of the indicated proinflammatory genes and HSV-1 gD, and the relative mRNA level of each indicated gene in uninfected mice treated with the vehicle was defined as 1-fold, or the relative RNA level of HSV-1 gD in infected cells treated with the vehicle was defined as 100%. Data represent means ± SD. *, P < 0.05; **, P < 0.01 (as measured by two-way ANOVA).
FIG 8
FIG 8
MG132 treatment protects mice against HSV-1 encephalitis. (A) Groups of 8-week-old C57BL/6 mice (n = 6 for each group) were i.p. injected with MG132 (10 mg/kg) or the vehicle (DMSO) 24 h before challenge with 1 × 105 PFU of HSV-1 or mock infected, followed by treatment once a day for 5 days. Mice were euthanized at 5 dpi, and brains were extracted. (B) Total proteins extracted from representative samples (n = 2) from different groups were subjected to Western blotting with the indicated antibodies. (C and D) The intracellular levels of GSH and MDA in each group of brain lysates were measured using a GSSG/GSH quantification kit (C) and an MDA assay (D). Data represent means ± SD. *, P < 0.05; **, P < 0.01 (as measured by two-way ANOVA). (E to I) Total RNAs were extracted from the brains of mice from different groups and subjected to qRT-PCR to determine the expression levels of the indicated proinflammatory genes and HSV-1 gD, and the relative mRNA level of each indicated gene in uninfected mice treated with the vehicle was defined as 1-fold, or the relative RNA level of HSV-1 gD in infected cells treated with the vehicle was defined as 100%. Data represent means ± SD. *, P < 0.05; **, P < 0.01 (as measured by two-way ANOVA). (J) Model of the possible mechanism underlying the induction of ferroptosis by HSV-1 in neural cells.

References

    1. Yin Y, Favoreel HW. 2021. Herpesviruses and the type III interferon system. Virol Sin 36:577–587. doi: 10.1007/s12250-020-00330-2. - DOI - PMC - PubMed
    1. WHO. 2022. Herpes simplex virus. WHO, Geneva, Switzerland. https://www.who.int/news-room/fact-sheets/detail/herpes-simplex-virus.
    1. Bradshaw MJ, Venkatesan A. 2016. Herpes simplex virus-1 encephalitis in adults: pathophysiology, diagnosis, and management. Neurotherapeutics 13:493–508. doi: 10.1007/s13311-016-0433-7. - DOI - PMC - PubMed
    1. Yang WS, Stockwell BR. 2016. Ferroptosis: death by lipid peroxidation. Trends Cell Biol 26:165–176. doi: 10.1016/j.tcb.2015.10.014. - DOI - PMC - PubMed
    1. Park E, Chung SW. 2019. ROS-mediated autophagy increases intracellular iron levels and ferroptosis by ferritin and transferrin receptor regulation. Cell Death Dis 10:822. doi: 10.1038/s41419-019-2064-5. - DOI - PMC - PubMed

Publication types