. 2022 Dec 21;70(50):15928-15944.
doi: 10.1021/acs.jafc.2c06230. Epub 2022 Dec 12.

Linolenic Acid-Derived Oxylipins Inhibit Aflatoxin Biosynthesis in Aspergillus flavus through Activation of Imizoquin Biosynthesis

Affiliations

Linolenic Acid-Derived Oxylipins Inhibit Aflatoxin Biosynthesis in Aspergillus flavus through Activation of Imizoquin Biosynthesis

Shaowen Wu et al. J Agric Food Chem. .

Abstract

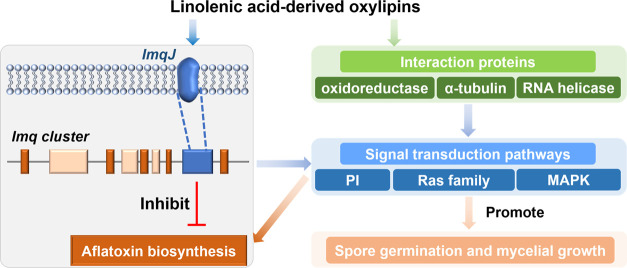
Oxylipins play important signaling roles in aflatoxin (AF) biosynthesis in Aspergillus flavus. We previously showed that exogenous supply of autoxidated linolenic acid (AL) inhibited AF biosynthesis in A. flavus via oxylipins, but the molecular mechanism is still unknown. Here, we performed multiomics analyses of A. flavus grown in media with or without AL. Targeted metabolite analyses and quantitative reverse transcription (qRT)-polymerase chain reaction (PCR) showed that the imizoquin (IMQ) biosynthetic pathway was distinctly upregulated in the presence of AL. 13C-glucose labeling confirmed in parallel that the tricarboxylic acid cycle was also enhanced by AL, consistent with observed increases in mycelial growth. Moreover, we integrated thermal proteome profiling and molecular dynamics simulations to identify a potential receptor of AL; AL was found to interact with a transporter (ImqJ) located in the IMQ gene cluster, primarily through hydrophobic interactions. Further analyses of strains with an IMQ pathway transcription factor overexpressed or knocked out confirmed that this pathway was critical for AL-mediated inhibition of AF biosynthesis. Comparison of 22 assembled A. flavus and Aspergillus oryzae genomes showed that genes involved in the IMQ pathway were positively selected in A. oryzae. Taken together, the results of our study provide novel insights into oxylipin-mediated regulation of AF biosynthesis and suggest potential methods for preventing AF contamination of crops.

Keywords: Aspergillus flavus; aflatoxins; imizoquin; multiomics; thermal proteome profiling.


Conflict of interest statement

The authors declare no competing financial interest.

Figures

Figure 1
Figure 1
Autoxidated linolenic acid (AL) treatment altered the morphology and transcriptome of A. flavus. (A) Mycelia dry weight, glucose content in growth media, and NH4+ content in growth media over 6 days. The p-values obtained from the Student’s t-test analysis of the data collected from each time point were presented. (B) Morphological changes in AL-treated and control (CK) mycelia over 3 days. (C) Distribution of gene expression levels in CK- and AL-treated mycelia. (D) Comparison of upregulated genes (up) and downregulated genes (down) between CK mycelia on different days (top row), between AL-treated mycelia on different days (middle row), and between CK and AL-treated mycelia on each day (bottom row). CK1-3 and AL1-3 represent samples collected on days 1 through 3, respectively. (E) Growth specificity index (gsi) distribution. (F) Abundance model of mycelial growth over 3 days. (G) KEGG biochemical pathway enrichment analysis of differentially expressed genes.
Figure 2
Figure 2
TCA cycle and oxidative phosphorylation were promoted by AL treatment. (A) PCA of the primary metabolome in mycelia samples detected by GC-MS demonstrates differences in the metabolomes of control mycelia (CK) and those treated with AL. (B) Heat map showing Log2 FC values for 132 metabolites that were differentially accumulated between AL and CK mycelia samples over 3 days of growth. The relative abundance of each metabolite was normalized to the mean value from CK samples on different days. Metabolites were included in this analysis only if they were significantly differentially accumulated. Significant differences were observed at p ≤ 0.05 (two-way analysis of variance (ANOVA)) with an additional false discovery rate (FDR) threshold of ≤0.05 to correct for multiple comparisons. (C) KEGG pathway enrichment analysis of upregulated and downregulated proteins. (D) Diagram of the experimental methods for 13C labeling metabolic flux experiments. (E) Total 13C enrichment of tricarboxylic acid cycle intermediates over time.
Figure 3
Figure 3
Impacts of AL treatment on specialized metabolite gene cluster expression. (A) Heat map showing expression of genes in specialized metabolite gene clusters in control (CK) and AL-treated mycelia after 1 day of growth. (B–D) Gene expression as measured via qRT-PCR. Expression changes are represented as the Log2 FC of transcript abundance for genes encoding proteins involved in the biosynthesis of AF (B), imizoquins (C), or kojic acid (D) after AL or stearic acid (SA) treatment. Levels of AF (E) and kojic acid (F) over time. (G) Relative TMC-2B content in mycelia as measured by LC-MS.
Figure 4
Figure 4
imqK overexpression or deletion affected aflatoxin (AF) production in A. flavus and genes involved in the IMQ gene cluster were positively selected in A. oryzae. (A) Mycelia phenotypes in WT-3357, ΔimqK, and OE::imqK strains after 3 days of incubation. (B) AF contents in the medium from the culture inoculated with the three strains. (C) Relative contents of TMC-2B and TMC-2A in the mycelia from the three strains. (D) Dry weight curve of ΔimqK and OE::imqK strains during 5 days of incubation. (E, F) Inhibition rate of AF production in WT-3357 or ΔimqK strains treated with different concentrations of AL. (G) Phylogenetic tree for further analysis of 13 A. flavus and nine A. oryzae strains. This maximum likelihood tree was constructed from 4927 orthologous protein-coding genes, and all nodes had >90% bootstrap support. “a” is the branch separating A. oryzae (foreground branch, green) and A. flavus (background branch, black) used in PAML CodeML. (H) Gene loss rate of DEGs in AL-treated samples (AL_DEG), in CK samples (CK_DEG), and genes that were stably expressed in the CK- and AL-treated samples (EQUAL_Exp) in A. flavus and A. oryzae. (I) Positively selected gene (PSG) density in Aspergillus chromosome. The y-axis indicates the copy number of positively selected genes per 100 kb detected by PAML CodeML.
Figure 5
Figure 5
Characterization of interactions between AL and ImqJ. (A) Experimental design of thermal proteome profiling experiments. Protein samples were incubated at temperatures from 28 to 70 °C. Soluble proteins were analyzed from each fraction using quantitative mass spectrometry. Proteins for which we obtained high-quality melting curves, i.e., fitted R2 values 0.95, were used in further analyses. (B) Comparison of protein Tm shifts determined from two biological replicates. Melting curves for ImqJ (C) and ImqG (D), which are involved in IMQ biosynthesis. Error rates were calculated from two independent replicate experiments. (E) Diagram showing a molecular dynamics simulation system. ImqJ was embedded in a lipid bilayer in the presence of AL molecules. (F) Root mean square deviation (RMSD) plots for the protein backbone in the three simulations. ImqJ-AL5, ImqJ-AL7, and ImqJ-All AL represent the systems containing ∼6 mM 13-HPOTE (AL5), 6 mM 9-HPOTE (AL7), and a 25 mM mixture of AL molecules. (G) Plots showing variation in the minimum distance between AL7 molecules and ImqJ over time. When the minimum distance changed at the nanometer scale, AL did not bind to ImqJ. After AL bound to ImqJ, the minimum distance was typically smaller than 0.4 nm. (H) Contact map for ImqJ and AL molecules obtained from the simulation trajectories. 1, 2, and 3 represent the maps for ImqJ-AL5, ImqJ-AL7, and ImqJ-All AL, respectively. Structural representation of ImqJ-AL5 and ImqJ-AL7, showing one AL5 (I) and two AL7 (J) molecules bound to the ImqJ hydrophobic pocket, which consisted of two α-helices (residues 177–191 and 215–229). AL molecules that bound to other ImqJ residues are indicated with gray arrows.
Figure 6
Figure 6
Proposed model of AL-mediated AF inhibition and mycelial growth in A. flavus.

Similar articles

Cited by

References

    1. Amaike S.; Keller N. P. Aspergillus flavus. Annu. Rev. Phytopathol. 2011, 49, 107–133. 10.1146/annurev-phyto-072910-095221. - DOI - PubMed
    1. Yu J.; Cleveland T. E.; Nierman W. C.; Bennett J. W. Aspergillus flavus genomics: gateway to human and animal health, food safety, and crop resistance to diseases. Rev. Iberoam. Micol. 2005, 22, 194–202. 10.1016/s1130-1406(05)70043-7. - DOI - PubMed
    1. Caceres I.; Khoury A. A.; Khoury R. E.; Lorber S.; Oswald I. P.; Khoury A. E.; Atoui A.; Puel O.; Bailly J. D. Aflatoxin Biosynthesis and Genetic Regulation: A Review. Toxins 2020, 12, 150 10.3390/toxins12030150. - DOI - PMC - PubMed
    1. Liao J.; He Z.; Xia Y.; Lei Y.; Liao B. A review on biosynthesis and genetic regulation of aflatoxin production by major Aspergillus fungi. Oil Crop Sci. 2020, 5, 166–173. 10.1016/j.ocsci.2020.11.001. - DOI
    1. Chang P. K.; Scharfenstein L. L.; Ehrlich K. C.; Wei Q.; Bhatnagar D.; Ingber B. F. Effects of laeA deletion on Aspergillus flavus conidial development and hydrophobicity may contribute to loss of aflatoxin production. Fungal Biol. 2012, 116, 298–307. 10.1016/j.funbio.2011.12.003. - DOI - PubMed