

ACTIVLIM-Hemo: A new self-reported, unidimensional and linear measure of activity limitations in persons with haemophilia
- PMID: 36508315
- PMCID: PMC10107861
- DOI: 10.1111/hae.14705
ACTIVLIM-Hemo: A new self-reported, unidimensional and linear measure of activity limitations in persons with haemophilia
Abstract
Introduction: To assess activity limitations in people with haemophilia (PwH), the self-reported Haemophilia Activity List (HAL) is widely employed, despite several methodological limitations impacting the interpretation of categorical scores. Modern psychometric approaches avoid these limitations by using a probabilistic model, such as the Rasch model. The ACTIVLIM is a Rasch-built measurement of activity limitations previously validated in several clinical conditions like neuromuscular disorders.
Aims: This study sought to develop the ACTIVLIM-Hemo, meaning an ACTIVLIM scale version specifically adapted to assess daily activity limitations in adult PwH.
Methods: Daily activities were assessed as "impossible," "difficult" or "easy" by 114 PwH (median age of 44 years) with 63 of them reassessed after 12 days. The Rasch Rating Scale model was used to identify activities delineating a unidimensional and linear scale unbiased by demographic and clinical status. Concurrent validity was determined through correlation with the HAL sub-scores and sum score.
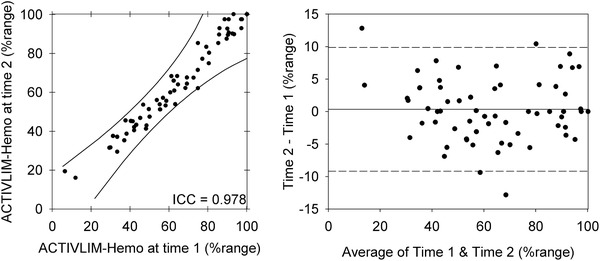
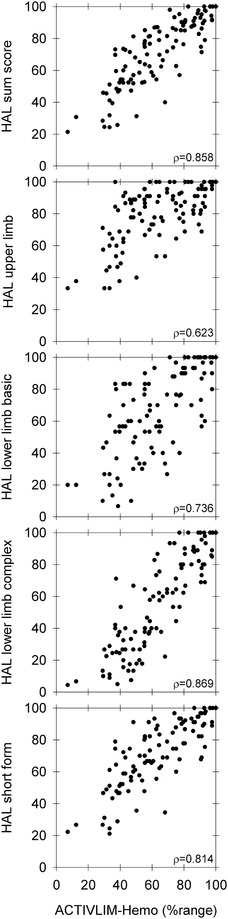
Results: The ACTIVLIM-Hemo included 22 pertinent activities, with difficulties independent of demographic and clinical conditions, allowing a reliable measure of activity limitations (PSI = .92) expressed on a linear and unidimensional scale in PwH (7%-100 % range, ceiling effect of 1/114) with excellent test-retest reliability (ICC = .978). Spearman rank correlations between ACTIVLIM-Hemo and HAL sub-scores ranged between .623 and .869.
Conclusions: The ACTIVLIM-Hemo is an easy-to-administer, valid and reliable alternative to HAL in assessing activity limitations in PwH. Its invariant scale can be used across conditions and time to compare the functional status of PwH over a wide measurement range.
Keywords: bleeding disorder, disability and health; haemophilia, International Classification of Functioning (ICF), outcome assessment, questionnaire, rash analysis, scale.
© 2022 The Authors. Haemophilia published by John Wiley & Sons Ltd.
Conflict of interest statement
The authors have no conflicts of interest to declare. All co‐authors have seen and agree with the contents of the manuscript and there is no financial interest to report. We certify that the submission is original work and is not under review at any other publication.
Figures


Similar articles
-
Reliability and construct validity of the ACTIVLIM-Hemo and Haemophilia Activities List (HAL) questionnaires in individuals with haemophilia.Haemophilia. 2024 Mar;30(2):497-504. doi: 10.1111/hae.14954. Epub 2024 Feb 20. Haemophilia. 2024. PMID: 38379191
-
Assessing the test-retest reliability and smallest detectable change of the Haemophilia Activities List.Haemophilia. 2021 Jan;27(1):108-112. doi: 10.1111/hae.14226. Epub 2020 Dec 13. Haemophilia. 2021. PMID: 33314438 Free PMC article.
-
ACTIVLIM-Stroke: a crosscultural Rasch-built scale of activity limitations in patients with stroke.Stroke. 2012 Mar;43(3):815-23. doi: 10.1161/STROKEAHA.111.638965. Epub 2012 Jan 5. Stroke. 2012. PMID: 22223234
-
Transcultural adaptation and validation of the Spanish-language version of ACTIVLIM in adults with inherited myopathies using the Rasch model.Neurologia (Engl Ed). 2021 Sep;36(7):514-524. doi: 10.1016/j.nrleng.2020.05.005. Epub 2020 May 29. Neurologia (Engl Ed). 2021. PMID: 34537165
-
Understanding treatment burden in hemophilia: development and validation of the Hemophilia Treatment Experience Measure (Hemo-TEM).J Patient Rep Outcomes. 2023 Feb 23;7(1):17. doi: 10.1186/s41687-023-00550-6. J Patient Rep Outcomes. 2023. PMID: 36821002 Free PMC article. Review.
Cited by
-
Development of a short form of the Swedish version of the Hemophilia Activities List.Sci Rep. 2025 Jul 7;15(1):24213. doi: 10.1038/s41598-025-02110-y. Sci Rep. 2025. PMID: 40624021 Free PMC article.
References
-
- Srivastava A, Santagostino E, Dougall A, et al. WFH guidelines for the management of hemophilia. Haemophilia. 2020. ;26(S6):1‐158. - PubMed
-
- WHO . The international classification of functioning, disability and health. World Heal Organ. 2001;18:237. - PubMed
-
- Poonnoose PM, Manigandan C, Thomas R, et al. Functional independence score in haemophilia: a new performance‐based instrument to measure disability. Haemophilia. 2005;11(6):598‐602. - PubMed
-
- van Genderen FR, van Meeteren NLU, van der Bom JG, et al. Functional consequences of haemophilia in adults: the development of the haemophilia activities list. Haemophilia. 2004;10(5):565‐571. - PubMed
MeSH terms
Grants and funding
LinkOut - more resources
Full Text Sources
Medical
