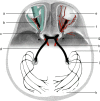
Visualization of human optic nerve by diffusion tensor mapping and degree of neuropathy
- PMID: 36508429
- PMCID: PMC9744320
- DOI: 10.1371/journal.pone.0278987
Visualization of human optic nerve by diffusion tensor mapping and degree of neuropathy
Abstract
Diffusion-weighted magnetic resonance imaging of the human optic nerve and tract is technically difficult because of its small size, the inherent strong signal generated by the surrounding fat and the cerebrospinal fluid, and due to eddy current-induced distortions and subject movement artifacts. The effects of the bone canal through which the optic nerve passes, and the proximity of blood vessels, muscles and tendons are generally unknown. Also, the limited technical capabilities of the scanners and the minimization of acquisition times result in poor quality diffusion-weighted images. It is challenging for current tractography methods to accurately track optic pathway fibers that correspond to known anatomy. Despite these technical limitations and low image resolution, here we show how to visualize the optic nerve and tract and quantify nerve atrophy. Our visualization method based on the analysis of the diffusion tensor shows marked differences between a healthy male subject and a male subject with progressive optic nerve neuropathy. These differences coincide with diffusion scalar metrics and are not visible on standard morphological images. A quantification of the degree of optic nerve atrophy in a systematic way is provided and it is tested on 9 subjects from the Human Connectome Project.
Copyright: © 2022 Łabieniec et al. This is an open access article distributed under the terms of the Creative Commons Attribution License, which permits unrestricted use, distribution, and reproduction in any medium, provided the original author and source are credited.
Conflict of interest statement
The authors have declared that no competing interests exist.
Figures


Similar articles
-
Comparison of multiple tractography methods for reconstruction of the retinogeniculate visual pathway using diffusion MRI.Hum Brain Mapp. 2021 Aug 15;42(12):3887-3904. doi: 10.1002/hbm.25472. Epub 2021 May 12. Hum Brain Mapp. 2021. PMID: 33978265 Free PMC article.
-
Quantitative assessment of optic nerve in patients with Leber's hereditary optic neuropathy using reduced field-of-view diffusion tensor imaging.Eur J Radiol. 2017 Aug;93:24-29. doi: 10.1016/j.ejrad.2017.05.025. Epub 2017 May 22. Eur J Radiol. 2017. PMID: 28668421
-
Multishell Diffusion MR Tractography Yields Morphological and Microstructural Information of the Anterior Optic Pathway: A Proof-of-Concept Study in Patients with Leber's Hereditary Optic Neuropathy.Int J Environ Res Public Health. 2022 Jun 5;19(11):6914. doi: 10.3390/ijerph19116914. Int J Environ Res Public Health. 2022. PMID: 35682499 Free PMC article.
-
Diffusion-weighted imaging of the spinal cord and optic nerve.J Neurol Sci. 2001 May 1;186 Suppl 1:S45-9. doi: 10.1016/s0022-510x(01)00490-7. J Neurol Sci. 2001. PMID: 11334989 Review.
-
Potential and limitations of diffusion MRI tractography for the study of language.Brain Lang. 2014 Apr;131:65-73. doi: 10.1016/j.bandl.2013.06.007. Epub 2013 Jul 30. Brain Lang. 2014. PMID: 23910928 Review.
References
Publication types
MeSH terms
LinkOut - more resources
Full Text Sources
Medical

