. 2022 Dec 12;17(12):e0278131.
doi: 10.1371/journal.pone.0278131. eCollection 2022.

Perceived discomfort and neuromuscular fatigue during long-duration real driving with different car seats

Affiliations

Perceived discomfort and neuromuscular fatigue during long-duration real driving with different car seats

Mathieu Lecocq et al. PLoS One. .

Abstract

Introduction: Identification of the seat features that could improve driving experience is a main issue for automotive companies.

Objective: Long duration real driving sessions were performed to assess the effect of three seats (soft-S1, firm-S2 and suspended-S3) on perceived discomfort and neuromuscular fatigue (NMF).

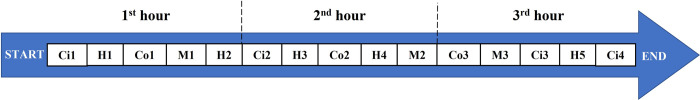
Materials & methods: For each seat, the muscular activity of bilateral Trapezius Descendens (TD), Erector Spinae (ES) and Multifidus (MF) muscles of twenty-one participants was recorded during real driving sessions of 3-hours each lasting approximately 3 hours and following the same itinerary. During each driving session, participants were also regularly asked to self-evaluate their level of whole-body and local discomfort. In addition, an endurance static test (EST) was performed before (ESTpre) and after (ESTpost) each driving session to assess the seat effect on physical capacity.

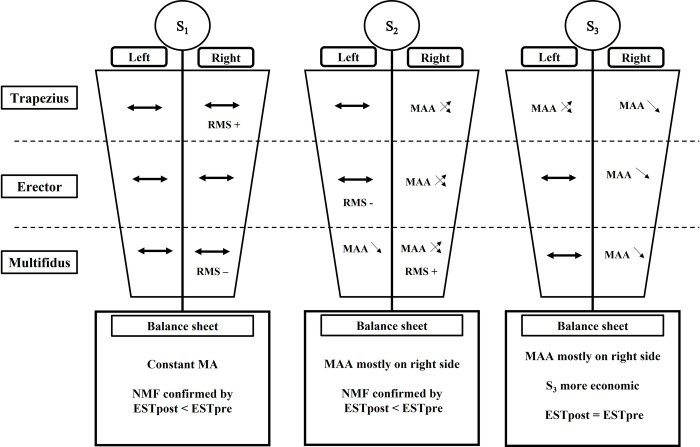
Results: Whole-body discomfort increased with driving time for all seats, but this increase became significant latter for S3. The highest scores of local discomfort occurred for neck and lower back. Contrary to S1 and S2, the duration of ESTpost was not significantly lower compared to ESTpre with the S3. Interestingly, muscular activity of S1 remained stable throughout the driving task which could be attributed to sustained muscular contraction, while muscular recruitment adjustments occurred for S2 and S3 from 1H00 of driving. This muscular compensation concerns mostly the right side for S2 and S3 but with different profiles. On the left side, the muscular adjustments concern only the MF with S2 and the ES with S3.

Conclusion: Overall, our results demonstrated that S3 could be considered as the most suitable seat to delay discomfort and NMF appearance.


Conflict of interest statement

The authors have declared that no competing interests exist.

Figures

Fig 1
Fig 1. Chronologic order of road sectors throughout the driving itinerary.
Each participant followed the same itinerary, which included city (Ci), highway (H), country (Co) and mountain (M) roads.
Fig 2
Fig 2. Illustration of endurance static test performed before (ESTpre) and after (ESTpost) the driving session.
Fig 3
Fig 3. Endurance time mean (in seconds) of ESTpre and ESTpost driving session for the three tested seats.
Significant differences between endurance time measured before and after driving session are illustrated by * (p<0.001).
Fig 4
Fig 4. Evolution of whole-body discomfort during driving session.
Significant level of discomfort compared to the initial value are represented by ● for S1; ■ for S2 and ▲ for S3 (1 symbol; p<0,05; 2 symbols: p<0,01 & three symbols: p<0,001).
Fig 5
Fig 5. Local discomfort scores according to each body part for each seat.
Fig 6
Fig 6
Mean of right (a) and left (b) TD normalized RMS values for each road sector for all seats. Significant differences between sectors of a same road type are symbolized by * (sectors concerned by the significant differences are mentioned above *); significant differences between S1 and other seats for a same road sector §; significant differences between S2 and S3 seats for a same road sector ●.
Fig 7
Fig 7
Mean of right (a) and left (b) ESL normalized RMS values for each road sector for all seats. Significant differences between sectors of a same road type are symbolized by * (sectors concerned by the significant differences are mentioned above *); significant differences between S1 and other seats for a same road sector §; significant differences between S2 and S3 seats for a same road sector ●.
Fig 8
Fig 8
Mean of right (a) and left (b) MF normalized RMS values for each road sector for all seats. Significant differences between sectors of a same road type are symbolized by * (sectors concerned by the significant differences are mentioned above *); significant differences between S1 and other seats for a same road sector §; significant differences between S2 and S3 seats for a same road sector ●.
Fig 9
Fig 9. Schematic representation of muscular activity evolution of back muscles during the driving task for the three tested seats.
With the S1 seat, the muscular activity remains mostly stable (horizontal bold arrow) for all muscles while there is muscular activity adjustments (MAA) for the two other seat. For a same seat, crossed arrows represent fluctuation of muscular activity during the driving task; down arrows represent diminution of muscular activity with driving time. Moreover, RMS+ and RMS- are indicated when for the same muscle a seat induces respectively higher or lower muscular activity compared to the other seats for most of road sectors.

References

    1. Summala H, Hakkanen H TIMO Mikkola T & Sinkkonen J. (1999) Task effects on fatigue symptoms in overnight driving, Ergonomics, 42:6, 798–806, doi: 10.1080/001401399185298 - DOI - PubMed
    1. Akerstedt T, Hallvig D, Anund A, Fors C, Schwarzi J and Kecklund G. Having to stop driving at night because of dangerous sleepiness–awareness, physiology and behaviour. J Sleep Res. (2013) 22, 380–388. doi: 10.1111/jsr.12042 - DOI - PubMed
    1. Anund A, Lahti E, Fors C, Genell A (2015) The Effect of Low-Frequency Road Noise on Driver Sleepiness and Performance. PLoS ONE 10(4): e0123835. doi: 10.1371/journal.pone.0123835 - DOI - PMC - PubMed
    1. Desmond PA, Hancock PA. Active and passive fatigue states. In: Hancock P. A. and Desmond P. A. (Eds.), Stress workload and fatigue. Mahwah: Lawrence Erlbaum Associates, Inc. 2001, pp. 445–465.
    1. Jagannath M., Balasubramanian V., 2014. Assessment of early onset of driver fatigue using multimodal fatigue measures in a static simulator. Appl. Ergon. 45 (4), 1140–1147. doi: 10.1016/j.apergo.2014.02.001 - DOI - PubMed

Publication types