. 2022 Dec 12;17(12):e0278966.
doi: 10.1371/journal.pone.0278966. eCollection 2022.

Microtubule-associated protein 1B is implicated in stem cell commitment and nervous system regeneration in planarians

Affiliations

Microtubule-associated protein 1B is implicated in stem cell commitment and nervous system regeneration in planarians

Gaetana Gambino et al. PLoS One. .

Abstract

Microtubule-associated 1B (MAP1B) proteins are expressed at the nervous system level where they control cytoskeleton activity and regulate neurotransmitter release. Here, we report about the identification of a planarian MAP1B factor (DjMap1B) that is enriched in cephalic ganglia and longitudinal nerve cords but not in neoblasts, the plentiful population of adult stem cells present in planarians, thanks to which these animals can continuously cell turnover and regenerate any lost body parts. DjMap1B knockdown induces morphological anomalies in the nervous system and affects neoblast commitment. Our data put forward a correlation between a MAP1B factor and stem cells and suggest a function of the nervous system in non-cell autonomous control of planarian stem cells.


Conflict of interest statement

The authors have declared that no competing interests exist.

Figures

Fig 1
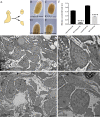
Fig 1. DjMap1B, DjNB-21.11 and DjMCM2 expression in intact planarians.
Representative images of DjMap1B expression in (A) a control animal and (B) a 30 Gy irradiated animal 3 days after the treatment. (A-B) are ventral views. (C) Graph depicting the quantification of DjMap1B expression level. Each bar represents the mean value ± standard deviation of the mean gray values quantified in ten independent samples of a representative experiment. d (days). ns: not significant (p>0.05). (D) Representative images of DjNB-21.11 expression in a control animal and (E) 30 Gy irradiated animal 3 days after treatment. DjNB-21.11 is an early stem cell progeny marker and its expression is reduced after X-ray treatment. (F) Representative images of DjMCM2 expression in a control animal and (G) 30 Gy irradiated animal 3 days after treatment. DjMCM2 is a neoblast marker and its expression is strongly reduced very soon after irradiation. (D-G) are dorsal views. Scale bar is 500 μm in A, B, D-G.
Fig 2
Fig 2. Analysis of regenerating blastema in DjMap1B-silenced animals.
(A) Schematic drawing of the amputation level producing a head fragment and a tail fragment. (B) A representative head fragment of a control animal and (C) RNAi animal 3 days after amputation. (D) Representative tail fragment of a control animal and (E) RNAi animal 3 days after amputation. (B-E) are dorsal view. (F) Graph depicting the quantification of blastema size. Each bar is the mean ± standard deviation of 15 independent samples of a representative experiment. ****p<0.0001. (G) Representative electron micrograph of the regenerating area of a DjMap1B-silenced (RNAi) animal and (I) a control 3 days after amputation showing some neoblasts (asterisks). (H, J) Magnification of the cells indicated by the black arrowheads in G and I showing morphological features of neoblasts. d (days). Scale bar is 500 μm in A-D, 2 μm in G and I, and 800 nm in H and J.
Fig 3
Fig 3. Analysis of proliferating cells in DjMap1B-silenced animals.
(A) Representative confocal image of H3P-positive cells (green dots) in a control regenerating head fragment and (B) in a DjMap1B silenced regenerating head fragment (RNAi) 3 days after amputation. (C) Representative confocal image of H3P-positive cells (green dots) in a control regenerating tail fragment and (D) DjMap1B silenced regenerating tail fragment (RNAi) 3 days after amputation. (E) Representative image depicting BrdU-positive cells 3 days after amputation and 1 day after BrdU injection. (F). The same cells in E were stained with Hoechst 33352 blue nuclear staining. (G) Graph depicting the quantification of H3P-expressing cells in control and RNAi regenerating fragments 3 days after amputation. Each bar is the mean ± standard deviation of 5 independent samples of a representative experiment, ns: not significant (p>0.05). (H) Graph illustrating the quantification of BrdU-expressing cells 3 days after amputation and 1 day after BrdU injection. Each bar is the mean ± standard deviation of 5 independent samples of a representative experiment, ns: not significant (p>0.05). (I) Representative plot depicting the distribution in the cell cycle of cells obtained from control animals and (J) DjMap1B-silenced animals (RNAi) 3 days after amputation. Red: G1-phase cells; black: S-phase cells; green: G2-phase cells; blue: M-phase cells. (K-L) Graph depicting the percentage of cells in the different phases of the cell cycle. Each bar is the mean ± standard deviation of 5 independent samples of a representative experiment. ns: not significant (p>0.05). d (days); h (hours). Scale bar is 500 μm in A-D and 10 μm in G.
Fig 4
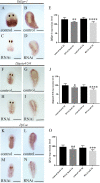
Fig 4. Analysis of marker expression for committed neoblasts in DjMap1B silenced animals by WISH 3 days after amputation.
(A) Representative images of DjEgr-1 expression in a regenerating control head and (B) tail fragment. (C) Representative images of DjEgr-1 expression in a regenerating DjMap1B-silenced animals (RNAi) head and (D) tail fragment. (A-D) are dorsal view. (E) Graph depicting the quantification of DjEgr-1 expression level. (F) Representative images of Djgata4/5/6 expression in a regenerating control head and (G) tail fragment. (H) Representative images of Djgata4/5/6 expression in a regenerating DjMap1B-silenced animals (RNAi) head and (I) tail fragment. (F-I) are dorsal view. (J) Graph depicting the quantification of Djgata4/5/6 expression level. (K) Representative images of DjCoe expression in regenerating control head and (L) tail fragment. (M) Representative images of DjCoe expression in regenerating DjMap1B-silenced animals (RNAi) head and (N) tail fragment. (K-N) are dorsal view. (O) Graph depicting the quantification of DjCoe expression level. Each bar (E, J, O) represents the mean value ± standard deviation of the mean gray values quantified in 10 independent samples of a representative experiment. Scale bar is 500 μm in A-D, F-I, K-N. *p<0.05; **p<0.005; ***p<0.0005; ****p< 0.0001.
Fig 5
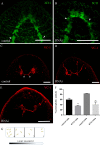
Fig 5. Analysis of apoptosis, by TUNEL assay, in DjMap1B silenced animals.
In A, B, C data were collected 3 hours after cutting, a time at which apoptotic cells (red dots) are accumulated below the wound epithelium. (A) A representative confocal image of a regenerating control tail fragment. (B) A representative confocal image of a regenerating RNAi tail fragment. (C) Graph depicting the quantification of the number of apoptotic cells. In D, E, F data were collected 3 days after cutting, a time at which apoptotic cells are scattered throughout the parenchyma. (D) A representative confocal image of a regenerating control tail fragment showing cells in apoptosis (red dots). (E) A representative confocal image of a regenerating RNAi tail fragment. (F) Graph depicting the quantification of the number of apoptotic cells. Each bar (C and F) is the mean ± standard deviation of 5 independent samples of a representative experiment. h (hours); d (days). *p<0.05. Scale bar is 100 μm in A-D.
Fig 6
Fig 6. Analysis of the nervous system in DjMap1B-silenced animals.
(A) Representative confocal images of 3C11 expression in a control head fragment and (B) DjMap1B-silenced (RNAi) head fragment 7 days after amputation. Cephalic ganglia with U-inverted shapes are indicated by arrowheads. (C) Representative confocal images of VC-1 distribution in a control tail fragment and (D, E) in DjMap1B silenced (RNAi) tail fragment 7 days after amputation. Asterisks indicate the medial region of the brain where visual neurons projected from the optic chiasm. (F) Graph depicting the percentage of photophobic intact animals when exposed to cyano light. Each bar is the mean ± standard deviation of 10 independent samples of a representative experiment. min (minutes). Scale bar is 25 μm in A, B and E and 50 μm in C, D. (G) Drawing of the experimental chamber used for behavioral experiments, with cyano light scattering from the right side. The brightest quadrant is number 1; the darkest quadrant is number 4. **p<0.005.

References

    1. Alessandra S & Rossi L (2019) Planarian stem cell heterogeneity. In Adv Exp Med Biol 1123, 39–54, doi: 10.1007/978-3-030-11096-3_4 - DOI - PubMed
    1. Gambino G, Rossi L & Salvetti A (2022) Planarian stem cells: pluripotency maintenance and fate determination. In Advances in Aquatic Invertebrate Stem Cell Research From Basic Research to Innovative Application, 221–241. MDPI, Basel, Switzerland, doi: 10.3390/books978-3-0365-1635-6-6 - DOI
    1. Ballarin L, Karahan A, Salvetti A, Rossi L, Manni L, Rinkevich B, et al.. (2021) Stem cells and innate immunity in aquatic invertebrates: bridging two seemingly disparate disciplines for new discoveries in biology. Front Immunol 12, 688106, doi: 10.3389/fimmu.2021.688106 - DOI - PMC - PubMed
    1. Wagner DE, Wang IE & Reddien PW (2011) Clonogenic neoblasts are pluripotent adult stem cells that underlie planarian regeneration. Science 332, 811–816, doi: 10.1126/science.1203983 - DOI - PMC - PubMed
    1. Razz AA, Wurtzel O & Reddien PW (2021) Planarian stem cells specify fate yet retain potency during the cell cycle. Cell Stem Cell 28, 1307-1322.e5, doi: 10.1016/j.stem.2021.03.021 - DOI - PMC - PubMed

Substances