. 2022 Dec 12;18(12):e1010407.
doi: 10.1371/journal.pgen.1010407. eCollection 2022 Dec.

Rad51-mediated interhomolog recombination during budding yeast meiosis is promoted by the meiotic recombination checkpoint and the conserved Pif1 helicase

Affiliations

Rad51-mediated interhomolog recombination during budding yeast meiosis is promoted by the meiotic recombination checkpoint and the conserved Pif1 helicase

Andrew Ziesel et al. PLoS Genet. .

Abstract

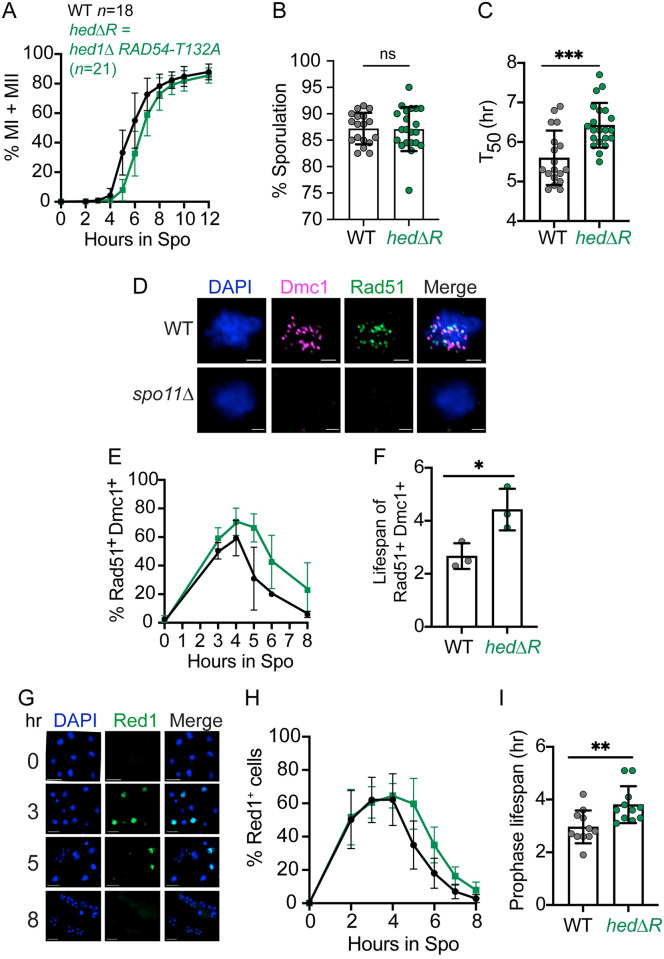
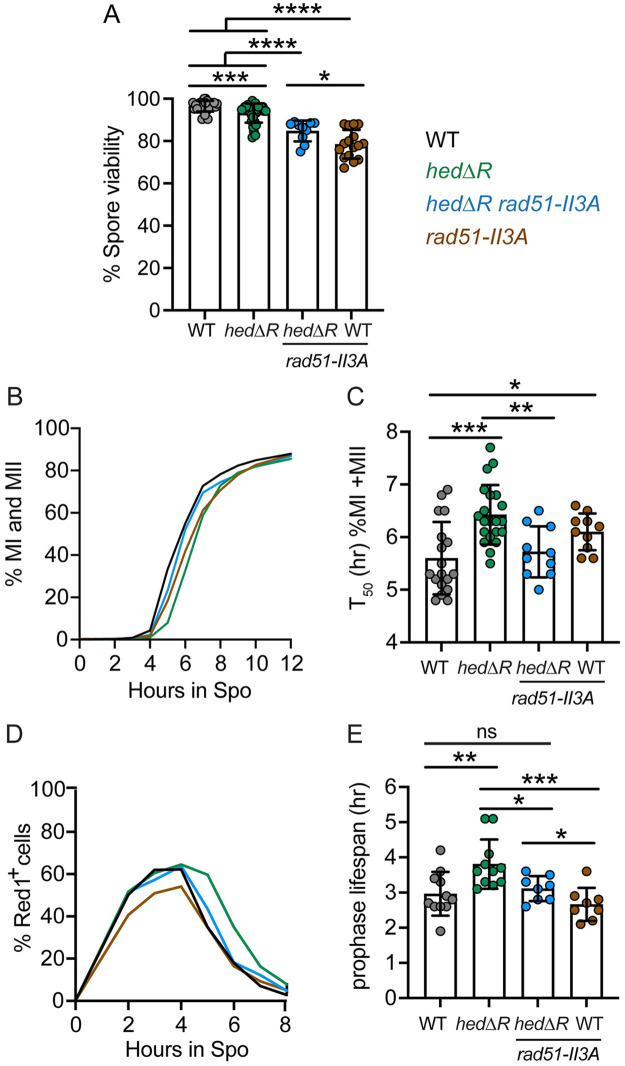
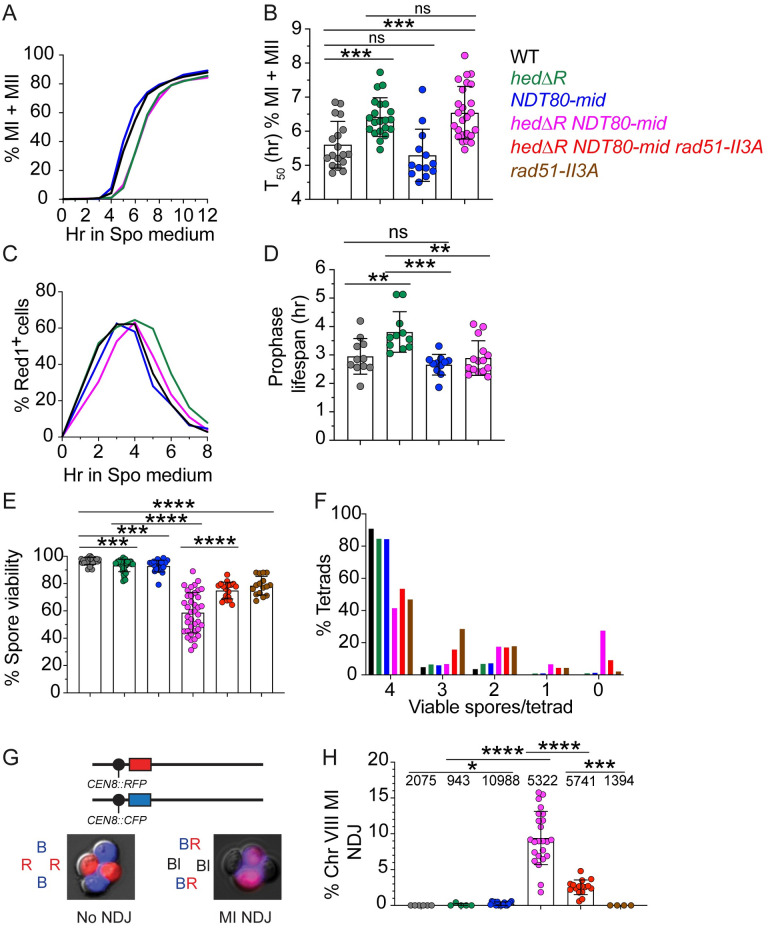
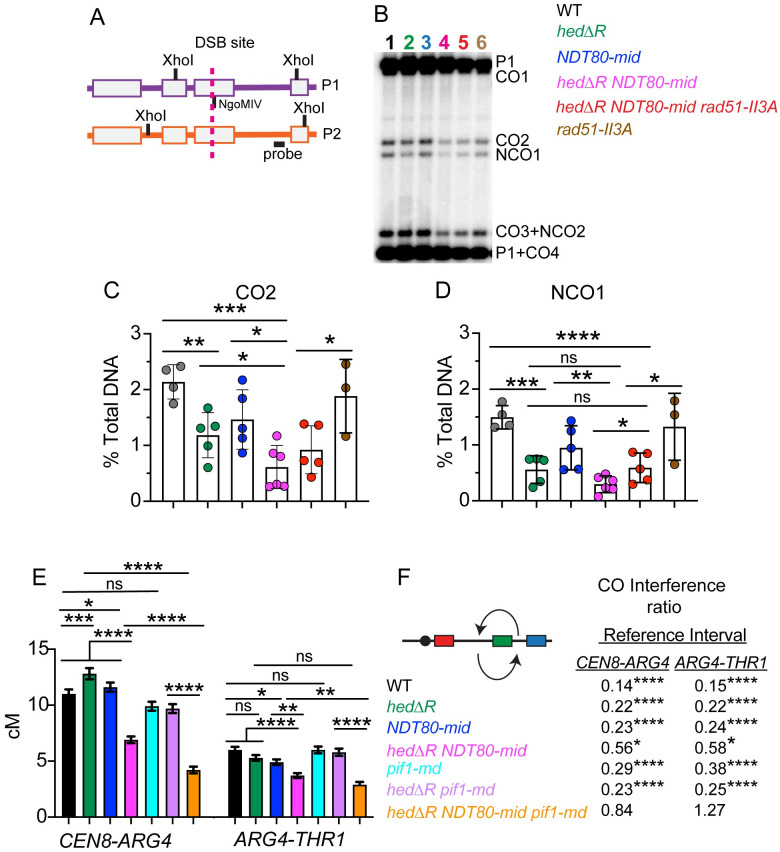
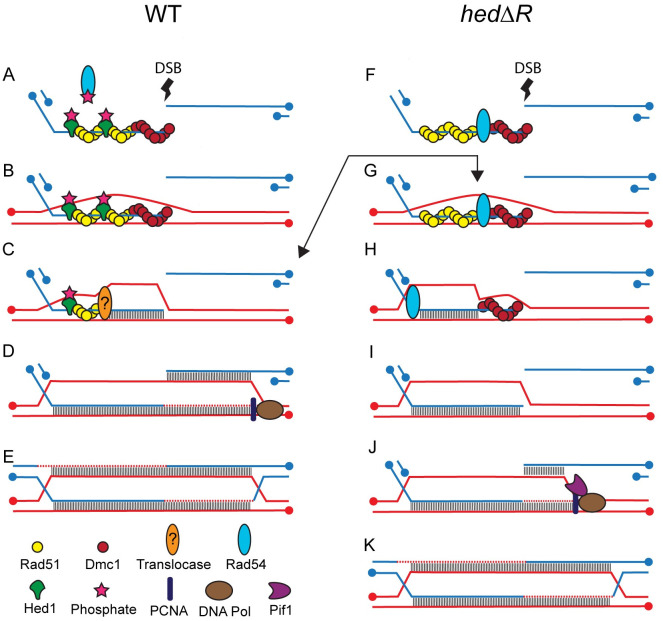
During meiosis, recombination between homologous chromosomes (homologs) generates crossovers that promote proper segregation at the first meiotic division. Recombination is initiated by Spo11-catalyzed DNA double strand breaks (DSBs). 5' end resection of the DSBs creates 3' single strand tails that two recombinases, Rad51 and Dmc1, bind to form presynaptic filaments that search for homology, mediate strand invasion and generate displacement loops (D-loops). D-loop processing then forms crossover and non-crossover recombinants. Meiotic recombination occurs in two temporally distinct phases. During Phase 1, Rad51 is inhibited and Dmc1 mediates the interhomolog recombination that promotes homolog synapsis. In Phase 2, Rad51 becomes active and functions with Rad54 to repair residual DSBs, making increasing use of sister chromatids. The transition from Phase 1 to Phase 2 is controlled by the meiotic recombination checkpoint through the meiosis-specific effector kinase Mek1. This work shows that constitutive activation of Rad51 in Phase 1 results in a subset of DSBs being repaired by a Rad51-mediated interhomolog recombination pathway that is distinct from that of Dmc1. Strand invasion intermediates generated by Rad51 require more time to be processed into recombinants, resulting in a meiotic recombination checkpoint delay in prophase I. Without the checkpoint, Rad51-generated intermediates are more likely to involve a sister chromatid, thereby increasing Meiosis I chromosome nondisjunction. This Rad51 interhomolog recombination pathway is specifically promoted by the conserved 5'-3' helicase PIF1 and its paralog, RRM3 and requires Pif1 helicase activity and its interaction with PCNA. This work demonstrates that (1) inhibition of Rad51 during Phase 1 is important to prevent competition with Dmc1 for DSB repair, (2) Rad51-mediated meiotic recombination intermediates are initially processed differently than those made by Dmc1, and (3) the meiotic recombination checkpoint provides time during prophase 1 for processing of Rad51-generated recombination intermediates.


Conflict of interest statement

The authors have declared that no competing interests exist.

Figures

Fig 1
Fig 1. Rad51 activation during Phase 1 causes a delay in meiotic progression, DSB disappearance and prophase I exit.
(A) Meiotic progression. WT (NH716 or NH2598 RCEN) (n = 18) and hedΔR (NH2528 or NH2616 RCEN) (n = 21) diploids were transferred to Spo medium. At the indicated timepoints cells were fixed, stained with 4′,6-diamidino-2-phenylindole (DAPI) and examined by fluorescent microscopy for the presence of binucleate (MI) or tetranucleate (MII) cells. The average values from different timecourses were plotted for each time point. At least 200 cells were counted for each timepoint. (B) Sporulation. Cells were examined by light microscopy for the presence of asci containing one to four spores. For each biological replicate, 200 cells were counted. (C) Quantification of meiotic progression timing. T50 represents the amount of time (hr) it took for a sporulation culture from Panel A to reach one-half its maximum %MI+MII value. (D) Cytological assay for the presence of DSBs. Representative images of chromosome spreads generated from WT (NH716) and spo11Δ (NH1055) cells taken after four hours in Spo medium. DNA was visualized with DAPI and antibodies against Rad51 and Dmc1 were used to detect the presence of DSBs. Scale bar is 2 μm. (E) Quantification of percent cells exhibiting at least three Dmc1 and Rad51 foci. Chromosome spreads of WT (n = 3), and hedΔR (n = 3) diploids from a subset of the replicates shown in Panel A were analyzed for the presence of Rad51 and Dmc1 foci at various timepoints. Nuclei containing a minimum of three Rad51 and three Dmc1 foci were scored as positive. At least 120 nuclei were examined for each timepoint. (F) Lifespan of cells exhibiting both Rad51 and Dmc1 foci. Each time course from Panel E was graphed and the lifespan of Rad51/Dmc1 positive nuclei (hr) was calculated by dividing the area under each curve by the maximum number of cells that completed either MI or MII for the corresponding culture [113]. (G) Examples of Red1 whole cell immunofluorescence in a WT meiotic time course. Scale bar is 2 μm. (H) Prophase I progression. Whole fixed cells from a subset of the replicates shown in Panel A (WT and hedΔR, n = 11) were assayed for the presence of Red1 by immunofluorescence and the average values were plotted. At least 200 cells were counted for each timepoint. (I) Quantification of prophase I length. Prophase I lifespan for each sporulation culture included in Panel H was calculated as described for Panel F. For all bar graphs, each dot represents a biological replicate, the height of the bar indicates the average, and the error bars indicate standard deviation. For all line graphs, error bars indicate standard deviation. Data were analyzed for statistical significance using an unpaired, two-tailed Student T-test. (* = p < .05; ** = p < .01; *** = p < .001)
Fig 2
Fig 2. Constitutive activation of Rad51 during meiosis delays prophase I exit.
(A) Spore viability. WT (NH716 or NH2598 RCEN), hedΔR (NH2528 or NH2616 RCEN), hedΔR rad51-II3A (NH2566) and rad51-II3A (NH2618 or NH2666 RCEN) tetrads from both liquid and solid sporulation conditions were dissected to determine the percent of viable spores. For each replicate, at least 18 tetrads were dissected. (B) Meiotic progression. Timecourses of the WT, hedΔR, hedΔR rad51-II3A (n = 10) and rad51-II3A (n = 10) were analyzed for meiotic progression as described in Fig 1. The average of all replicates is plotted. (C) Comparison of T50 values of the individual timecourses shown in Panel B. (D) Prophase I progression. A subset of timecourses in panel A (WT and hedΔR, n = 11, rad51-II3A and hedΔR rad51-II3A, n = 8) were analyzed for prophase I progression as described in Fig 1. The average of all replicates is plotted. (E) Prophase I lifespan for each sporulation culture in Panel D was calculated as described in Fig 1. The data for WT and hedΔR used for Panels B and D are the same as shown in Fig 1. The statistical significance of differences between strains in Panel A was determined using the Mann-Whitney test, while Panels C and E used an unpaired, two-tailed Student’s T-test. (* = p < .05; ** = p < .01; *** = p < .001, **** = p < .0001).
Fig 3
Fig 3. Elimination of the MRC rescues the prophase I delay due to constitutive Rad51 activation, while decreasing spore viability and increasing MI nondisjunction.
(A) Meiotic progression. Timecourses of the following diploids were analyzed for meiotic progression as described in Fig 1: WT, hedΔR, NDT80-mid (NH2495 or NH2634 RCEN) (n = 13) and hedΔR NDT80-mid (NH2505 or NH2610 RCEN) (n = 25). The average of all replicates is plotted. (B) Comparison of T50 values of timecourses shown in Panel A. (C) Prophase I progression. A subset of timecourses in panel A (NDT80-mid, n = 11, hedΔR NDT80-mid, n = 15) were analyzed for prophase I progression as described in Fig 1. WT and hedΔR data are from Fig 1. The average of all replicates is plotted. (D) Prophase I lifespan for each sporulation culture in Panel C was calculated as described in Fig 1. (E) Spore viability. Sporulated cells from both liquid and solid sporulation media were dissected to determine the percent of viable spores. At least 20 tetrads were dissected for each replicate. In addition to the diploids listed for Panel A, hedΔR NDT80-mid rad51-II3A (NH2705 RCEN) and rad51-II3A were included. (F) The distribution of viable spores among tetrads dissected in Panel E. (G) Schematic of the chromosome VIII homologs used to monitor nondisjunction. The tetrad on the left is an example of normal chromosome VIII segregation while MI nondisjunction (NDJ) occurred in the tetrad on the right. B = blue, R = red, Bl = black. (H) Frequency of chromosome VIII MI nondisjunction. Numbers above each bar indicate the total number of tetrads assayed. Panels A-E for WT, hedΔR, and rad51-II3A used the same data shown in Figs 1 and 2. The statistical significance of differences between strains in Panels B and D was determined using an unpaired, two-tailed Student’s T-test, while the Mann-Whitney test was used for Panels E and H. (* = p < .05; ** = p < .01; *** = p < .001, **** = p < .0001)
Fig 4
Fig 4. Physical and genetic analysis of recombination in various mutants.
(A) Physical analysis of recombination. Schematic of the HIS4LEU2 hotspot. The dotted line indicates the position of the DSB which is flanked by XhoI restriction sites. The NgoMIV site near the DSB site is also shown. (B) Cultures generated from independent single colonies of WT (NH716 and NS2598 RCEN), hedΔR (NH2528 and NH2H2616 RCEN), NDT80-mid (NH2634 RCEN), hedΔR NDT80-mid (NH2505 and NH2610), hedΔR NDT80-mid rad51-II3A (NH2705 RCEN) and rad51-II3A (NH2666 RCEN) were incubated for 10 hours in Spo medium. DNA was isolated, digested with XhoI and NgoMIV and crossovers and noncrossovers were analyzed by Southern blot as described in [123]. A representative gel of an individual culture from each strain is shown. P1 and P2 represent the parental homologs. NCO1 and CO2 represent unambiguous non-crossover and crossover bands. The numbers for each lane are colored coded with the indicated strains in the legend. (C) Quantification of CO2 after 10 hours in Spo medium. (D) Quantification of NCO1 after 10 hours in Spo medium. The statistical significance of differences between strains in Panels C and D was determined using an unpaired, two-tailed Student’s T-test. (* = p < .05; ** = p < .01; *** = p < .001, **** = p < .0001). (E) Genetic analysis of crossover formation. Single colonies from WT (NH2598 RGC) (n = 7; tetrads = 3374), hedΔR (NH2616 RGC) (n = 7; tetrads = 3812), NDT80-mid (NH2634 RGC) (n = 7; tetrads = 3592), hedΔR NDT80-mid (NH2610 RGC) (n = 8; tetrads = 3899), pif1-md (NH2695 RGC)(n = 7; tetrads scored = 2974), hedΔR pif1-md (NH2702 RGC)(n = 6; tetrads = 2799) and hedΔR NDT80-mid pif1-md (NH2687 RGC)(n = 8; tetrads = 2605) were sporulated on solid medium and analyzed by fluorescence microscopy for crossovers in the CEN8-ARG4 and ARG4-THR1 intervals (S3 Fig). Error bars show standard error. Since MI nondisjunction and nonparental ditype tetrads are indistinguishable in the CEN8-ARG4 interval (S3 Fig), the frequency of nonparental ditypes was corrected using the MI nondisjunction frequency for hedΔR and NDT80-mid. No correction was necessary for WT because MI nondisjunction was not observed. All CEN8-ARG4 NPDs were assumed to be due to MI nondisjunction in strains with Chromosome VIII MI nondisjunction frequencies ≥ 9% (Fig 3H) [122]. Map distances (cM) and standard errors were calculated using the Stahl lab online tools (https://elizabethhousworth.com/StahlLabOnlineTools/). (F) Crossover interference ratios between the CEN8-ARG4 and ARG4-THR1 intervals were determined using the method described by Malkova, Swanson [124]. Arrows above and below the chromosome VIII diagram indicate ARG4-THR1 and CEN8-ARG4 as the reference interval, respectively. Test interval/Reference interval map distance ratios significantly less than one are indicative of interference and p values are indicated by asterisks (*<0.05; ****<0.0001) (G-test).
Fig 5
Fig 5. The meiotic recombination checkpoint promotes Rad51-mediated dHJ formation.
(A) Excerpts of representative two-dimensional gel Southern blot analyses at the time of maximum joint molecule levels in WT, hedΔR, NDT80-mid, hedΔR NDT80-mid, pif1-md, and hedΔR NDT80-mid pif1-md. Right panels show enlarged excerpts of left panels. Interhomolog dHJs (black arrow), intersister dHJs (red arrows), interhomolog and intersister SEIs (black lines). (B) Quantitative analysis of effects of hedΔR and NDT80-mid on IH-dHJs (left) and IS-dHJs (right; time course tc17-1). Joint molecule (JM) levels are expressed as fraction of the maximum IH-dHJ levels in the parallel WT culture (black; here 1.7% of total hybridization signal). (C) Quantitative analysis of effects of pif1-md in the WT, hedΔR and hedΔR NDT80-mid backgrounds on IH-HJs (left) and IS-dHJs (right; tc14). JM levels are expressed as fraction of the maximum IH-dHJ levels in the parallel WT culture (black), here 1.0% of total hybridization signal.
Fig 6
Fig 6. The meiotic recombination checkpoint uncouples prophase I length from spore viability and MI chromosome segregation when Rad51 is constitutively activated.
(A) Spore viability was plotted versus prophase I length for WT (n = 12), hedΔR (n = 11), hedΔR rad51-II3A (n = 8), NDT80-mid (n = 11), hedΔR NDT80-mid (n = 16) and hedΔR NDT80-mid rad51-II3A (n = 11). (B) Chromosome VIII MI nondisjunction was plotted versus prophase I length for hedΔR NDT80-mid and hedΔR NDT80-mid rad51-II3A, using the same replicates as in Panel A. These data are from the same timecourses shown in Figs 2 and 3. The correlation coefficient and statistical significance are indicated by “r” and “p”, respectively and were determined using GraphPad Prism 9.0.
Fig 7
Fig 7. Constitutive activation of Rad51 results in inefficient interhomolog strand invasion during meiosis.
The URA3-tel-ARG4 recombination interval showing the position of polymorphic markers (blue—wild type; red–polymorphisms) relative to the double-strand break centroid (DSB, green lightning bolt). ~85% of DSBs form between -49 and +63; all DSBs form between -148 and +164 (Ahuja et al., 2021). Flanking drug resistance inserts allow genetic scoring of crossing-over. For the analysis, DNA was isolated from the four spores of 159 tetrads from the hedΔR msh2Δ diploid, NH2700. Fragments containing the hotspot region were then amplified and sequenced in their entirety. (B) Gene conversion frequencies (tetrads with nonmendelian segregation (NMS) /total tetrads) for each polymorphic marker. Conversion frequencies in hedΔR are significantly less than in wild type (p < 0.0001, Wilcoxon matched-pairs signed rank test). Underlying data are in S2 Data, Sheet 4 and in [127]. (C) One-sided and two-sided hybrid DNA among noncrossovers (NCO) and crossovers (CO). Schematic—in one-sided events, one DSB end invades a homolog and primes DNA synthesis before disassembly and annealing, leading to hybrid DNA to one side of the DSB; in two-sided events, both ends invade a homolog and extend, leading to hybrid DNA on both sides of the DSB. Table—number of tetrads with one-sided and two-sided events, with fraction of tetrads of each type in parentheses. Individual events are illustrated in S4 Fig. More events are one-sided in hedΔR than in WT (55% and 37%, respectively; p = 0.02, Fisher’s exact test). Underlying data are in S2 Data, Sheet 5 and in [127]. (D) Template switching, expressed as fraction of non-mendelian segregation (NMS) half-tracts (interval from DSB to last converted marker) with the indicated number of template switches. hedΔR (green) has fewer template switches than WT (black; p = 0.02, chi-square test). Inset–fraction of tetrads with (filled) or without (clear) template switching (p = 0.003, chi-square test); C—crossovers, N—noncrossovers. Underlying data are in S2 Data, Sheets 6 and 7 and in [127]. (E) Length of gene conversion segments, which represent the stretch of DNA between the DSB and the end of a gene conversion tract if no template switching occurs, or, if template switching occurs, the stretch of DNA either between the DSB and a template switch or between two template switches. Median segment lengths are indicated below the X axis; red lines indicate lower, median, and upper quartiles. p values (Mann-Whitney test, two-tailed) for comparisons between hedΔR (green) and WT (black) are at the top of the plot. Underlying data are in S2 Data, Sheet 6 and in [127].
Fig 8
Fig 8. PIF1 and RRM3 promote homolog disjunction when Rad51 is constitutively activated in the absence of the meiotic recombination checkpoint.
(A) Spore viability. The data from WT, hedΔR, NDT80-mid and hedΔR NDT80-mid were taken from Fig 3E. Additional strains were pif1-md (NH2657 or NH2685 RCEN), rrm3Δ (NH2485::pRS3042 or NH2623 RCEN), pif1-md rrm3Δ (NH2671::pRS3042), hedΔR pif1-md (NH2691 or NH2702 RCEN), hedΔR rrm3Δ (NH2540 or NH2629 RCEN), hedΔR pif1-md rrm3Δ (NH2704), NDT80-mid pif1-md (NH2725), NDT80-mid rrm3Δ (NH2549), hedΔR NDT80-mid pif1-md (NH2661 or NH2687 RCEN), hedΔR NDT80-mid rrm3Δ (NH2596), and hedΔR NDT80-mid pif1-md rrm3Δ (NH2670). Sporulated cells from both liquid and solid sporulation media were dissected to determine the percent of viable spores. At least 20 tetrads were dissected for each replicate. (B) Suppression of hedΔR NDT80-mid pif1-md spore inviability by rad51-II3A (NH2741 RCEN). (C) Frequency of chromosome VIII nondisjunction during MI. The data for WT, hedΔR, NDT80-mid and hedΔR NDT80-mid were taken from Fig 3H. Additional strains used in Panel C were pif1-md (NH2685 RCEN), rrm3Δ (NH2623 RCEN), hedΔR pif1-md (NH2702 RCEN), hedΔR rrm3Δ (NH2629 RCEN), hedΔR NDT80-mid pif1-md (NH2687 RCEN), and hedΔR NDT80-mid rrm3Δ (NH2637 RCEN). Number of tetrads assayed: pif1-md (3168), rrm3Δ (1062), hedΔR pif1-md (1665), hedΔR rrm3Δ (900), hedΔR NDT80-mid pif1-md (1491) and hedΔR NDT80-mid rrm3Δ (1489). (D) Suppression of hedΔR NDT80-mid pif1-md Chromosome VIII MI nondisjunction by rad51-II3A (NH2741 RCEN). Number of tetrads assayed for hedΔR NDT80-mid pif1-md rad51-II3A (3469). (E) Steady state levels of different nuclear Pif1 proteins from the strains analyzed in Panel F. Immunoblots using protein extracts made from vegetative cells were probed with α-FLAG antibodies to detect Pif1-3FLAG. Arp7 was used as a loading control. A diploid carrying untagged pif1-m1 (pJW5-m1) was included as a control. The numbers at the bottom of each lane indicate the number of plasmids in each strain. The amount of protein was quantified and normalized to Arp7 and Pif1-m1-3FLAG using the equation. [Pif1-m1-X-3FLAG/Arp7]/[Pif1-m1-3FLAG/Arp7], where X indicates a mutation. Numbers above each lane indicate the average values for three independent replicates. (F) Complementation tests for different alleles of PIF1. The hedΔR NDT80-mid pif1-md diploid was transformed with the vector, pRS306 (v), one copy each of pJW14 (pif1-m1-3FLAG) and pJW14-R3E (pif1-m1-R3E-3FLAG), as well as two copies pJW14-K264A (pif1-m1-K264A-3FLAG). Transformants were sporulated on solid medium and at least 20 tetrads were dissected per transformant. The statistical significance of differences between strains was determined using the Mann-Whitney test (* = p < .05; ** = p < .01; *** = p < .001, **** = p < .0001).
Fig 9
Fig 9. Model for Rad51-mediated interhomolog crossovers during meiosis.
(A) Presynaptic filament shown for one side of a DSB in WT cells. Blue lines represent the duplex of one homolog while red lines represent a chromatid from the other homolog. Dots indicate the 5’ ends of the DNA. (B) Nascent D-loop or paranemic joint. (C) Conversion to a mature D-loop by removal of Dmc1 and heteroduplex formation between the invading strand and donor strand of opposite polarity. The question mark indicates that the mechanism for how this occurs is unknown. (D) Extension of the D-loop by DNA synthesis by Polδ-PCNA followed by second end capture. (E) Double Holliday junction. (F) Presynaptic filament shown for one side of a DSB in hedΔR cells with Rad54 interacting with Rad51. (G) Nascent D-loop or paranemic joint. (H) Internal D-loop created by Rad54 removal of Rad51 and heteroduplex formation between the invading strand and donor strand of opposite polarity. (I) Removal of Dmc1 from the 3’ end of the invading strand. (J) Pif1 interacts with PCNA to facilitate DNA synthesis by unwinding the duplex to extend the D-loop allowing second end capture. (K) Double Holliday junction. Not shown is the possibility that the extended ends could be disassembled to enable noncrossover formation by synthesis dependent strand annealing.

Similar articles

Cited by

References

    1. Petronczki M, Siomos MF, Nasmyth K. Un menage a quatre: the molecular biology of chromosome segregation in meiosis. Cell. 2003;112(4):423–40. - PubMed
    1. Hassold T, Hunt P. To err (meiotically) is human: the genesis of human aneuploidy. Nat Rev Genet. 2001;2(4):280–91. Epub 2001/04/03. doi: 10.1038/35066065 - DOI - PubMed
    1. Villeneuve AM, Hillers KJ. Whence meiosis? Cell. 2001;106(6):647–50. Epub 2001/09/27. doi: 10.1016/s0092-8674(01)00500-1 - DOI - PubMed
    1. Keeney S, Giroux CN, Kleckner N. Meiosis-specific DNA double-strand breaks are catalyzed by Spo11, a member of a widely conserved protein family. Cell. 1997;88(3):375–84. Epub 1997/02/07. doi: 10.1016/s0092-8674(00)81876-0 - DOI - PubMed
    1. Borde V, Goldman AS, Lichten M. Direct coupling between meiotic DNA replication and recombination initiation. Science. 2000;290(5492):806–9. doi: 10.1126/science.290.5492.806 - DOI - PubMed

Publication types

MeSH terms