. 2022 Dec 12;17(12):e0279017.
doi: 10.1371/journal.pone.0279017. eCollection 2022.

Comparison between relative and absolute quantitative real-time PCR applied to single-cell analyses: Transcriptional levels in a key neuron for long-term memory in the pond snail

Affiliations

Comparison between relative and absolute quantitative real-time PCR applied to single-cell analyses: Transcriptional levels in a key neuron for long-term memory in the pond snail

Dai Hatakeyama et al. PLoS One. .

Abstract

Quantitative real-time PCR (qPCR) is a powerful method for measuring nucleic acid levels and quantifying mRNA levels, even in single cells. In the present study, we compared the results of single-cell qPCR obtained by different quantification methods (relative and absolute) and different reverse transcription methods. In the experiments, we focused on the cerebral giant cell (CGC), a key neuron required for the acquisition of conditioned taste aversion in the pond snail Lymnaea stagnalis, and examined changes in the mRNA levels of 3 memory-related genes, cAMP-response element binding proteins (LymCREB1 and LymCREB2) and CREB-binding protein (LymCBP), during memory formation. The results obtained by relative quantification showed similar patterns for the 3 genes. For absolute quantification, reverse transcription was performed using 2 different methods: a mixture of oligo d(T) primers and random primers (RT method 1); and gene-specific primers (RT method 2). These methods yielded different results and did not show consistent changes related to conditioning. The mRNA levels in the samples prepared by RT method 2 were up to 3.3 times higher than those in samples prepared by RT method 1. These results suggest that for qPCR of single neurons, the efficacy and validity do not differ between relative and absolute quantification methods, but the reverse transcription step critically influences the results of mRNA quantification.


Conflict of interest statement

The authors have declared that no competing interests exist.

Figures
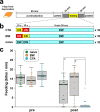
Fig 1
Fig 1. Conditioned taste aversion (CTA) training for Lymnaea.
(A) Diagram of the total procedure of CTA. (B) Procedures used for CTA training, backward (BW) training, and naïve control. CS: conditioned stimulus (10 mM sucrose solution), US: unconditioned stimulus (10 mM KCl solution). (C) Box-and-whisker plots show the learning and memory scores of CTA (i.e., number of bites to CS) examined at the pretest and posttests. Green, orange, and blue dots show naïve-control, BW-trained, and CTA-trained snails, respectively. The number of snails was at least 10 in each condition. *p < 0.05 by Holm’s post-hoc test.
Fig 2
Fig 2. Positions of primers and probes used in the experiments.
(A) LymCREB1 [GenBank Accession No.: AB041522], (B) LymCREB2 [AB083656], (C) LymCBP [AB217914], (D) Lym18S [Y09018], and (E) LymGAPDH [MH687363]. Fw-c: forward primer for cloning, Rv-c: reverse primer for cloning, RT: gene-specific primer for reverse transcription, Fw-q: forward primer for qPCR, Rv-q: reverse primer for qPCR, Pr: TaqMan probe. Numbers in parentheses indicate the corresponding primers and probes shown in Table 1. Numbers without parentheses indicate nucleotide numbers. ORF: open reading frame.
Fig 3
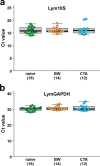
Fig 3. Variation in Ct values of the 2 reference genes used for relative quantification.
(A) Lym18S, and (B) LymGAPDH. Green, orange, and blue dots show naïve-control (n = 16), BW-trained (n = 14), and CTA-trained snails (n = 12), respectively. Data are expressed as mean ± SEM.
Fig 4
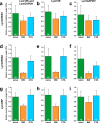
Fig 4. Comparison of reference genes for qPCR.
Results of relative quantification of LymCREB1 (A-C), LymCREB2 (D-F), and LymCBP (G-I) mRNA levels. Two reference genes (A, D, G: with Lym18S and LymGAPDH) or a single reference gene (B, E, H: with Lym18S; C, F, I: with LymGAPDH) were used for normalizing the expression levels. Green, orange, and blue bars show naïve-control, BW-trained, and CTA-trained snails, respectively. Data are expressed as mean ± SEM. The number of samples is indicated at the bottom of the bar graph.
Fig 5
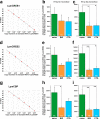
Fig 5. Results of absolute quantification of LymCREB1, LymCREB2 and LymCBP mRNA levels.
Standard curves of LymCREB1 (A), LymCREB2 (D), and LymCBP (G). The mRNA levels in the CGCs reverse-transcribed with the mixture of oligo d(T) and random primer (B, E, H) or gene-specific primers (C, F, I). Green, orange, and blue bars show naïve-control, BW-trained, and CTA-trained snails, respectively. Quantification data are expressed as mean ± SEM. The results were analyzed using 1-way ANOVA followed by Tukey’s post-hoc test (*p < 0.05, **p < 0.01). The number of samples is indicated at the bottom of the bar graph.
Fig 6
Fig 6. Ratio of LymCREB1 mRNA/LymCREB2 mRNA in a single isolated CGC.
The data were obtained by absolute quantification with samples reverse-transcribed by RT method 1 (A) and RT method 2 (B). Green, orange, and blue bars show naïve-control, BW-trained, and CTA-trained snails, respectively. Data are expressed as mean ± SEM. p-values of 1-way ANOVA are 0.61 (A) and 0.15 (B). The number of samples is indicated at the bottom of the bar graph.
Fig 7
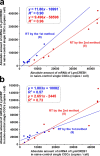
Fig 7
Linear regression analyses to evaluate the relationship between mRNA levels of LymCREB1 (X axis) and LymCREB2 [Y axis in (A)] and LymCBP [Y axis in (B)] calculated by absolute quantification. The red dots and lines indicate samples prepared by RT method 1 and the blue dots and lines indicate samples prepared by RT method 2. The number of samples was 8 for each group. Equation and coefficient of determination (R2 values) of lines are shown in insets. Slopes and F-test results are summarized in Table 3. Statistical analyses suggested that the 2 regression lines are parallel in LymCREB2/LymCREB1 and LymCREB2/LymCBP [p = 0.404 (A); p = 0.726 (B)].

References

    1. Wong ML, Medrano JF. Real-time PCR for mRNA quantitation. BioTechnique. 2005; 39(1): 75‒85. doi: 10.2144/05391RV01 . - DOI - PubMed
    1. Hawkins SFC, Guest PC. Multiplex analyses using real-time quantitative PCR. Methods Mol Biol. 2017; 1546: 125‒133. doi: 10.1007/978-1-4939-6730-8_8 . - DOI - PubMed
    1. Sandri MT, Azzolini E, Torri V, Carloni S, Pozzi C, Salvatici M, et al.. SARS-CoV-2 serology in 4000 health care and administrative staff across seven sites in Lombardy, Italy. Sci Rep. 2021; 11(1): 12312. doi: 10.1038/s41598-021-91773-4 . - DOI - PMC - PubMed
    1. Mackay IM, Arden KE, Nitsche A. Real-time PCR in virology. Nucleic Acids Res. 2002; 30(6): 1292‒1305. doi: 10.1093/nar/30.6.1292 . - DOI - PMC - PubMed
    1. Kawakami E, Watanabe T, Fujii K, Goto H, Watanabe S, Noda T, et al.. Strand-specific real-time RT-PCR for distinguishing influenza vRNA, cRNA, and mRNA. J Virol Methods. 2011; 173(1): 1‒6. doi: 10.1016/j.jviromet.2010.12.014 . - DOI - PMC - PubMed

Publication types