. 2022 Dec 20;119(51):e2211775119.
doi: 10.1073/pnas.2211775119. Epub 2022 Dec 12.

Synthetical lethality of Werner helicase and mismatch repair deficiency is mediated by p53 and PUMA in colon cancer

Affiliations

Synthetical lethality of Werner helicase and mismatch repair deficiency is mediated by p53 and PUMA in colon cancer

Suisui Hao et al. Proc Natl Acad Sci U S A. .

Erratum in

Abstract

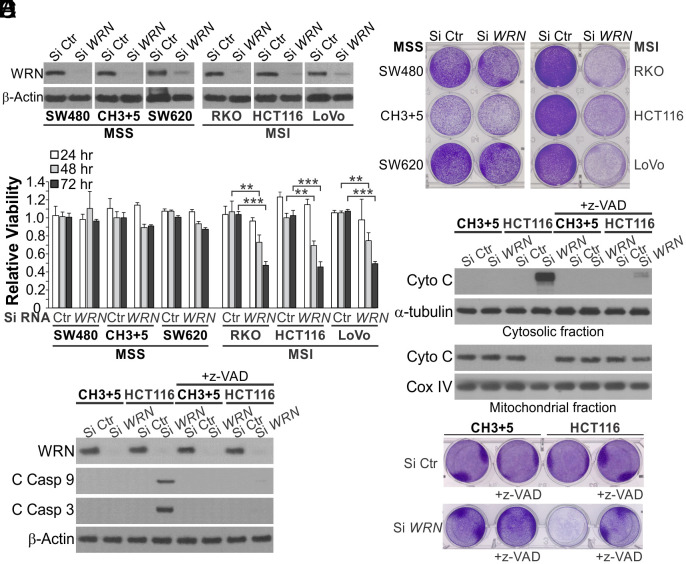
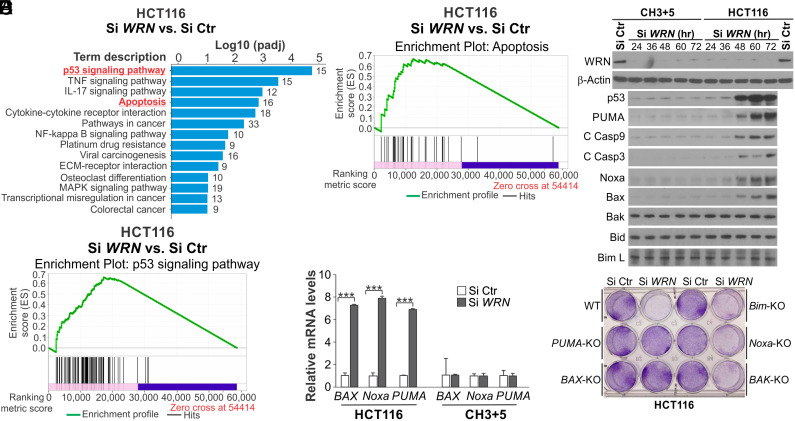
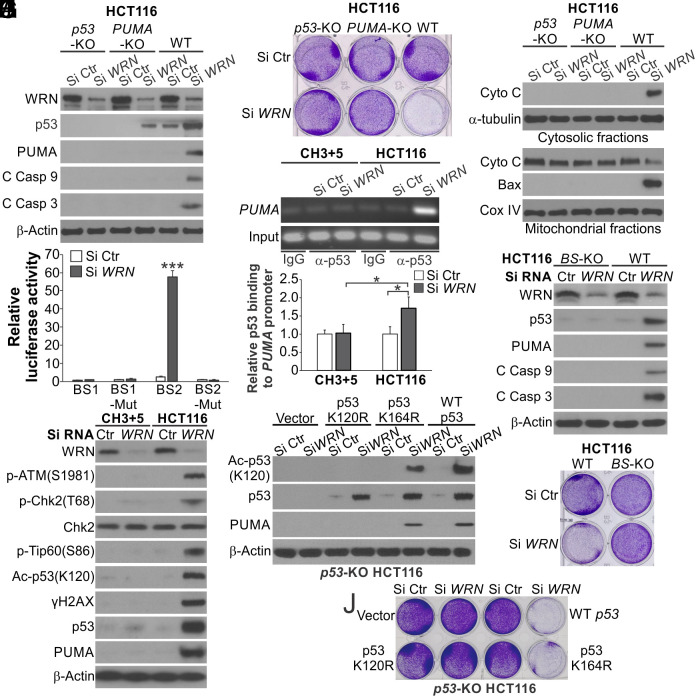
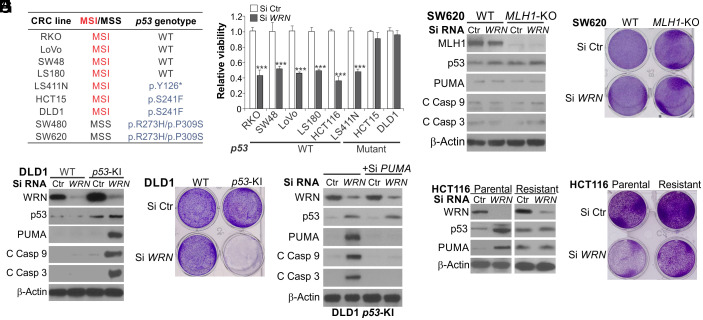
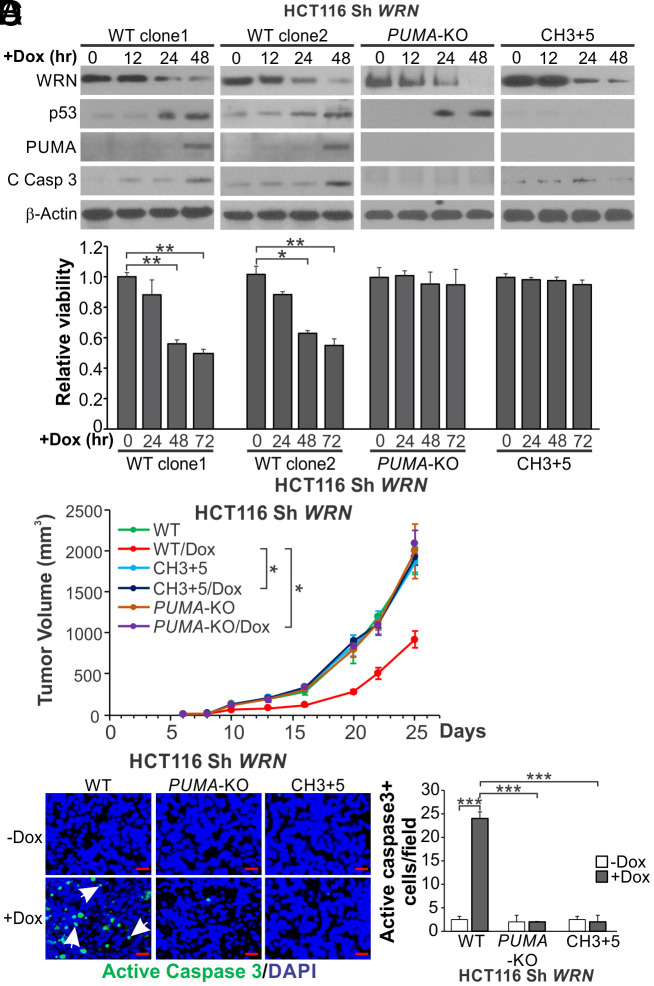
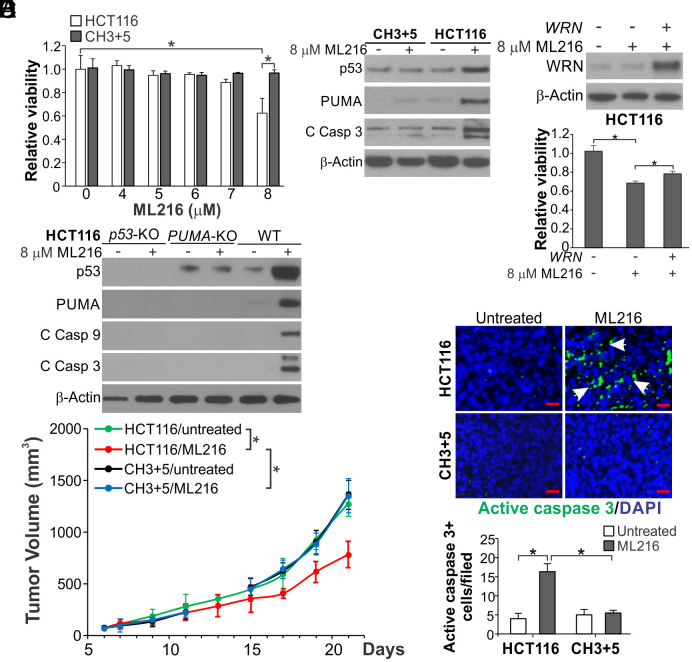
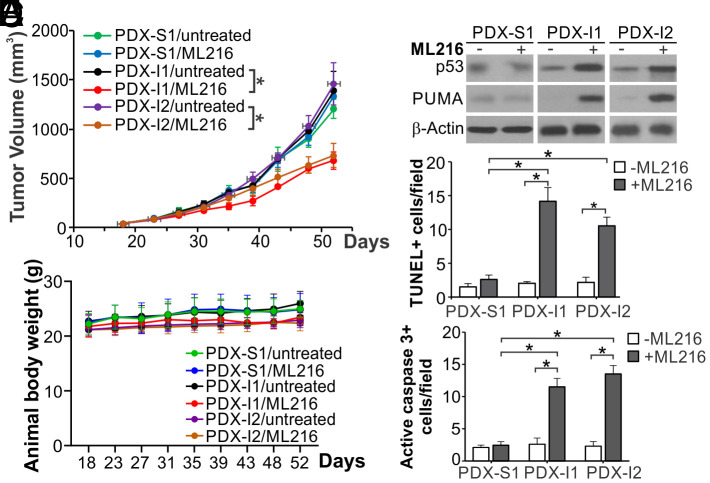
Synthetic lethality is a powerful approach for targeting oncogenic drivers in cancer. Recent studies revealed that cancer cells with microsatellite instability (MSI) require Werner (WRN) helicase for survival; however, the underlying mechanism remains unclear. In this study, we found that WRN depletion strongly induced p53 and its downstream apoptotic target PUMA in MSI colorectal cancer (CRC) cells. p53 or PUMA deletion abolished apoptosis induced by WRN depletion in MSI CRC cells. Importantly, correction of MSI abrogated the activation of p53/PUMA and cell killing, while induction of MSI led to sensitivity in isogenic CRC cells. Rare p53-mutant MSI CRC cells are resistant to WRN depletion due to lack of PUMA induction, which could be restored by wildtype (WT) p53 knock in or reconstitution. WRN depletion or treatment with the RecQ helicase inhibitor ML216 suppressed in vitro and in vivo growth of MSI CRCs in a p53/PUMA-dependent manner. ML216 treatment was efficacious in MSI CRC patient-derived xenografts. Interestingly, p53 gene remains WT in the majority of MSI CRCs. These results indicate a critical role of p53/PUMA-mediated apoptosis in the vulnerability of MSI CRCs to WRN loss, and support WRN as a promising therapeutic target in p53-WT MSI CRCs.

Keywords: PUMA; Werner; mismatch repair; p53; synthetic lethal.


Conflict of interest statement

The authors declare no competing interest.

Figures

Fig. 1.
Fig. 1.
Knockdown of WRN induces apoptosis in MSI but not MSS CRC cells. (A) Western blotting of WRN in indicated MSI and MSS CRC cell lines transfected with control scrambled (Si Ctr) or WRN (Si WRN) siRNA for 72 h. (B) MTS analysis of viability of indicated MSI and MSS cell lines transfected as in (A) for 24, 48 and 72 h. Results were expressed as mean ± SD of three independent experiments. **P < 0.01; ***P < 0.001. (C) Crystal violet staining of cell lines transfected as in (A) for 72 h. (DF) Parental and CH3+5 HCT116 cells with or without pretreatment with the pancaspase inhibitor z-VAD-fmk (z-VAD; 10 μM) for 4 h were transfected with Si Ctr or Si WRN for 72 h. (D) Western blotting of cytochrome c (Cyto C) in cytosolic and mitochondrial fractions isolated from transfected cells. Cytosolic α-tubulin and mitochondrial cyclooxygenase IV (Cox IV) were used as controls for loading and fractionation. (E) Western blotting of WRN and cleaved caspases (C Casp) 3 and 9. (F) Analysis of cell viability by crystal violet staining.
Fig. 2.
Fig. 2.
Knockdown of WRN induces p53 and its apoptosis targets in HCT116 cells. (AC) HCT116 cells transfected with Si Ctr or Si WRN for 36 h were analyzed by RNA-Seq. Gene expression was determined by calculating Fragments Per Kilobase of transcript per Million mapped reads, and differentially expressed genes were identified. (A) GSEA of most significantly up-regulated pathways with indicated Log P values. (B) GSEA of p53 pathway genes. (C) GSEA of apoptosis pathway genes. (D) Western blotting of indicated proteins in parental and CH3+5 HCT116 cells at indicated time points after Si WRN transfection. (E) Real-time RT-PCR analysis of BAX, Noxa, and PUMA mRNA expression in parental and CH3+5 HCT116 cells transfected as in (A) for 36 h. Results were expressed as mean ± SD of three independent experiments. ***P < 0.001. (F) Crystal violet staining of viable cells in WT, PUMA-KO, BAX-KO, Noxa-KO, BAK-KO, and Bim-KO HCT116 cells transfected with Si Ctr or Si WRN for 72 h.
Fig. 3.
Fig. 3.
p53 and PUMA are required for apoptosis induced by WRN KD in MSI CRC cells. (A) Western blotting of indicated proteins in WT, p53-KO and PUMA-KO HCT116 cells transfected with Si Ctr or Si WRN for 72 h. (B) Crystal violet staining of viable cells in cells transfected as in (A) for 72 h. (C) Western blotting of cytochrome c in cytosolic and mitochondrial fractions isolated from cells transfected with siRNA as in (A) for 72 h. (D) Luciferase reporters containing four copies of either the p53 binding site BS1 or BS2 or mutant versions of these sites were transfected into HCT116 cells for 36 h. Reporter activities were normalized to the luciferase/β-galactosidase ratio of the mutant reporter. (E) Chromatin immunoprecipitation (ChIP) analysis of the binding of p53 to the PUMA promoter in parental and CH3+5 HCT116 cells transfected with indicated siRNA for 36 h. ChIP was done using a p53 antibody for pull-down and anti-IgG as a negative control, followed by PCR analysis of the PUMA promoter region covering the p53 binding site. Upper, representative gel pictures of PCR products; Lower, quantification of p53 binding to the PUMA promoter by NIH ImageJ program. (F) Western blotting of indicated proteins in WT and PUMA p53 binding site knockout (BS-KO) HCT116 cells transfected with indicated siRNA for 72 h. (G) Crystal violet staining of WT and BS-KO HCT116 cells transfected as in (F) for 72 h. (H) Western blotting of indicated proteins in parental and CH3+5 HCT116 cells transfected with Si Ctr or Si WRN for 72 h. (I and J) p53-KO HCT116 cells were reconstituted with WT p53, K164R, or K120R mutant p53 by transfection. Cells transfected with Si Ctr or Si WRN for 72 h were analyzed by (I) Western blotting of indicated proteins and (J) crystal violet staining of viable cells. Bar graphs in (D and E) were expressed as mean ± SD of three independent experiments. *P < 0.05; ***P < 0.001.
Fig. 4.
Fig. 4.
WT p53 is required for WRN-KD-induced apoptosis in some MSI CRC cells. (A) MSI/MSS status and p53 genotypes of the listed CRC cell lines. (B) MTS analysis of viability of indicated MSI CRC cell lines transfected with Si Ctr or Si WRN for 72 h. Results were expressed as mean ± SD of three independent experiments. ***P < 0.001. (C and D) Parental and WT-p53-knockin (p53-KI) DLD1 cells were transfected with Si Ctr or Si WRN for 72 h and analyzed by (C) Western blotting of indicated proteins and (D) crystal violet staining of viable cells. (E) Western blotting of indicated proteins in p53-KI DLD1 cells transfected with Si Ctr or Si WRN for 72 h, with or without cotransfection with PUMA siRNA. (F and G) WT and MLH1-KO SW620 cells were transfected with Si Ctr or Si WRN for 72 h and analyzed by (F) Western blotting of indicated proteins and (G) crystal violet staining of viable cells. (H and I) HCT116 cells resistant to WRN knockdown were generated by continuously exposing parental HCT116 cells to Si WRN for 2 wk and expanding the remaining viable cells. Parental and resistant HCT116 cells were transfected with Si Ctr or Si WRN for 72 h and analyzed by (H) Western blotting of indicated proteins and (I) crystal violet staining of viable cells.
Fig. 5.
Fig. 5.
Inducible knockdown of WRN suppresses xenograft growth in a PUMA-dependent fashion. Parental (WT), CH3+5, and PUMA-KO HCT116 cells with Dox inducible expression of WRN short hairpin RNA (Sh WRN) were established as described in Materials and Methods. (A) Western blotting of indicated proteins in two independent clones of WT, CH3+5, and PUMA-KO Sh WRN HCT116 cells with induction of Sh WRN by Dox (0.2 μg/mL) treatment for indicated time. (B) MTS analysis of viability of indicated cells with induction of Sh WRN as in (A) at indicated time points. Results were expressed as mean ± SD of three independent experiments. (C and D) Nude mice were implanted with 2 × 10⁶ of WT (clone 1), CH3+5, or PUMA-KO Sh WRN HCT116 cells to establish xenograft tumors. Tumor bearing mice were randomized and treated with 18% Protein Rodent Diet +/− Dox hyclate (625 mg/kg). (C) Tumor volume at indicated time points after treatment was measured and plotted with P values for indicated comparisons (N = 6 in each group). (D) Tumor sections from mice treated as in (C) for 13 d were analyzed by immunostaining for active caspase 3 expression. Left, representative staining pictures with arrows indicating examples of positive signals (scale bars: 25 μm); Right, quantification of positive signals showing means ± SEM of each field in 3 fields per mouse (N = 3 in each group). *P < 0.05; **P < 0.01; ***P < 0.001.
Fig. 6.
Fig. 6.
ML216 inhibits MSI CRC xenograft growth via apoptosis induction. (A) MTS analysis of parental and CH3+5 HCT116 cells treated with ML216 at indicated concentrations for 72 h. (B) Western blotting of indicated proteins in parental and CH3+5 HCT116 cells treated with 8 μM ML216 for 72 h. (C) HCT116 cells in 12-well plate transfected with 0.2 μg/well control empty or WRN expression vector (pLX209-neo-active WRN) were treated with 8 μM ML216. Upper, Western blotting of WRN after transfection for 24 h; Lower, MTS analysis of viability of cells after ML216 treatment for 72 h. (D) Western blotting of indicated proteins in WT, p53-KO, and PUMA-KO HCT116 cells treated with 8 μM ML216 for 72 h. (E and F) Nude mice with established parental and CH3+5 HCT116 xenograft tumors were randomized and treated with control vehicle or ML216 (i.p; 1.5 mg/kg daily in first 7 d and every other day after day 7). (E) Tumor volume at indicated time points was calculated and plotted with P values for indicated comparisons (N = 6 in each group). (F) Tumor sections from mice treated for 13 d were analyzed for apoptosis by active caspase 3 staining. Upper, representative staining pictures (scale bars: 25 μm); Lower, quantification of positive signals showing means ± SEM of each field in 3 fields per mouse (N = 3 in each group). Bar in (A and C) were expressed as mean ± SD of three independent experiments. *P < 0.05.
Fig. 7.
Fig. 7.
ML216 suppresses MSI PDX tumor growth with apoptosis induction. NSG mice were subcutaneously implanted with three different PDX tumor models, including an MSS model (PDX-S1) and two MSI models (PDX-I1 and PDX-I2), and were treated with ML216 (i.p; 1.5 mg/kg daily in first 7 d and every other day after day 7). (A) Tumor volume at indicated time points after treatment was calculated and plotted with P values for indicated comparisons (N = 6 in each group). (B) Animal body weight at indicated time points. (C) Western blotting of p53 and PUMA in representative PDX tumors from mice treated as in (A). (D and E) Apoptosis was analyzed by (D) TUNEL and (E) active caspase 3 staining of tumor sections from mice treated as in (A) for 35 d. Quantification of positive signals is shown. Results were expressed as mean ± SEM of each field in 3 fields per mouse (N = 3 in each group). *P < 0.05.

Comment in

References

    1. Jiricny J., The multifaceted mismatch-repair system. Nat. Rev. Mol. Cell Biol. 7, 335–346 (2006). - PubMed
    1. Goellner E. M., Putnam C. D., Kolodner R. D., Exonuclease 1-dependent and independent mismatch repair. DNA Repair (Amst) 32, 24–32 (2015). - PMC - PubMed
    1. Boland C. R., Goel A., Microsatellite instability in colorectal cancer. Gastroenterology 138, 2073–2087 (2010). - PMC - PubMed
    1. Vogelstein B., et al. , Cancer genome landscapes. Science 339, 1546–1558 (2013). - PMC - PubMed
    1. Siegel R. L., Miller K. D., Fuchs H. E., Jemal A., Cancer statistics, 2021. CA Cancer J. Clin. 71, 7–33 (2021). - PubMed

Publication types

MeSH terms

Supplementary concepts