. 2023 Mar 30;141(13):1610-1625.
doi: 10.1182/blood.2021011094.

Erythroid/megakaryocytic differentiation confers BCL-XL dependency and venetoclax resistance in acute myeloid leukemia

Affiliations

Erythroid/megakaryocytic differentiation confers BCL-XL dependency and venetoclax resistance in acute myeloid leukemia

Heikki Kuusanmäki et al. Blood. .

Abstract

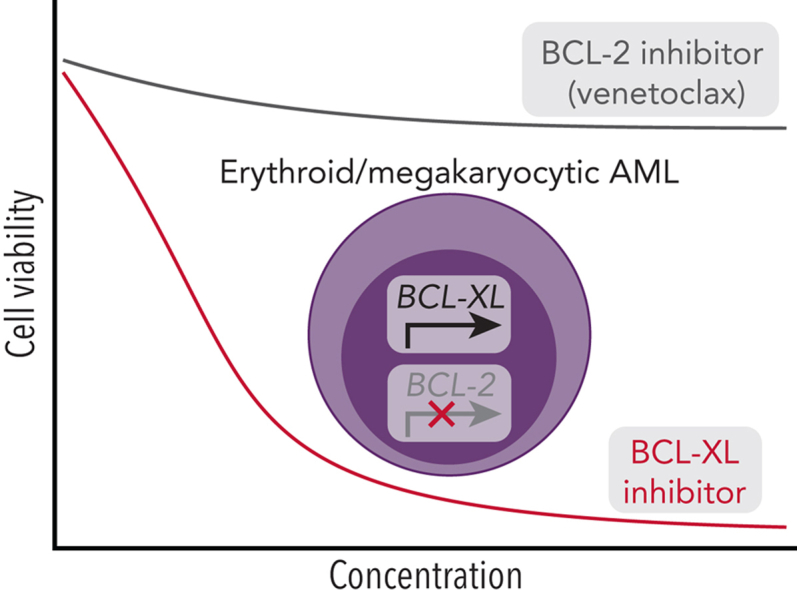
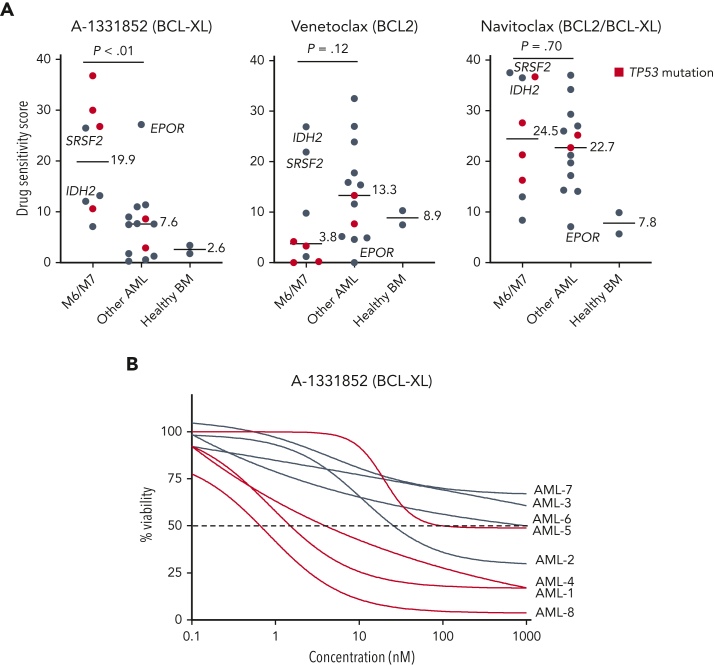
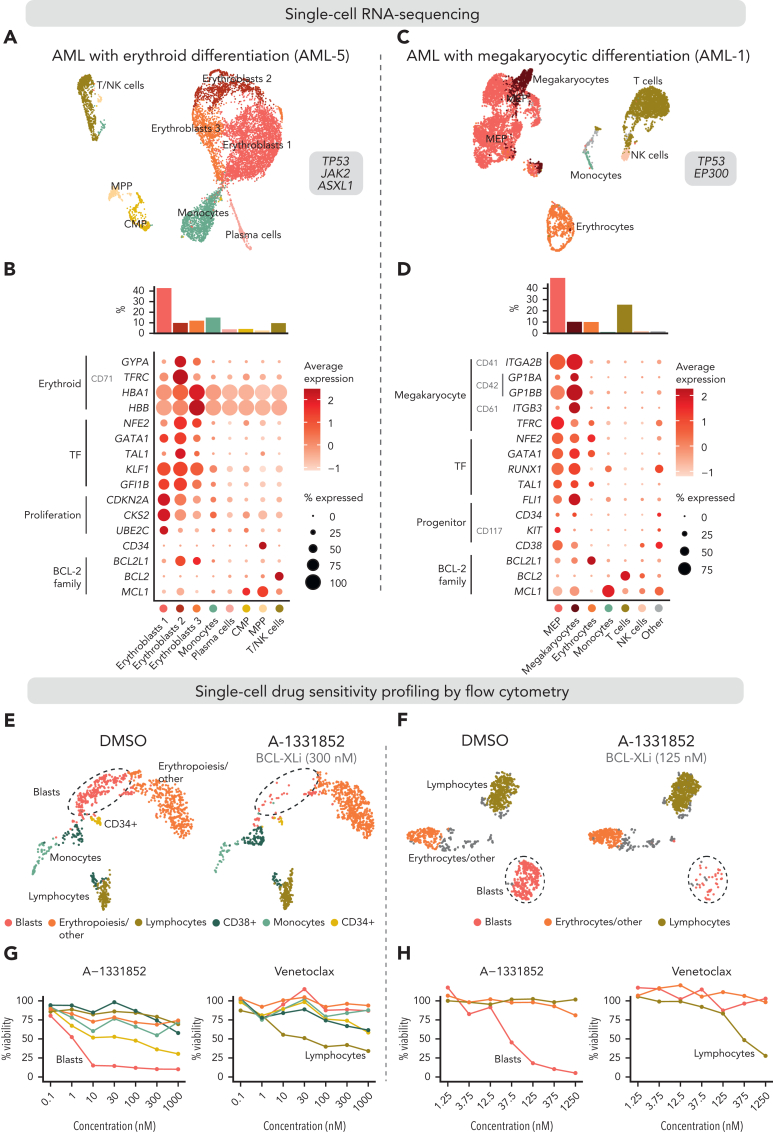
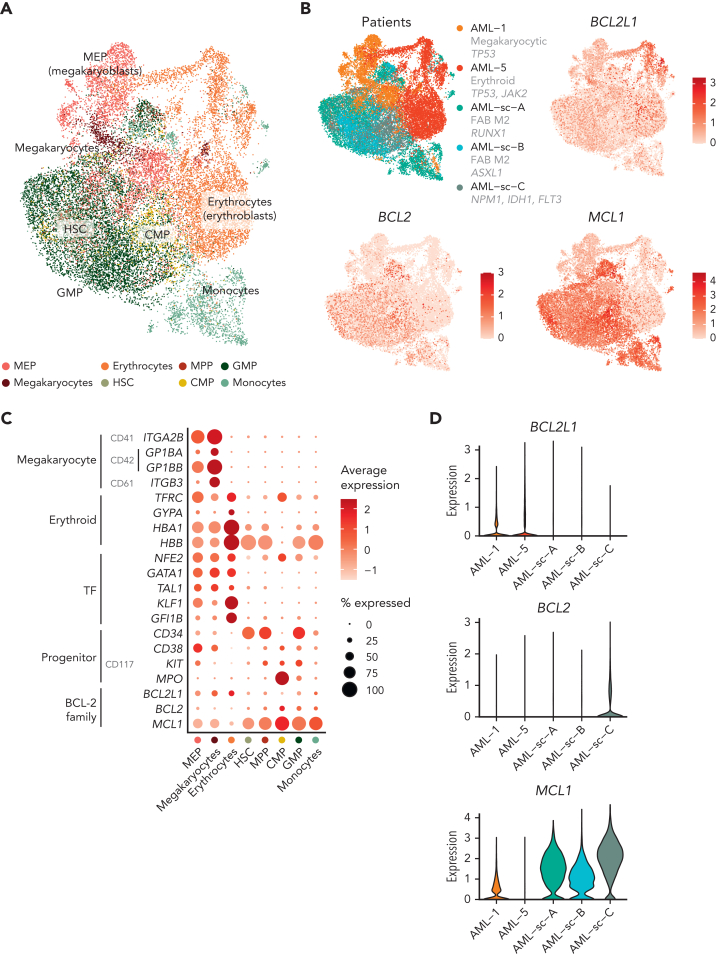
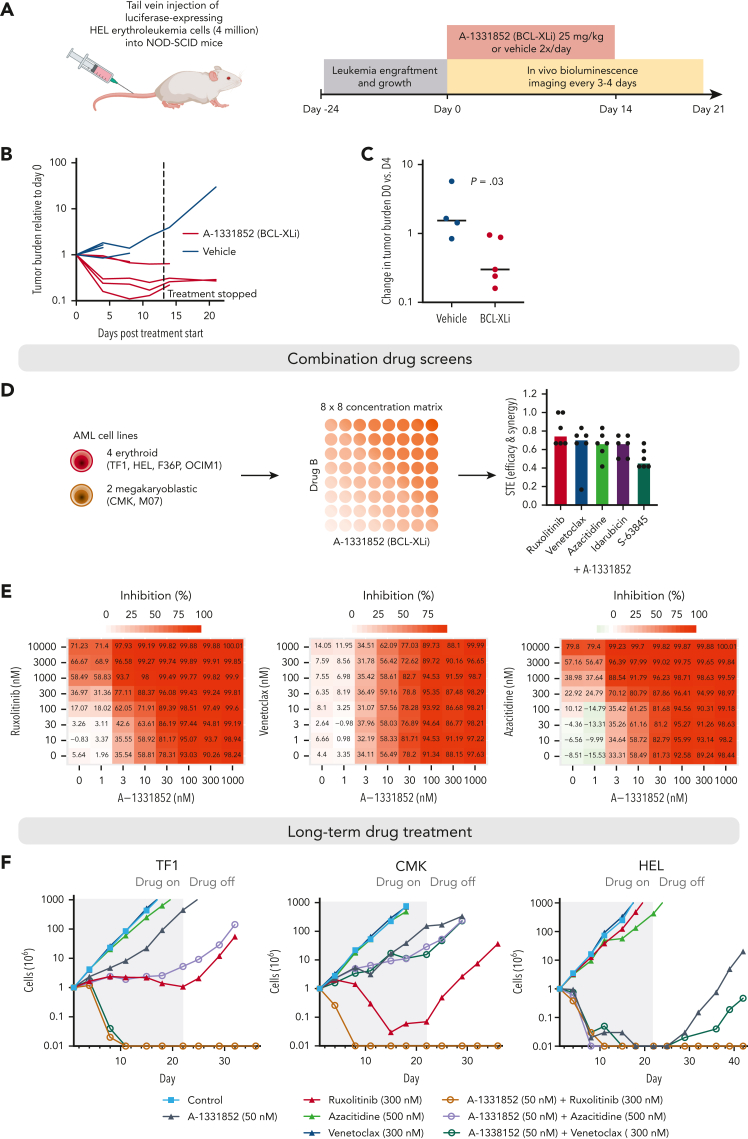
Myeloid neoplasms with erythroid or megakaryocytic differentiation include pure erythroid leukemia, myelodysplastic syndrome with erythroid features, and acute megakaryoblastic leukemia (FAB M7) and are characterized by poor prognosis and limited treatment options. Here, we investigate the drug sensitivity landscape of these rare malignancies. We show that acute myeloid leukemia (AML) cells with erythroid or megakaryocytic differentiation depend on the antiapoptotic protein B-cell lymphoma (BCL)-XL, rather than BCL-2, using combined ex vivo drug sensitivity testing, genetic perturbation, and transcriptomic profiling. High-throughput screening of >500 compounds identified the BCL-XL-selective inhibitor A-1331852 and navitoclax as highly effective against erythroid/megakaryoblastic leukemia cell lines. In contrast, these AML subtypes were resistant to the BCL-2 inhibitor venetoclax, which is used clinically in the treatment of AML. Consistently, genome-scale CRISPR-Cas9 and RNAi screening data demonstrated the striking essentiality of BCL-XL-encoding BCL2L1 but not BCL2 or MCL1, for the survival of erythroid/megakaryoblastic leukemia cell lines. Single-cell and bulk transcriptomics of patient samples with erythroid and megakaryoblastic leukemias identified high BCL2L1 expression compared with other subtypes of AML and other hematological malignancies, where BCL2 and MCL1 were more prominent. BCL-XL inhibition effectively killed blasts in samples from patients with AML with erythroid or megakaryocytic differentiation ex vivo and reduced tumor burden in a mouse erythroleukemia xenograft model. Combining the BCL-XL inhibitor with the JAK inhibitor ruxolitinib showed synergistic and durable responses in cell lines. Our results suggest targeting BCL-XL as a potential therapy option in erythroid/megakaryoblastic leukemias and highlight an AML subgroup with potentially reduced sensitivity to venetoclax-based treatments.


Conflict of interest statement

Conflict-of-interest disclosure: H.K. reports research funding from AbbVie and personal fees from Faron outside the submitted work. U.W.-K. has received honoraria from Sanofi, Novartis, and Pfizer (not related to this study) and is a member of the advisory boards of Gilead, Pfizer, and Jazz Pharmaceuticals. C.A.H. has received research funding from Celgene, Kronos Bio, Novartis, Oncopeptides, Orion, and IMI2 projects HARMONY and HARMONY PLUS unrelated to this work. S.M. has received research funding and honoraria from BMS, Novartis, and Pfizer (not related to this study). The remaining authors declare no competing financial interests.

Figures

None
Graphical abstract
Figure 1.
Figure 1.
High-throughput screening identifies BCL-XL inhibitors with selective efficacy against erythroid and megakaryoblastic leukemias. (A) Schematic of the high-throughput drug sensitivity and resistance testing experiments. Four erythroid (F36P, HEL, OCIM1, and TF1), 2 megakaryoblastic (CMK and M07), and 3 other AML cell lines (MOLM13, MV411, and OCIAML2) were screened using over 500 drugs in 5 different concentrations. In addition, a focused screen using 8 BCL-2 family inhibitors in 9 different concentrations in 4 erythroid, 2 megakaryoblastic, and 15 other AML cell lines was performed. (B) Volcano plot of drug sensitivity of erythroid or megakaryoblastic AML cell lines (n = 6) compared with other AML (n = 3) from screening of 528 compounds. Drugs with FDR <5% are colored in dark gray and drugs with FDR <5% and absolute differential DSS >15 are colored in red or blue. In addition, S-63845 targeting MCL-1 is colored in blue. (C) Dose-response curves of the BCL-XL inhibitor A-1331852, the BCL-2 inhibitor venetoclax, and the BCL-2/BCL-XL inhibitor navitoclax in 21 AML cell lines. DSS, drug sensitivity score; FDR, false discovery rate.
Figure 2.
Figure 2.
Genetic dependency on BCL2L1 in erythroid and megakaryoblastic leukemias. (A) Volcano plot of the most essential genes in erythroid compared with other AML cell lines in genome-scale CRISPR-Cas9 screening data from DepMap. Genes with a nominal P value < .05 and absolute values of differential gene effect >0.6 are colored in red or blue. In addition, the BCL-2 family members BCL2 and MCL1 are colored in blue. Fifteen percent FDR is indicated with a dashed line. (B) BCL2L1 CRISPR gene knockout effect in AML cell lines. More negative values indicate stronger dependency. (C) Volcano plot of most essential genes in erythroid/megakaryoblastic AML cell lines compared with other AML cell lines in RNAi screening data from the Achilles project. Genes with a nominal P value < .05 and absolute values of differential gene effect >0.5 are colored in red or blue. In addition, the BCL-2 family members BCL2 and MCL1 are colored in blue. Fifteen percent FDR is indicated with a dashed line. (D) BCL2L1 RNAi dependency score in AML cell lines. More negative values indicate stronger dependency. FDR, false discovery rate.
Figure 3.
Figure 3.
High BCL-XL expression in erythroid and megakaryoblastic leukemia underlies sensitivity to BCL-XL inhibition. (A) Protein levels of BCL-2 family members of BCL-XL, BCL-2, and MCL-1 in 21 AML cell lines. FAB subtype, expression of BCL-2 family genes and erythroid lineage TFs in AML cell lines from the CCLE data set (gray color, data not available), drug sensitivity scores of BCL-2 family inhibitors, and TP53 mutations are shown below as heatmaps. (B) Sensitivity of parental (TP53 WT) and CRISPR-mediated TP53 knockout (TP53 KO) variants of MOLM13, MV411, and OCIAML2 cell lines to A-1331852 and venetoclax as drug sensitivity scores. Erythroid/megakaryocytic AML cell lines are shown as a comparison. P values were obtained using paired Welch t tests (KO vs WT) and Wilcoxon rank-sum tests (M6/M7 vs others). Bar heights indicate mean, error bars indicate standard deviation, and dots indicate individual cell lines. (C) Expression of BCL-2 family genes in AML FAB subtypes in the TCGA data set. In the box plot, the horizontal line indicates the median, boxes indicate the interquartile range, and whiskers extend from the hinge to the smallest/largest value, at most 1.5 interquartile range from the hinge. (D) BCL2L1 (BCL-XL) expression across hematological malignancies in the Hemap data set. P value for AML M6 samples compared with all other samples using Wilcoxon rank-sum test is shown. Box plot as in panel C. (E) UMAP plots of single-cell RNA-seq data of normal hematopoiesis from the HCA, with cell type annotations based on the reference-based method SingleR and BCL2L1, BCL2, and MCL1 expression levels as normalized and scaled log-transformed counts colored on the plots. (F) Colony-forming potential of healthy BM mononuclear cells after 24 hours pretreatment of the indicated compounds in cell culture. Each dot represents a technical replicate and number of colonies were normalized to control after culturing the cells for 2 weeks in semisolid medium. Bar heights indicate mean and error bars indicate range. HCA, Human Cell Atlas; KO, knockout; WT, wild-type.
Figure 4.
Figure 4.
Samples from patients with AML with erythroid or megakaryocytic differentiation are highly sensitive to BCL-XL inhibition ex vivo. (A) Ex vivo DSS of A-1331852, venetoclax, and navitoclax in samples from patients with AML (n = 21) and healthy BM samples (n = 2). AML cases with TP53 mutation are colored red. P values were calculated using a Wilcoxon rank-sum test. (B) Dose-response curves of samples with erythroid/megakaryoblastic features treated ex vivo with A-1331852. DSS, drug sensitivity score.
Figure 5.
Figure 5.
Integrated single-cell transcriptomics and phenotype-based ex vivo drug profiling in AML with megakaryocytic differentiation. (A) Uniform Manifold Approximation and Projection (UMAP) plot of scRNA-seq data of AML with erythroid differentiation (patient AML-5). Cells are colored based on clusters, which are named with the help of the reference-based cell type classification method SingleR. (B) Dot plot of expression of selected erythroid differentiation markers, TFs regulating erythroid differentiation, proliferation and progenitor markers, and BCL-2 family genes in the indicated cell types in the scRNA-seq data of AML with erythroid differentiation (AML-5). CD marker names are shown in gray. Dot size indicates the percentage of cells of a cell type expressing the given gene, and average expression is shown as normalized and scaled log-transformed counts. Bar plot above shows the percentage of each cell type out of all cells. (C) UMAP plot of scRNA-seq data of AML with megakaryocytic differentiation (patient AML-1). Cell types identified using the reference-based method SingleR are colored as indicated in panel D. Cell types comprising less than 1% of total cells are labeled as “Other.” (D) Dot plot of expression of selected megakaryocyte differentiation markers, TFs regulating megakaryocytic differentiation, progenitor markers, and BCL-2 family genes in the indicated cell types in the scRNA-seq data of AML with megakaryocytic differentiation (AML-1) as in panel B. (E) UMAP plots of cells analyzed using flow cytometry-based drug profiling in the patient with AML with erythroid differentiation (AML-5). Cells from control (DMSO) and BCL-XL inhibitor-treated (A-1331852, 300 nM) conditions are shown, with 1000 cells sampled from each condition. (F) UMAP plots of cells analyzed using flow cytometry-based drug profiling in the patient with AML with megakaryocytic differentiation (AML-1). Cells from control (DMSO) and BCL-XL inhibitor-treated (A-1331852, 125 nM) conditions are shown, with 1000 cells sampled from each condition. (G) Viabilities (percentage of viable cells compared with DMSO control) of the clusters representing different cell types in the patients with AML with erythroid differentiation (AML-5) after treatment with indicated concentrations of A-1331852 and venetoclax were analyzed using flow cytometry-based drug profiling. Clusters are colored as in panel E. (H) Viabilities (percentage of viable cells compared with DMSO control) of the clusters representing different cell types in the patient with AML with megakaryocytic differentiation (AML-1) after treatment with indicated concentrations of A-1331852 and venetoclax analyzed using flow cytometry-based drug profiling. Clusters are colored as in panel F. DMSO, dimethyl sulfoxide.
Figure 6.
Figure 6.
BCL-2 family gene expression in blasts across AML types at single-cell resolution. (A) UMAP plot of scRNA-seq data of blasts from AML with megakaryoblastic differentiation (AML-1), AML with erythroid differentiation (AML-5), and 3 AMLs representing other subtypes. Cell types identified using the reference-based method SingleR are colored. (B) UMAP plots as in panel A with patients and expression of BCL2L1, BCL2, and MCL1 colored as normalized and scaled log-transformed counts. (C) Dot plot of RNA expression of selected megakaryocyte and erythroid markers, TFs regulating erythroid/megakaryocytic differentiation, progenitor markers, and BCL-2 family genes in the indicated cell types based on reference-based method SingleR annotations. (D) Violin plot demonstrating BCL-2 family gene expression of the blasts in different patients.
Figure 7.
Figure 7.
Efficacy of BCL-XL inhibition in a xenograft mouse model and in long-term combination treatments. (A) Schematic of the mouse xenograft experiment performed using HEL erythroleukemia cells. (B) Line graph showing tumor burden based on bioluminescence imaging for each mouse relative to start of treatment (day 0). Dashed line indicates stopping of the drug treatment. (C) Comparison of changes in tumor burden between BCL-XL inhibitor and vehicle treatment on day 4 of treatment relative to the start of treatment (day 0) based on bioluminescence imaging. P value was obtained using one-sided Wilcoxon rank-sum test. (D) Schematic of the drug combination screens and bar plot showing the synergy and efficacy score values of the combinations indicating combined efficacy and synergy in all cell lines ranked from highest to lowest on average. (E) Heatmaps of drug sensitivity in HEL erythroleukemia cells with the combinations of A-1331852 with ruxolitinib, venetoclax, and azacitidine across the tested concentration matrices. Percent inhibition values are indicated in the heatmaps. (F) Long-term drug treatment assays using TF1 (erythroid AML), CMK (megakaryocytic AML), and HEL-Luc (erythroid AML, used in mouse studies) cells. Gray-row shaded areas indicate duration of drug treatment.

Comment in

References

    1. Wickrema A, Crispino JD. Erythroid and megakaryocytic transformation. Oncogene. 2007;26(47):6803–6815. - PubMed
    1. Vardiman JW, Harris NL, Brunning RD. The World Health Organization (WHO) classification of the myeloid neoplasms. Blood. 2002;100(7):2292–2302. - PubMed
    1. Arber DA, Orazi A, Hasserjian R, et al. The 2016 revision to the World Health Organization classification of myeloid neoplasms and acute leukemia. Blood. 2016;127(20):2391–2405. - PubMed
    1. Boddu P, Benton CB, Wang W, Borthakur G, Khoury JD, Pemmaraju N. Erythroleukemia-historical perspectives and recent advances in diagnosis and management. Blood Rev. 2018;32(2):96–105. - PMC - PubMed
    1. Takeda J, Yoshida K, Nakagawa MM, et al. Amplified EPOR/JAK2 genes define a unique subtype of acute erythroid leukemia. Blood Cancer Discov. 2022;3(5):410–427. - PMC - PubMed

Publication types

MeSH terms

Substances