. 2022 Nov 22;7(22):e152357.
doi: 10.1172/jci.insight.152357.

Metabolites enhance innate resistance to human Mycobacterium tuberculosis infection

Affiliations

Metabolites enhance innate resistance to human Mycobacterium tuberculosis infection

Deepak Tripathi et al. JCI Insight. .

Abstract

To determine the mechanisms that mediate resistance to Mycobacterium tuberculosis (M. tuberculosis) infection in household contacts (HHCs) of patients with tuberculosis (TB), we followed 452 latent TB infection-negative (LTBI-) HHCs for 2 years. Those who remained LTBI- throughout the study were identified as nonconverters. At baseline, nonconverters had a higher percentage of CD14+ and CD3-CD56+CD27+CCR7+ memory-like natural killer (NK) cells. Using a whole-transcriptome and metabolomic approach, we identified deoxycorticosterone acetate as a metabolite with elevated concentrations in the plasma of nonconverters, and further studies showed that this metabolite enhanced glycolytic ATP flux in macrophages and restricted M. tuberculosis growth by enhancing antimicrobial peptide production through the expression of the surface receptor sialic acid binding Ig-like lectin-14. Another metabolite, 4-hydroxypyridine, from the plasma of nonconverters significantly enhanced the expansion of memory-like NK cells. Our findings demonstrate that increased levels of specific metabolites can regulate innate resistance against M. tuberculosis infection in HHCs of patients with TB who never develop LTBI or active TB.

Keywords: Immunology; Tuberculosis.


Figures
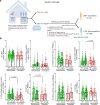
Figure 1
Figure 1. Study design and conversion of LTBI individuals to LTBI+ individuals in a cohort of HHCs of patients with TB.
(A) Schematic representation of the experimental design and conversion of LTBI HHCs (n = 452) of patients with TB into LTBI+ (converters) and remaining LTBI (nonconverters) at 24 months of follow-up. (B) Immune cell populations in the peripheral blood mononuclear cells (PBMCs) of M. tuberculosis–exposed HHCs of patients with TB. PBMCs were isolated from age-matched, epidemiological risk–matched, healthy (no comorbid conditions and not on any immunosuppressive drugs) converters (n = 96) and nonconverters (n = 293) at baseline (during the enrollment of the study, when all participants were healthy and LTBI, and after 24 months), and the percentages of CD4+, CD4+CD25+FoxP3+, CD56+CD16+, CD3CD56+CD27+, CD3CD56+CD27+CCR7+, CD14+CD16+, and CD16+ cells were determined by flow cytometry. The P values were determined by repeated measures mixed effects ANOVA followed by post hoc Tukey’s multiple comparisons test. Mean values, SDs, and P values are shown. Baseline, 0 months: at the time of recruitment; follow-up: 24 months after enrollment in the study.
Figure 2
Figure 2. Cytokine and chemokine production by PBMCs of nonconverters and converters at baseline (0 time point) and during follow-up (after 24 months).
PBMCs were isolated from age-matched, epidemiological risk–matched, healthy (no comorbid conditions and no immunosuppressive drugs) converters (n = 16) and nonconverters (n = 16) at baseline (during the enrollment of study, when all participants were healthy and LTBI) and after 24 months and cultured with or without ESAT-6 and CFP-10 (10 μg/mL each), as described in the Methods section. After 96 hours, the culture supernatants were collected, and the levels of the various chemokines and cytokines were measured using a multiplex ELISA. The P values were derived using repeated measures mixed-effects ANOVA followed by post hoc Tukey’s multiple comparisons test. Mean values and SEM are shown.
Figure 3
Figure 3. Whole-transcriptome sequencing analysis of ESAT-6– and CFP-10–cultured PBMCs from HHCs of patients with TB.
(A) PBMCs were isolated from age-matched, epidemiological risk–matched, healthy (no comorbid conditions and no immunosuppressive drugs) nonconverters (n = 3) and converters (n = 3) at baseline (during study enrollment, when all participants were LTBI) and after 24 months. Freshly isolated PBMCs were cultured with or without ESAT-6 and CFP-10 (10 μg/mL each), as described in the Methods section. After 96 hours, RNA was extracted, cDNA libraries were prepared, and whole-transcriptome sequencing was performed. The numbers of unique and relative transcript changes in unstimulated and ESAT-6 + CFP-10–stimulated PBMCs of converters and nonconverters at baseline and follow-up are shown. (B) A representative heatmap is shown. Transcripts differentially expressed in the PBMCs of LTBI compared with LTBI+ and active TB (P < 0.05, ANOVA). Diagram showing differentially expressed transcripts in nonconverters compared with converters. (C) PBMCs were obtained from nonconverters (n = 10) and converters (n = 10) at baseline and follow-up and from unexposed healthy controls (n = 10) and cultured in the presence of ESAT-6 + CFP-10 (10 μg/mL each), as described in the Methods section. After 96 hours, RNA was extracted, and the mRNA expression levels of Siglec-14, CES1, RPS-26, ANXA1, and RGCC1 were determined by quantitative real-time PCR. (D) PBMCs were obtained from healthy donors (n = 5) and cultured in the presence or absence of γ-M. tuberculosis (10 μg/mL). After 96 hours, various immune cell populations were sorted, and the relative mRNA expression levels of Siglec-14, CES1, RPS-26, ANXA1, and RGCC1 were determined by quantitative real-time PCR. (E) PBMCs were obtained from healthy donors (n = 3) and cultured in the presence or absence of γ-M. tuberculosis (10 μg/mL). After 96 hours, the expression of Siglec-14 in various immune populations was determined by flow cytometry. The P values were determined by 1-way ANOVA with Tukey’s multiple comparisons test. Mean values, SDs, and P values are shown.
Figure 4
Figure 4. Siglec-14 reduces M. tuberculosis growth in MDMs through antimicrobial peptide production.
MDMs from LTBI healthy donors were transfected with siRNA targeting CES-1, Siglec-14, RPS-26, RGCC1, and ANXA1 and control siRNA. The siRNA-transfected MDMs were infected with H37Rv at an MOI of 2.5. (A) After 5 days, the supernatant was aspirated, and the MDMs were lysed. The supernatant was centrifuged to pellet the bacteria, and the pellets were added to the cell lysates. The bacterial suspensions were ultrasonically dispersed, serially diluted, and plated in triplicate on 7H10 agar. The number of resultant colonies was counted after 3 weeks. The P values were determined by unpaired 2-tailed t test. The mean ± SD is shown. The means and SDs are shown for the number of CFUs per well. (B) The number of apoptotic MDMs was determined by flow cytometry. (C) The percentage of LC3+ MDMs was determined by flow cytometry. (D) Freshly prepared MDMs were infected with converter or nonconverter plasma opsonized or unopsonized M. tuberculosis H37Rv at an MOI of 2.5. The P values were determined by 1-way ANOVA with Tukey’s multiple comparisons test. Means, SDs, and P values are shown. (E) Control or Siglec-14 siRNA–transfected MDMs were infected with H37Rv at an MOI of 2.5. After 72 hours, RNA was isolated from MDMs, and a PCR array was performed for antimicrobial peptides. Data were normalized (z score) and centered using the Clustvis program. (F) CD14+Siglec-14+ and CD14+Siglec-14 cells were magnetically sorted from the PBMCs of healthy donors (n = 6). Sorted cells were infected with M. tuberculosis H37Rv at an MOI of 2.5. At 2 hours and 5 days postinfection, the number of bacterial colonies was determined as outlined above. (G) Freshly isolated PBMCs from LTBI healthy donors (n = 3) were cultured in the presence or absence of γ-M. tuberculosis. After 72 hours, CD14+Siglec-14+ and CD14+Siglec-14 cells were sorted through magnetic labeling, and RNA was isolated. Quantitative real-time PCR was performed to determine the mRNA expression level of antimicrobial peptides. The P values were determined by 1-way ANOVA with Tukey’s multiple comparisons test. Mean values, SDs, and P values are shown.
Figure 5
Figure 5. Nonconverters exhibit differential plasma metabolomic signatures.
Lyophilized plasma from nonconverters (n = 5) and converters (n = 5) at baseline (0, at enrollment) and follow-up (24 months) was analyzed using LC-MS. (A) A representative score plot of the partial least squares discriminant analysis (PLS-DA) was generated using MetaboAnalyst. PLS-DA models were validated using R2 and Q2 based on leave-one-out cross-validation; the 4-component model was selected as the optimized model with R2 = 0.95 and Q2 = 058. The significance of the model was demonstrated by a permutation test with 100 testing iterations using a separation distance of P < 0.01 (95% confidence interval). Blue: nonconverter baseline, light blue: nonconverter follow-up, red: converter baseline, green: converter follow-up. (B) An FDR-corrected heatmap of selected metabolites is shown, q = 0.05. (C) Representation of 25 metabolites with variable importance of projection (VIP) scores based on PLS-DA and considered significant. On the extreme right, red indicates high levels, and green indicates low levels of metabolites in the respective groups. (D) Quantitative metabolite set enrichment overview using metabolite set enrichment analysis, with the fold change showing metabolic pathways of 25 metabolites selected based on VIP scores (FDR-corrected q = 0.05).
Figure 6
Figure 6. Deoxycorticosterone acetate treatment promotes Siglec-14–dependent antibacterial activity in macrophages.
(A) Freshly prepared MDMs from healthy donors (n = 4) cultured in the presence or absence of γ-M. tuberculosis (10 μg/mL). Some γ-M. tuberculosis–cultured wells supplemented with metabolites were enriched in the plasma of nonconverters (4-hydroxypyridine, dl-methionine sulfoxide, l-kynurenine, l-α-glycerophosphocholine, d-sedoheptulose 7-phosphate, deoxycorticosterone acetate). After 72 hours, the expression (MFI) of Siglec-14 was determined by flow cytometry. (B) MDMs from healthy donors (n = 8) were infected at an MOI of 2.5. Some of the infected MDMs were cultured in the presence of the metabolites 4-hydroxypyridine, dl-methionine sulfoxide, l-kynurenine, l-α-glycerophosphocholine, d-sedoheptulose 7-phosphate, and deoxycorticosterone acetate (each 100 μM). Intracellular CFUs were determined at 5 days postinfection. P values were determined by unpaired 2-tailed t test. The mean ± SD is shown. (C) In the above panel, the supernatant was aspirated, and the level of HBD2 and S100A12 was determined by ELISA. P values were determined by unpaired 2-tailed t test. The mean ± SD is shown. (D) MDMs from healthy donors (n = 5) were isolated and transfected with siRNA targeting Siglec-14 or control siRNA and infected with M. tuberculosis H37Rv at an MOI of 2.5. In some M. tuberculosis–infected wells, deoxycorticosterone acetate (100 μM) was added. After 5 days, CFUs were counted. P values were determined by 1-way ANOVA with Tukey’s multiple comparisons test. Data are representative of 4 independent experiments. The mean ± SD is shown. (E) The concentrations of HBD2 and S100A12 were determined by ELISA. The P values were determined by unpaired t test. The mean ± SD is shown.
Figure 7
Figure 7. Deoxycorticosterone acetate keeps MDMs in a glycolytic state.
MDMs were cultured in the presence or absence of γ-M. tuberculosis (10 μg/mL). Some γ-M. tuberculosis–cultured MDMs were cultured with or without deoxycorticosterone acetate (100 μM) and complete DMEM containing 10 mM glucose, 2 mM glutamine, and 2 mM sodium pyruvate as substrates. After 48 hours, (A) mitochondrial OCR and (B) ECAR were measured. (C) A bar graph showing the ratio of mitochondrial and glycolytic ATP is shown. The P values were derived using an unpaired 2-tailed independent t test. The mean values and SDs are shown. (D) A bar graph showing the SRC, basal respiration, and coupling efficiency. For all panels, the data are representative of 4 independent experiments. The P values were determined by 1-way ANOVA with Tukey’s multiple comparisons. The mean values and SDs are shown.
Figure 8
Figure 8. Metabolites enhance the expansion of memory-like NK cells and cytokine production.
PBMCs from LTBI+ donors (n = 6) were labeled with CFSE and cultured with or without γ-M. tuberculosis. Some wells were supplemented with metabolites that were highly enriched in the plasma of nonconverters (4-hydroxypyridine, deoxycorticosterone acetate, dl-methionine sulfoxide, l-kynurenine, l-α-glycerophosphocholine, and d-sedoheptulose 7-phosphate, each 100 μM). After 5 days, the proliferation of memory NK cells was measured by flow cytometry. (A) A representative flow cytometry plot is shown. NK cells were identified by sequential gating on the lymphocytic singlet population and then on CD3CD56+ NK cells. The events within the gated CD3CD56+ NK cells were analyzed for CFSE+ cells and plotted in dot plots. (B) The total absolute number of CFSE+CD3CD56+CD27+ cells is shown. (C) Absolute number of proliferating CD3CD56+CD27+ cells. (D) Absolute number of proliferating CD3CD56+CD27+CCR7+ cells. (E) Absolute number of proliferating CD3CD56+CD27+CCR7 cells. (F) Absolute number of proliferating CD3+ T cells. (G) In the above panels, after 5 days, the supernatants were aspirated, and cytokine and chemokine production was measured by multiplex ELISA. The P values were derived using an unpaired 2-tailed independent t test. The mean values, SDs, and P values are shown.

References

    1. Zumla A, et al. The WHO 2014 global tuberculosis report--further to go. Lancet Glob Health. 2015;3(1):e10–e12. doi: 10.1016/S2214-109X(14)70361-4. - DOI - PubMed
    1. Manabe YC, Bishai WR. Latent Mycobacterium tuberculosis–persistence, patience, and winning by waiting. Nat Med. 2000;6(12):1327–1329. doi: 10.1038/82139. - DOI - PubMed
    1. Small PM, Fujiwara PI. Management of tuberculosis in the United States. N Engl J Med. 2001;345(3):189–200. doi: 10.1056/NEJM200107193450307. - DOI - PubMed
    1. Kaipilyawar V, Salgame P. Infection resisters: targets of new research for uncovering natural protective immunity against Mycobacterium tuberculosis. F1000Res. 2019;8:1698. doi: 10.12688/f1000research.19805.1. - DOI - PMC - PubMed
    1. Simmons JD, et al. Immunological mechanisms of human resistance to persistent Mycobacterium tuberculosis infection. Nat Rev Immunol. 2018;18(9):575–589. doi: 10.1038/s41577-018-0025-3. - DOI - PMC - PubMed

Publication types