. 2022 Nov 22;7(22):e152761.
doi: 10.1172/jci.insight.152761.

Neoadjuvant chemotherapy drives intratumoral T cells toward a proinflammatory profile in pancreatic cancer

Affiliations

Neoadjuvant chemotherapy drives intratumoral T cells toward a proinflammatory profile in pancreatic cancer

Max Heiduk et al. JCI Insight. .

Abstract

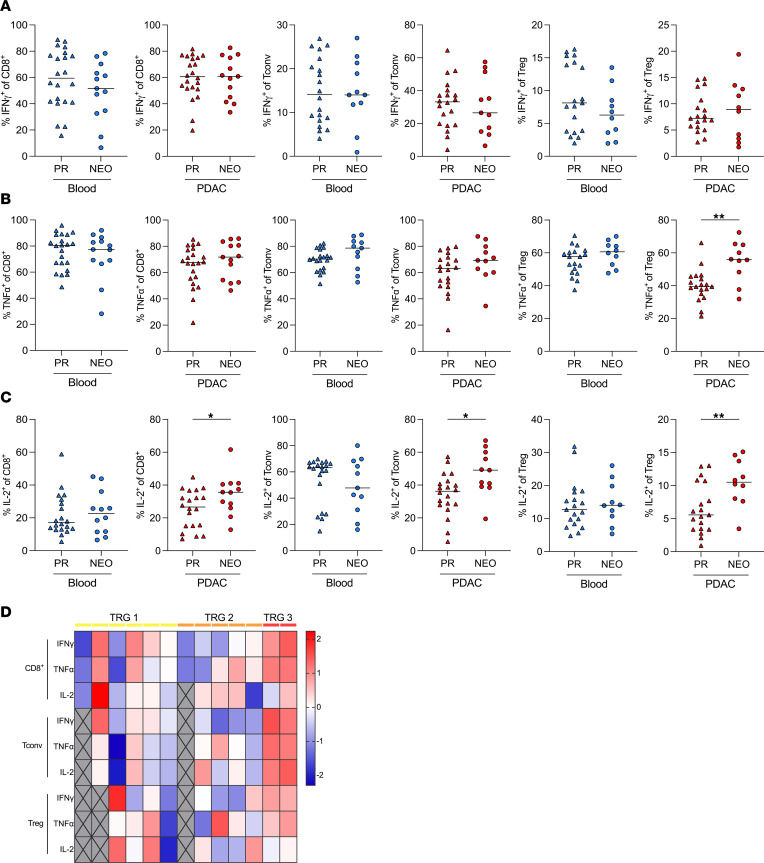
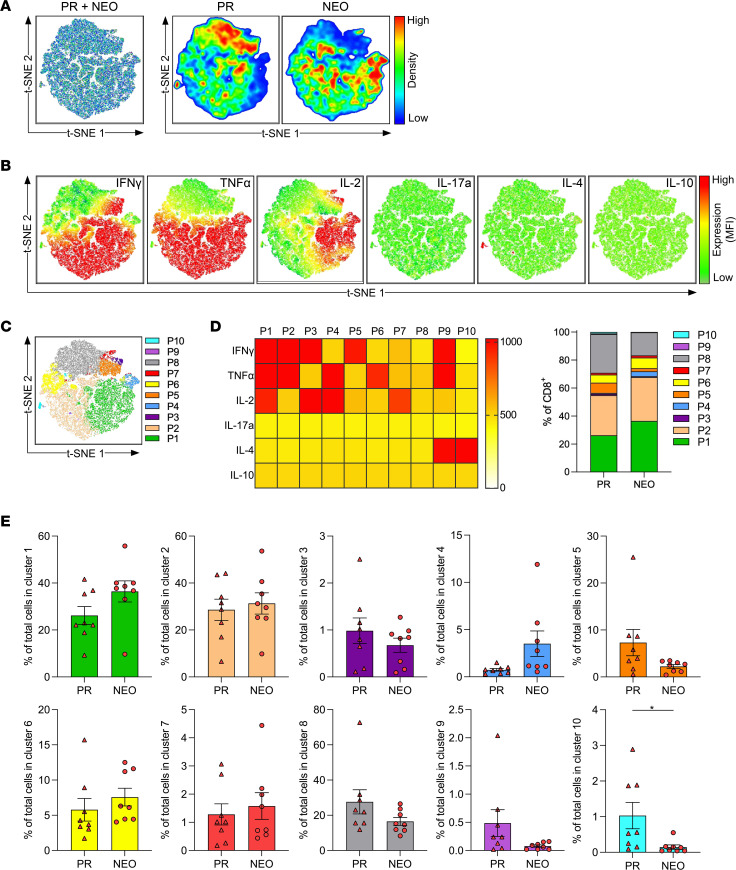
BACKGROUNDPancreatic ductal adenocarcinoma (PDAC) has a dismal prognosis. At diagnosis, only 20% of patients with PDAC are eligible for primary resection. Neoadjuvant chemotherapy can enable surgical resection in 30%-40% of patients with locally advanced and borderline resectable PDAC. The effects of neoadjuvant chemotherapy on the cytokine production of tumor-infiltrating T cells are unknown in PDAC.METHODSWe performed multiplex immunofluorescence to investigate T cell infiltration in 91 patients with PDAC. Using flow cytometry, we analyzed tumor and matched blood samples from 71 patients with PDAC and determined the frequencies of T cell subsets and their cytokine profiles. Both cohorts included patients who underwent primary resection and patients who received neoadjuvant chemotherapy followed by surgical resection.RESULTSIn human PDAC, T cells were particularly enriched within the tumor stroma. Neoadjuvant chemotherapy markedly enhanced T cell density within the ductal area of the tumor. Whereas infiltration of cytotoxic CD8+ T cells was unaffected by neoadjuvant chemotherapy, the frequency of conventional CD4+ T cells was increased, and the proportion of Tregs was reduced in the pancreatic tumor microenvironment after neoadjuvant treatment. Moreover, neoadjuvant chemotherapy increased the production of proinflammatory cytokines by tumor-infiltrating T cells, with enhanced TNF-α and IL-2 and reduced IL-4 and IL-10 expression.CONCLUSIONNeoadjuvant chemotherapy drives intratumoral T cells toward a proinflammatory profile. Combinational treatment strategies incorporating immunotherapy in neoadjuvant regimens may unleash more effective antitumor responses and improve prognosis of pancreatic cancer.FUNDINGThis work was supported by the Jung Foundation for Science and Research, the Monika Kutzner Foundation, the German Research Foundation (SE2980/5-1), the German Cancer Consortium, and the Faculty of Medicine Carl Gustav Carus, Technische Universität Dresden.

Keywords: Cancer; Cytokines; Immunology; Oncology; T cells.


Figures

Figure 1
Figure 1. Neoadjuvant chemotherapy increases the frequency of tumor-infiltrating CD4+ Tconv cells and reduces the proportion of Tregs.
(A) Paraffin-embedded human pancreatic ductal adenocarcinoma (PDAC) specimens from patients who were primary resected (PR) or received neoadjuvant chemotherapy (NEO) prior to surgery were stained for DAPI (blue), PanCK (red), and CD3 (green). Representative tissue segmentation and multiplex immunofluorescence images are shown. Scale bar: 100 μm. (B) Quantification of T cell density in whole PDAC specimens and distribution (density duct/density stroma) of patients who were PR (n = 62) or received NEO (n = 29). (C) T cell density and distribution according to tumor regression grade (TRG) of patients who received NEO with minor response (TRG1, n = 19) and moderate or major response (TRG ≥ 2, n = 10). (D) Flow cytometric analysis of circulating (blue) and matched PDAC-infiltrating leucocytes (red) from patients with PDAC who were PR and who received NEO. Quantification of CD8+ (n = 71; left) and CD4+ (n = 71; right) among all CD3+ T cells and (E) conventional CD4+ T (Tconv; CD4+FOXP3; n = 46; left) cells and Tregs (CD4+FOXP3+; n = 46; right) among all CD4+ T cells. (F) Ratio of CD8+ T cells to Tregs (n = 46; left) and CD4+ Tconv cells to Tregs (n = 46; right). Each point represents data from 1 patient. Medians are shown as horizontal lines. Unpaired 2-tailed t test. *P < 0.05.
Figure 2
Figure 2. PDAC-infiltrating CD4+ T cells have enhanced proinflammatory cytokine production after neoadjuvant chemotherapy.
Intracellular cytokine production of circulating and matched PDAC-infiltrating T cells from patients with PDAC. Percentages of (A) IFN-γ, (B) TNF-α, and (C) IL-2 production by CD8+ T cells (left), CD4+ Tconv cells (middle), and Tregs (right). IFN-γ+ and TNF-α+ cells of CD8+ T cells, n = 22 PR, n = 13 NEO; of Tconv cells, n = 20 PR, n = 11 NEO; of Tregs, n = 19 PR, n = 10 NEO. IL-2+ cells of CD8+ T cells, n = 20 PR, n = 12 NEO; of Tconv cells, n = 20 PR; n = 11 NEO; of Tregs, n = 19 PR, n = 10 NEO. (D) Heatmap depicting the percentage of IFN-γ–, TNF-α–, and IL-2–expressing CD8+ T cells, CD4+ Tconv cells, and Tregs standardized to z score ordered by tumor regression grade (TRG). Missing values are shown in gray. Each point represents data from 1 patient. Medians are shown as horizontal lines. Unpaired 2-tailed t test. *P < 0.05; **P < 0.01.
Figure 3
Figure 3. PDAC-infiltrating T cells have reduced antiinflammatory cytokine production after neoadjuvant chemotherapy.
Intracellular cytokine production of circulating and matched PDAC-infiltrating T cells from patients with PDAC. Percentages of (A) IL-17a, (B) IL-4, and (C) IL-10 production by CD8+ T cells (left), CD4+ Tconv cells (middle), and Tregs (right). IL-17a+ and IL-4+ cells of CD8+ T cells, n = 22 PR, n = 13 NEO; of Tconv cells, n = 20 PR, n = 11 NEO; of Tregs, n = 19 PR, n = 10 NEO. IL-10+ cells of CD8+ T cells, n = 20 PR, n = 10 NEO; of Tconv cells, n = 19 PR, n = 9 NEO; of Tregs, n = 18 PR, n = 9 NEO. (D) Heatmap depicting the percentage of IL-17a–, IL-4–, and IL-10–expressing CD8+ T cells, CD4+ Tconv cells, and Tregs standardized to z score ordered by tumor regression grade (TRG). Missing values are shown in gray. Each point represents data from 1 patient. Medians are shown as horizontal lines. Unpaired 2-tailed t test. *P < 0.05.
Figure 4
Figure 4. Neoadjuvant chemotherapy decreases the proportion of functionally exhausted CD8+ T cells in PDAC.
t-SNE analysis based on intracellular cytokine expression of tumor-infiltrating CD8+ T cells from patients who were primary resected (PR) (n = 8) and patients who received NEO (n = 8). (A) t-SNE analysis of CD8+ T cells merged (left) and separated distribution from patients who were PR and patients who received NEO (right). (B) t-SNE expression of indicated cytokines. (C) FlowSOM clustering into 10 clusters (P1–P10). (D) Heatmap depicting mean fluorescence intensity for cytokine expression of each cluster (left), and bar graph showing the distribution of each cluster within PR and NEO CD8+ T cells (right). (E) Proportion of CD8+ T cells within indicated clusters (PR vs. NEO). Each point represents data from 1 patient. Data are shown as the mean ± SEM. Unpaired 2-tailed t test. *P < 0.05.
Figure 5
Figure 5. Neoadjuvant chemotherapy decreases the proportion of functionally exhausted CD4+ Tconv cells in PDAC.
t-SNE analysis based on intracellular cytokine expression of tumor-infiltrating CD4+ Tconv cells from patients who were primary resected (PR) (n = 8) and patients who received NEO (n = 8). (A) t-SNE analysis of CD4+ Tconv cells merged (left) and separated distribution from patients who were PR and patients who received NEO (right). (B) t-SNE expression of indicated cytokines. (C) FlowSOM clustering into 10 clusters (P1–P10). (D) Heatmap depicting mean fluorescence intensity for cytokine expression of each cluster (left), and bar graph showing distribution of each cluster within PR and NEO CD4+ Tconv cells (right). (E) Proportion of CD4+ Tconv cells within indicated clusters (PR vs. NEO). Each point represents data from 1 patient. Data are shown as the mean ± SEM. Unpaired 2-tailed t test. *P < 0.05; **P < 0.01.
Figure 6
Figure 6. Neoadjuvant chemotherapy increases cytokine production of PDAC-infiltrating Tregs.
t-SNE analysis based on intracellular cytokine expression of tumor-infiltrating Tregs from patients who were primary resected (PR) (n = 8) and patients who received NEO (n = 8). (A) t-SNE analysis of Tregs merged (left) and separated distribution from patients who were PR and patients who received NEO (right). (B) t-SNE expression of indicated cytokines. (C) FlowSOM clustering into 10 clusters (P1–P10). (D) Heatmap depicting mean fluorescence intensity for cytokine expression of each cluster (left), and bar graph showing the distribution of each cluster within PR and NEO Tregs (right). (E) Proportion of Tregs within indicated cluster (PR vs. NEO). Each point represents data from 1 patient. Data are shown as the mean ± SEM. Unpaired 2-tailed t test. *P < 0.05.

References

    1. Siegel RL, et al. Cancer statistics, 2021. CA Cancer J Clin. 2021;71(1):7–33. doi: 10.3322/caac.21654. - DOI - PubMed
    1. Brunner M, et al. Current clinical strategies of pancreatic cancer treatment and open molecular questions. Int J Mol Sci. 2019;20(18):4543. doi: 10.3390/ijms20184543. - DOI - PMC - PubMed
    1. Strobel O, et al. Optimizing the outcomes of pancreatic cancer surgery. Nat Rev Clin Oncol. 2019;16(1):11–26. doi: 10.1038/s41571-018-0112-1. - DOI - PubMed
    1. Gillen S, et al. Preoperative/neoadjuvant therapy in pancreatic cancer: a systematic review and meta-analysis of response and resection percentages. PLoS Med. 2010;7(4):e1000267. doi: 10.1371/journal.pmed.1000267. - DOI - PMC - PubMed
    1. Suker M, et al. FOLFIRINOX for locally advanced pancreatic cancer: a systematic review and patient-level meta-analysis. Lancet Oncol. 2016;17(6):801–810. doi: 10.1016/S1470-2045(16)00172-8. - DOI - PMC - PubMed

Publication types

MeSH terms