. 2022 Nov 22;7(22):e154124.
doi: 10.1172/jci.insight.154124.

Single-cell analysis of senescent epithelia reveals targetable mechanisms promoting fibrosis

Affiliations

Single-cell analysis of senescent epithelia reveals targetable mechanisms promoting fibrosis

Eoin D O'Sullivan et al. JCI Insight. .

Abstract

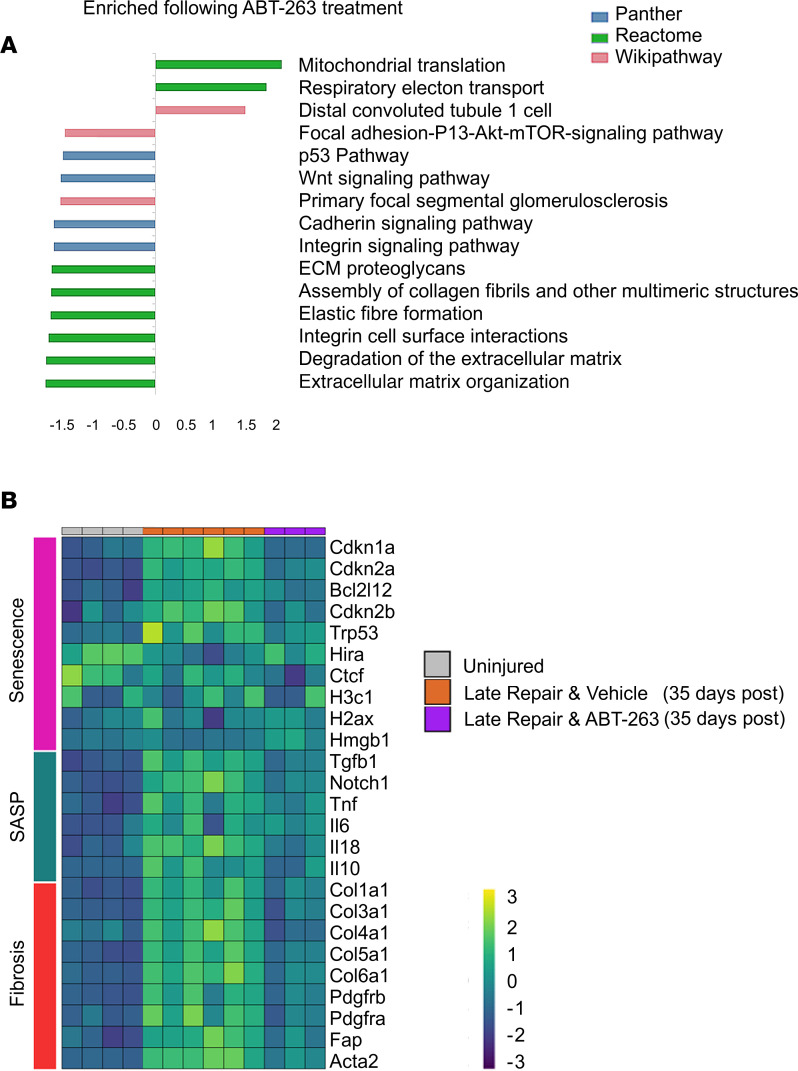
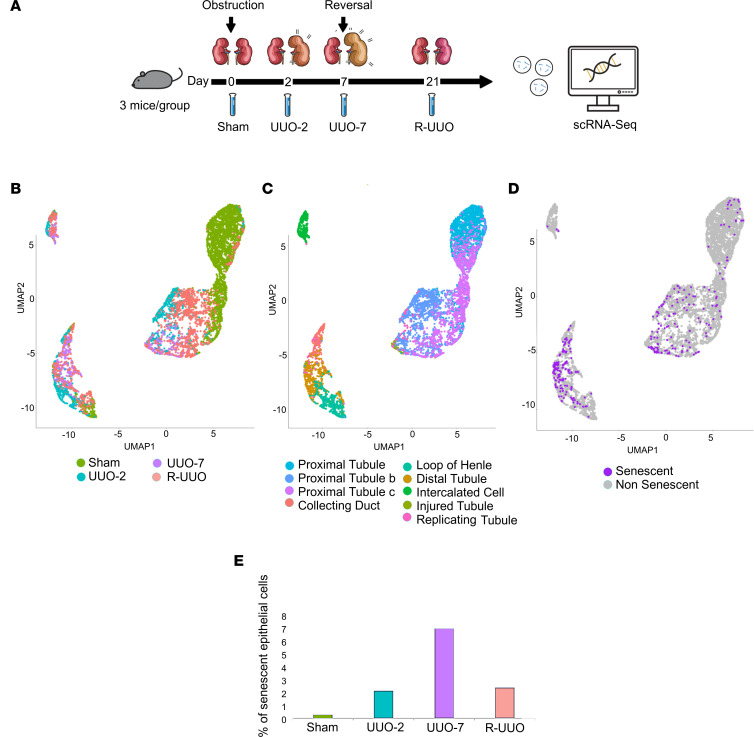
Progressive fibrosis and maladaptive organ repair result in significant morbidity and millions of premature deaths annually. Senescent cells accumulate with aging and after injury and are implicated in organ fibrosis, but the mechanisms by which senescence influences repair are poorly understood. Using 2 murine models of injury and repair, we show that obstructive injury generated senescent epithelia, which persisted after resolution of the original injury, promoted ongoing fibrosis, and impeded adaptive repair. Depletion of senescent cells with ABT-263 reduced fibrosis in reversed ureteric obstruction and after renal ischemia/reperfusion injury. We validated these findings in humans, showing that senescence and fibrosis persisted after relieved renal obstruction. We next characterized senescent epithelia in murine renal injury using single-cell RNA-Seq. We extended our classification to human kidney and liver disease and identified conserved profibrotic proteins, which we validated in vitro and in human disease. We demonstrated that increased levels of protein disulfide isomerase family A member 3 (PDIA3) augmented TGF-β-mediated fibroblast activation. Inhibition of PDIA3 in vivo significantly reduced kidney fibrosis during ongoing renal injury and as such represented a new potential therapeutic pathway. Analysis of the signaling pathways of senescent epithelia connected senescence to organ fibrosis, permitting rational design of antifibrotic therapies.

Keywords: Bioinformatics; Cell Biology; Cellular senescence; Fibrosis; Nephrology.


Figures

Figure 1
Figure 1. Senescent cell depletion during UUO results in increased renal fibrosis.
(A) Schematic of murine senescent cell depletion during UUO experiment, with samples taken at days 0 and 7. Note senolytic ABT-263 administration daily from time of injury. n = 6–8 per group. (B) qPCR analysis of renal tissue after UUO showing reduction in markers of senescence cyclin dependent kinase inhibitor 1A (Cdkn1a), no change in myofibroblast markers Acta2, Ptprc, Pdgfrb, or Col3a1. * denotes P < 0.05 by ANOVA and Tukey test. RQ, relative quantification (fold change). (C) Representative images and quantification of immunofluorescence and of Picrosirius red staining of kidneys. Quantification of total staining per renal cortex. * denotes P < 0.05. PDGFRB: uninjured and vehicle-treated 5.69% (s.d. 2.23), uninjured and ABT-263–treated 7.53% (s.d. 2.48). UUO and vehicle-treated 33% (s.d. 5.67) versus UUO and ABT-263–treated 34.3% (s.d. 3.77). ANOVA, P = 0.921 95% CI: –4.2–6.75. α–Smooth muscle actin (α-SMA): uninjured and vehicle-treated 0.72% (s.d. 0.16), uninjured and ABT-263–treated 1.56% (s.d. 0.39). UUO and vehicle-treated 1.31% (s.d. 0.335) versus UUO and ABT-263–treated 19.9% (s.d. 6.96). ANOVA, P < 0.000 95% CI: 12.33–24.8. Collagen 1: uninjured and vehicle-treated 3.75% (s.d. 1.73), uninjured and ABT-263–treated 1.95% (s.d. 0.74). UUO and vehicle-treated 8.85% (s.d. 7.08) versus UUO and ABT-263–treated 14.5% (s.d. 6.58). ANOVA, P = 0.921 95% CI: -4.2–6.75. Picrosirius red: uninjured and vehicle-treated 2.1% (s.d. 0.26), uninjured and ABT-263–treated 2.33% (s.d. 0.34). UUO and vehicle-treated 6.5% (s.d. 0.81) versus UUO and ABT-263–treated 15.6% (s.d. 3.08). ANOVA, P < 0.000 95% CI: 6.8–11.3. For box plots, the center line represents the mean, the box limits the first and third quartiles, the whiskers ± 1.5 × IQR, and the points all the data. Scale bar = 100 μm.
Figure 2
Figure 2. Senescent cell depletion following IRI results in decreased renal fibrosis.
(A) Schematic of murine senescent cell depletion following IRI experiment, with samples taken at days 0 and 28. Note senolytic ABT-263 administration for 2 weeks following injury. n = 6–8 per group. (B) Cystatin C measurement (ng/mL) — baseline group, mean cystatin C 377 (s.d. 84), and postnephrectomy group, mean 1,244 (s.d. 395). IRI and vehicle treatment group, mean 2,136 (s.d. 491), versus IRI and ABT-263 treatment, mean 1,286 (s.d. 372), 2-sided t test, P = 0.0006, difference 850, CI: 315–1,384. (C) Representative images and quantification of immunofluorescence and of Picrosirius red staining of kidneys. Quantification of total staining per renal cortex. * denotes P < 0.05. PDGFRB: uninjured 5.69% (s.d. 2.23), uninjured and ABT-263–treated 7.53% (s.d. 2.48). IRI and vehicle-treated 12.8% (s.d. 4.66) versus IRI and ABT-263–treated 14.3% (s.d. 2.82). ANOVA, P = 0.921 95% CI: –4.24–6.7. α-SMA: uninjured 0.84% (s.d. 0.33). uninjured and ABT-263–treated 1.56% (s.d. 0.39). IRI and vehicle-treated 25.5% (s.d. 23.4) versus IRI and ABT-263–treated 10.1% (s.d. 3.56). ANOVA, P = 0.108 95% CI: –33.74–2.92. Collagen 1: uninjured and vehicle-treated 3.75% (s.d. 1.73), uninjured and ABT-263–treated 1.95% (s.d. 0.74). UUO and vehicle-treated 12% (s.d. 12) versus UUO and ABT-263–treated 16.9% (s.d. 6.39). ANOVA, P = 0.921 95% CI: –4.2–6.75. Picrosirius red: control and vehicle-treated 0.98% (s.d. 0.37), control and ABT-263–treated 1.35% (s.d. 0.51). IRI and vehicle-treated 10.6% (s.d. 2.2) versus IRI and ABT-263–treated 5.6% (s.d. 1.14), difference 5.06%, (CI: 3.1–7.01) P < 0.005. For box plots, the center line represents the mean, the box limits the first and third quartiles, the whiskers ± 1.5 × IQR, and the points all the data. Scale bar = 100 μm.
Figure 3
Figure 3. ABT-263 reduces fibrosis after R-UUO.
(A) Schematic of murine R-UUO experiment, with samples taken at days 0, 14 (7 days following reversal), and 42 (35 days following reversal). Note senolytic ABT-263 administration for 14 days during the repair phase. n = 6–8 per group. (B) Representative images and quantification of Picrosirius red staining of kidneys and immunofluorescence of key proteins. Quantification of total staining per renal cortex. * denotes P < 0.05. Picrosirius Red: vehicle-treated 6.5% (s.d. 1.6) versus ABT-263–treated 3.3% (s.d. 2.2), 2-sided t test, P = 0.01, CI: 0.7–5.6. Collagen 1: vehicle-treated 5.7% (s.d. 1.6) versus ABT-263–treated 21.5% (s.d. 8.3), 2-sided t test, P = 0.0003, CI: 9.2–22.3. PDGFRB: vehicle-treated 13.1% (s.d. 12.2) versus ABT-263–treated 5.5% (s.d. 5.5), 2-sided t test, P = 0.1, CI: –3.3–18. α-SMA: vehicle-treated 10.2% (s.d. 5.5) versus ABT-263–treated 3.4% (s.d. 2) 2-sided t test, P = 0.01, 95% CI: 2–11.5.
Figure 4
Figure 4. ABT-263 alters the renal transcriptome by depleting senescent cells after R-UUO.
(A) Gene set enrichment analysis (GSEA) of differentially expressed genes (DEGs) between ABT-263–treated animals and vehicle-treated controls at 35 days after reversal. All FDR values for all pathways shown are <0.05. GSEA performed on WebGestalt. (B) Heatmap showing senescence-associated and fibrosis-associated genes are persistent during repair, which return toward baseline following administration of ABT-263. The color scheme is based on z score distribution. All genes during late repair are significant DEGs (q < 0.1) as compared with uninjured group. ABT-263–treated genes compared with vehicle-treated were all were significant DEGs (q < 0.1) except H3c1, H2ax, Hmgb1, Il6, and Il10.
Figure 5
Figure 5. Senescent cells persist following renal injury with subsequent maladaptive repair.
(A) Schematic of human kidney sample retrieval (n = 22). (B) Human kidney fibrosis. Red staining indicates Picrosirius red staining of collagen networks. * denotes significance at P < 0.05. Uninjured 3.3% (s.d. 3.3) versus obstruction 18.6% (s.d. 6.1) versus after obstruction 14% (s.d. 4.5), ANOVA, uninjured versus obstructed, P = 0.002 CI 7.4–23.3, uninjured versus after obstruction P = 0.002 CI 3.9–18.7, obstruction versus after obstruction P = 0.6 CI –10.14–2.11. For all box plots, the center line represents the mean, the box limits the first and third quartiles, and the whiskers are ± 1.5 × IQR. Scale bar = 50 μm. (C) Human kidney senescence. P21CIP1 staining demonstrating senescent epithelial cells. Arrows point to P21CIP1+ nuclei. Y axis shows fold change of senescent tubules per kidney relative to the mean number of senescent tubules in the uninjured control group. Uninjured 0.9 (s.d. 0.9) versus obstruction 10.5 (s.d. 11.4) versus after obstruction 7.8 (s.d. 4.3), Kruskal-Wallis rank sum test, uninjured versus obstructed, P = 0.009 CI 1.5–29.6, uninjured versus after obstruction P = 0.001 CI 2.7–12.5, obstruction versus after obstruction P = 0.2 CI: –5.5–14.5.
Figure 6
Figure 6. Senescent cells can be identified using single-cell RNA-Seq.
(A) Schematic of single-cell RNA-Seq R-UUO experimental workflow. Uniform manifold approximation and projection (UMAP) plots of 7,392 epithelial cells colored by (B) injury time point, (C) unbiased cell cluster, and (D) senescent status (320 cells). (E) Percentage of epithelial cells classified as senescent at each injury time point. The proportion of epithelial cells that are senescent increases over time following injury and decreases during repair but does not return to baseline.
Figure 7
Figure 7. Senescent cells exhibit a proinflammatory, profibrotic transcriptome.
(A) GSEA between senescent and nonsenescent epithelial cells. Selected pathways demonstrate consistency with known senescent signaling pathways. All FDR values for pathways shown are <0.05. GSEA scores generated with WebGestalt as described in Supplemental Methods. (B) Heatmap of top DEGs between non/senescent epithelial cells, calculated using Wilcoxon signed-rank test. The color scheme is based on z score distribution.
Figure 8
Figure 8. Conserved senescent transcriptome across species and organ.
(A) UMAP of 3,869 epithelial cells from human cirrhotic livers, colored by classification from original paper (31), and senescent status. (B) UMAP of 1,692 epithelial cells from a patient with chronic allograft nephropathy colored by cell type classification and senescent status. (C) Expression of DEGs in senescent epithelial cells, which were consistent across species and organs. Size of dot represents the percentage of cells in each cluster expressing the gene; color indicates average gene expression per cell.
Figure 9
Figure 9. Ligand-receptor analysis allows identification of potential therapeutic targets.
(A) Top senescent ligand–mesenchymal receptor pairs across the time course of the reversible ureteric obstruction model. Size of dot is proportional to mean expression values for all the interacting partners. All interactions are significant with P < 0.05. P value refers to the enrichment of the interacting ligand-receptor pair in each of the interacting pairs of cell types. (B) Experimental workflow for inducing senescence in irradiated human proximal tubular cells. (C) Irradiation-induced senescence in human proximal tubular cells increases key ligand transcription. ANOVA test used for significance testing, * denotes P < 0.05. For box plots, the center line represents the mean, the box limits the first and third quartiles, the whiskers ± 1.5 × IQR, and the points all the data. IRR, irradiated; NR, no irradiation.
Figure 10
Figure 10. Increased expression of PDIA3 enhances TGF-β1–driven fibroblast proliferation in vitro.
Full figure legend with more statistical data available in Supplemental Data 1. (A) Increased levels of cell cycle proteins cyclin D1 and PCNA in renal fibroblasts in response to TGFB1 administration. P values generated by t test. (B) MTT assay readout normalized to control group demonstrating that dual treatment with pPDIA3 and TGF-β1 results in additional proliferation compared with single TGF-β1. One-way ANOVA with Bonferroni’s correction. (C) Trypan blue assay readout normalized to control group demonstrating treatment with PDIA3 and/or TGF-β1 results in additional proliferation compared with control. One-way ANOVA with Bonferroni’s correction. (D) Trypan blue assay readout normalized to control group demonstrating treatment with Loc14 reduces cell viability. One-way ANOVA with Bonferroni’s correction. (E) Coadministration of PDIA3, TGFB1, and Loc14 to human renal fibroblasts does not alter TGFBRI synthesis. Comparisons tested using 1-way ANOVA with Bonferroni’s correction. No comparisons were statistically significant at P adj < 0.05. (F) Coadministration of pPDIA3 to TGFB1-treated fibroblasts increases p-SMAD2 synthesis. Comparisons tested using 1-way ANOVA with Bonferroni’s correction. (G) Coadministration of siRNA to TGFB1-treated fibroblasts reduces p-SMAD2 synthesis. Comparisons tested using 1-way ANOVA with Bonferroni’s correction. (H) Coadministration of PDIA3 and TGFB1 to human renal fibroblasts increases SARA and p-SMAD2 synthesis. Dual treatment with PDIA3 and TGFB1 results in a greater increase compared with either alone. This effect was abolished by Loc14 administration. Comparisons tested using 1-way ANOVA with Bonferroni’s correction. (I) Time course experiment showing increased SARA protein over time following PDIA3 administration, first detectable at 6 hours after administration. One-way ANOVA with Bonferroni’s correction. (J) siRNA to SARA results in reduced levels of p-SMAD2, such that in the presence of siRNA to SARA, TGF-β1 no longer induces p-SMAD2 production in fibroblasts. One-way ANOVA with Bonferroni’s correction. *P < 0.05.
Figure 11
Figure 11. Inhibition of PDIA3 reduces SMAD2 phosphorylation, fibroblast proliferation, and fibrosis deposition after UUO in vivo.
(A) Experimental workflow for inhibition of PDIA3 following UUO. (B) Representative images and quantification of immunofluorescence and of Picrosirius red staining of kidneys. Quantification of total staining per renal cortex. * denotes P < 0.05. Loc14 administration results in less p-SMAD2 activation in vivo after UUO in mice. Mean% staining in uninjured group 1.89% (s.d. 0.7) versus vehicle-treated after UUO 4.99% (s.d. 2.8), ANOVA, P adj = 0.02, CI: 0.5–7.2. vehicle-treated 4.99% (s.d. 2.8) versus Loc14-treated 2.27% (s.d. 1.6), ANOVA, P adj = 0.05, 95% CI: –5.44–0.010. Picrosirius red: 11% (s.d. 2.8) in vehicle-treated versus 7.8% (s.d. 2.6) in Loc14-treated mice, 2-sided t test, P = 0.03, 95% CI: 0.2–6.18. Collagen 1: 3.2% (s.d. 2) in vehicle-treated versus 5.9 % (s.d. 1.7) in Loc14-treated, Wilcoxon rank sum test, P = 0.01, CI 1:4.4. Pdgfrb: 25% (s.d. 4) in vehicle-treated versus 8.7% (s.d. 4) in Loc14-treated mice, 2-sided t test, P = 0.003, 95% CI: 7.2–25. α-SMA: 4% in vehicle-treated (s.d. 2.2) versus 1.5% in Loc14-treated mice (s.d. 2.3), 2-sample Wilcoxon test, P = 0.037, CI 0.6–5.2. For box plots, the center line represents the mean, the box limits the first and third quartiles, the whiskers ± 1.5 × IQR and the points all the data. Scale bar = 100 μm.

References

    1. Sawhney S, Fraser SD. Epidemiology of AKI: utilizing large databases to determine the burden of AKI. Adv Chronic Kidney Dis. 2017;24(4):194–204. doi: 10.1053/j.ackd.2017.05.001. - DOI - PMC - PubMed
    1. Hsu RK, Hsu C-Y. The role of acute kidney injury in chronic kidney disease. Semin Nephrol. 2016;36(4):283–292. doi: 10.1016/j.semnephrol.2016.05.005. - DOI - PMC - PubMed
    1. Rifkin DE, et al. Does AKI truly lead to CKD? J Am Soc Nephrol. 2012;23(6):979–984. doi: 10.1681/ASN.2011121185. - DOI - PMC - PubMed
    1. Bikbov B, et al. Global, regional, and national burden of chronic kidney disease, 1990–2017: a systematic analysis for the Global Burden of Disease Study 2017. Lancet. 2020;395(10225):709–733. doi: 10.1016/S0140-6736(20)30045-3. - DOI - PMC - PubMed
    1. Demaria M, et al. An essential role for senescent cells in optimal wound healing through secretion of PDGF-AA. Dev Cell. 2014;31(6):722–733. doi: 10.1016/j.devcel.2014.11.012. - DOI - PMC - PubMed

Publication types