. 2023 Jan:67:101652.
doi: 10.1016/j.molmet.2022.101652. Epub 2022 Dec 9.

p21 induces a senescence program and skeletal muscle dysfunction

Affiliations

p21 induces a senescence program and skeletal muscle dysfunction

Davis A Englund et al. Mol Metab. 2023 Jan.

Abstract

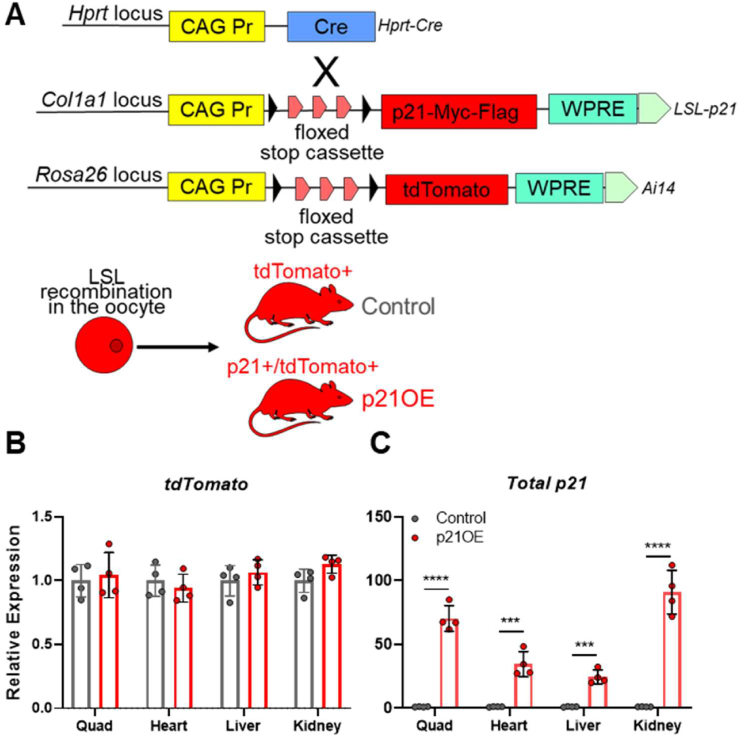
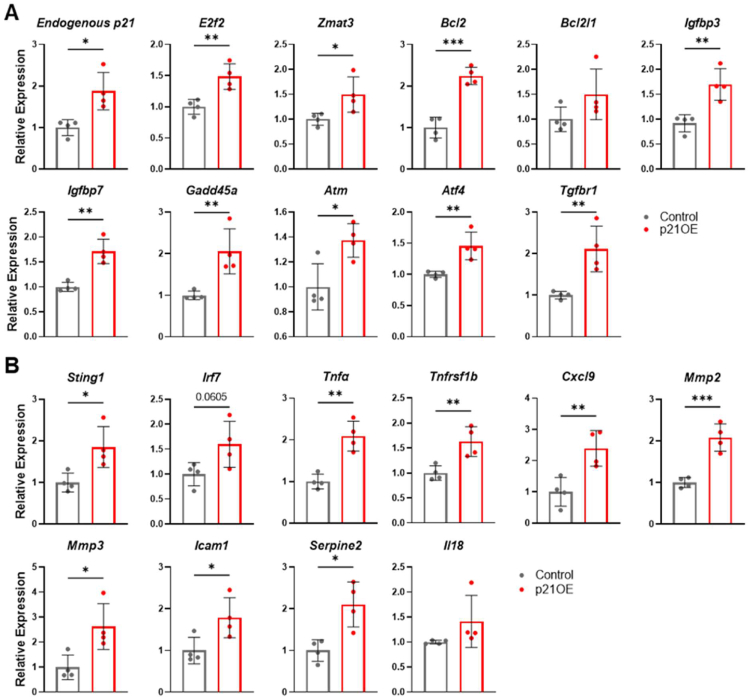
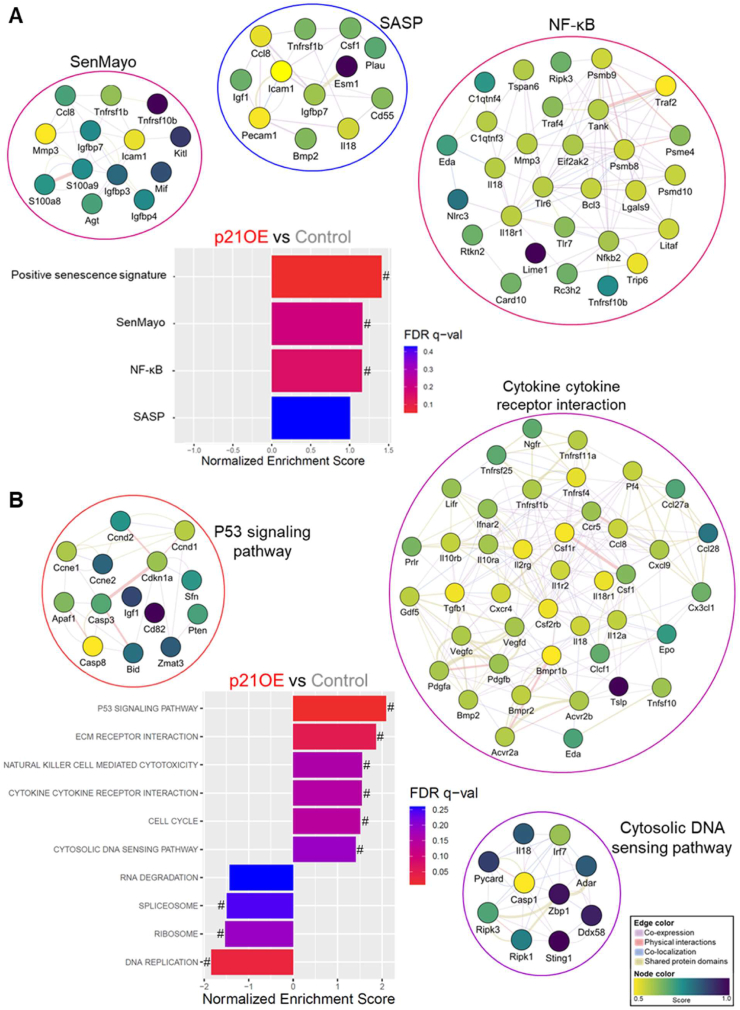
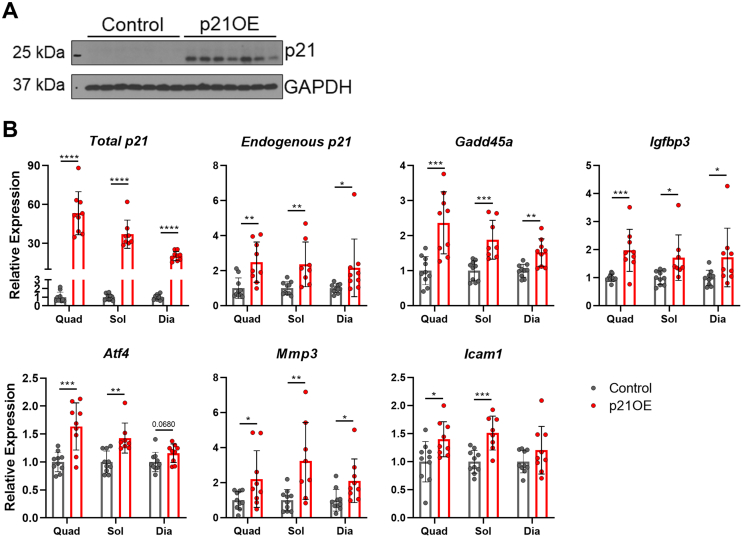
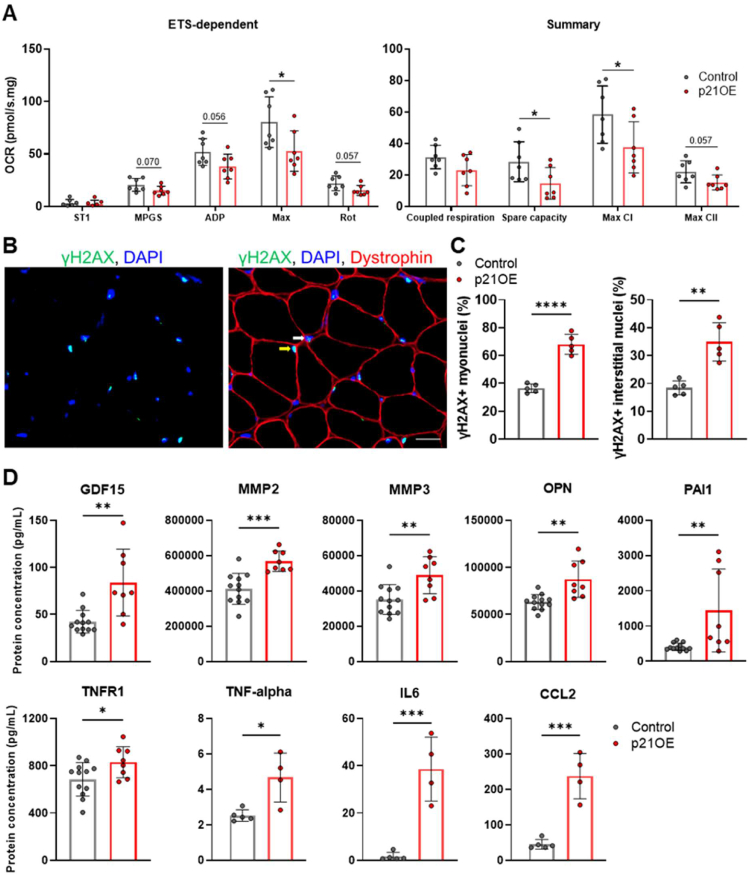
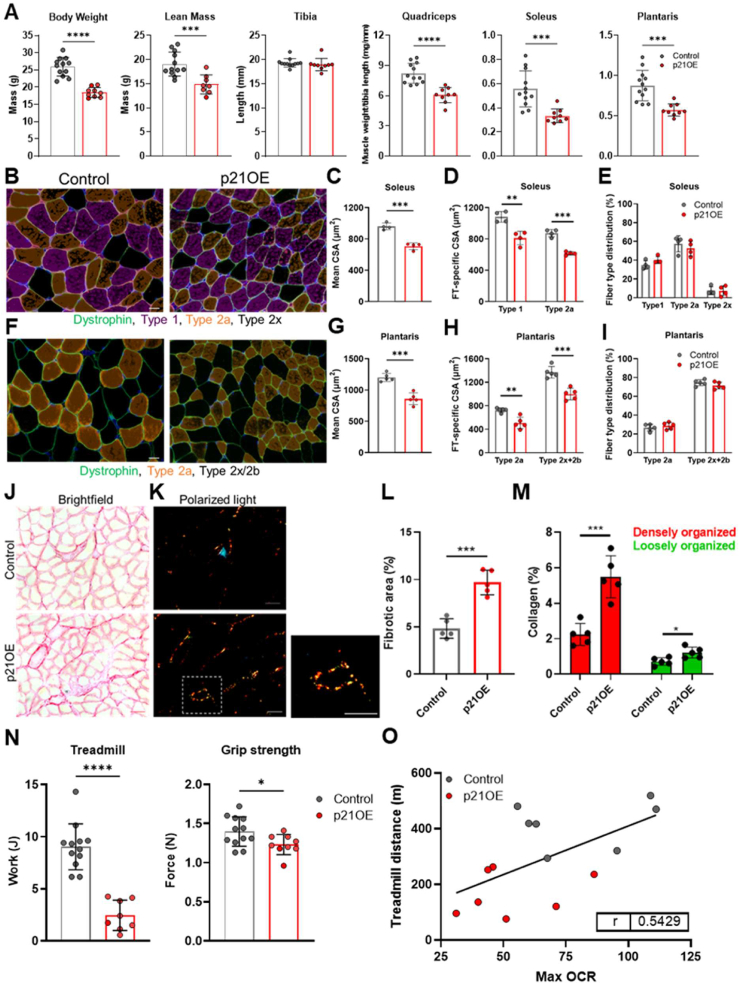
Recent work has established associations between elevated p21, the accumulation of senescent cells, and skeletal muscle dysfunction in mice and humans. Using a mouse model of p21 overexpression (p21OE), we examined if p21 mechanistically contributes to cellular senescence and pathological features in skeletal muscle. We show that p21 induces several core properties of cellular senescence in skeletal muscle, including an altered transcriptome, DNA damage, mitochondrial dysfunction, and the senescence-associated secretory phenotype (SASP). Furthermore, p21OE mice exhibit manifestations of skeletal muscle pathology, such as atrophy, fibrosis, and impaired physical function when compared to age-matched controls. These findings suggest p21 alone is sufficient to drive a cellular senescence program and reveal a novel source of skeletal muscle loss and dysfunction.

Keywords: Aging; Cellular senescence; DNA damage; Fibrosis; Physical function; Sarcopenia; Senescence-associated secretory phenotype.


Figures

Figure 1
Figure 1
Engineering of a Cre/Lox mouse that allows for ubiquitous coexpression of p21 and tdTomato. (A) Schematic representation of transgenes used for Cre expression (Hprt-Cre) and Cre-inducible expression of p21 (LSL-p21 for LoxP/STOP/LoxP-p21) and tdTomato (Ai14). (B–C) tdTomato and p21 expression across tissues assessed by RT-qPCR (n = 4/group). Data represent means ± SD. ∗∗∗P < 0.001, ∗∗∗∗P < 0.0001, as assessed by unpaired two-tailed t tests.
Figure 2
Figure 2
p21 increases expression of inducers and reinforcers of the senescence program in skeletal muscle. (A) Cell-cycle regulators and markers of DNA damage and (B) Inflammatory regulatory factors assessed in the quadriceps by RT-qPCR (n = 4/group). Data represent means ± SD. ∗P < 0.05; ∗∗P < 0.01; ∗∗∗P < 0.001, as assessed by unpaired two-tailed t tests.
Figure 3
Figure 3
p21 induces a transcriptional program in skeletal muscle consistent with cellular senescence. (A-B) Enriched senescence-related pathways in p21OE mice identified by GSEA via RNA-seq of the quadriceps muscle (n = 3/group). (A) Curated senescence-related pathways. (B) KEGG pathways. Gene sets enriching SenMayo, SASP, NF-κB, p53 signaling, cytokine–cytokine receptor interaction, and cytosolic DNA sensing pathway are visualized via colored gene nodes and edges to illustrate the relationships between genes within a given pathway. The colors of gene nodes and edges are scaled to an interaction score and network category, respectively. # denotes false discovery rate (FDR) q value < 0.25.
Figure 4
Figure 4
Accretion of p21 and increased expression of senescence markers across skeletal muscles in response to p21OE. (A) Western blot of p21 and GAPDH in quadriceps muscle (n = 7/group). (B) Senescence markers in the quadriceps (Quad), soleus (Sol), and diaphragm (Dia) muscles assessed by RT-qPCR (n = 8–10/group). Data represent means ± SD. ∗P < 0.05; ∗∗P < 0.01; ∗∗∗P < 0.001, as assessed by unpaired two-tailed t tests.
Figure 5
Figure 5
p21 gives rise to hallmarks of cellular senescence. (A) Oxygen consumption rates (OCR) in muscle fiber mitochondria measured using high-resolution respirometry (n = 7/group). OCR, oxygen consumption rates; ST1, respiratory state 1; MPGS, malate, pyruvate, glutamate, succinate; ADP, respiration in presence of MPGS plus ADP; Max, maximal respiration (after FCCP titration); Rot, respiration after rotenone (complex I inhibitor) addition. (B) Representative immunofluorescence images of soleus muscle cross sections stained for γH2AX, DAPI, and dystrophin. Nuclei inside the dystrophin border were classified as myonuclei (yellow arrow) and those outside the fiber border were classified as interstitial nuclei (white arrow). (C) Quantification of the percentage of γH2AX + myonuclei and γH2AX + interstitial nuclei (n = 5/group). (D) Protein concentrations of circulating SASP factors measured with Magpix (n = 8–12/group) and ELLA (4–5/group) multiplexing platforms. Scale bar, 20 μm. Data represent means ± SD. ∗P < 0.05; ∗∗P < 0.01; ∗∗∗P < 0.001, ∗∗∗∗P < 0.0001, as assessed by unpaired two-tailed t tests.
Figure 6
Figure 6
p21 drives skeletal muscle pathophysiology. (A) Body weight, lean mass, tibia length, and skeletal muscle weights in control and p21OE mice (n = 9–12/group). (B) Representative immunofluorescence images of soleus muscle cross sections stained for dystrophin, myosin heavy chain 1 (Type 1), and myosin heavy chain 2a (Type 2a). (C-E) Quantification of mean cross-sectional area (CSA), fiber type-specific CSA, and fiber type distribution in the soleus (n = 4/group). (F) Representative immunofluorescence images of plantaris muscle cross sections stained for dystrophin and myosin heavy chain 2a (Type 2a). (G-I) Quantification of mean CSA, fiber type-specific CSA, and fiber type distribution in the plantaris (n = 5/group). (J-K) Representative PSR-stained soleus muscle cross sections visualized with brightfield and polarized light microscopy. (L-M) Relative area positive for PSR and red and green emitted light (n = 5/group). (N) Treadmill and grip strength tests (n = 8–12/group). (O) Association between max oxygen consumption rate (OCR) in muscle fiber mitochondria and distance traveled in the treadmill test (n = 14; P = 0.0479). Scale bars, 20 μm for B and F and 50 μm for J and K. Data represent means ± SD. ∗P < 0.05; ∗∗P < 0.01; ∗∗∗P < 0.001, ∗∗∗∗P < 0.0001, as assessed by unpaired two-tailed t tests.

References

    1. Baker D.J., Childs B.G., Durik M., Wijers M.E., Sieben C.J., Zhong J., et al. Naturally occurring p16(Ink4a)-positive cells shorten healthy lifespan. Nature. 2016;530(7589):184–189. - PMC - PubMed
    1. Childs B.G., Baker D.J., Wijshake T., Conover C.A., Campisi J., Deursen J.M.v. Senescent intimal foam cells are deleterious at all stages of atherosclerosis. Science. 2016;354(6311):472–477. - PMC - PubMed
    1. Farr J.N., Fraser D.G., Wang H., Jaehn K., Ogrodnik M.B., Weivoda M.M., et al. Identification of senescent cells in the bone microenvironment. Journal of Bone and Mineral Research. 2016;31(11):1920–1929. - PMC - PubMed
    1. Lewis-McDougall F.C., Ruchaya P.J., Domenjo-Vila E., Shin Teoh T., Prata L., Cottle B.J., et al. Aged-senescent cells contribute to impaired heart regeneration. Aging Cell. 2019;18(3) - PMC - PubMed
    1. Coppé J.P., Patil C.K., Rodier F., Sun Y., Muñoz D.P., Goldstein J., et al. Senescence-associated secretory phenotypes reveal cell-nonautonomous functions of oncogenic RAS and the p53 tumor suppressor. PLoS Biol. 2008;6(12):2853–2868. - PMC - PubMed

Publication types