Effects of air pollution and weather on the initial COVID-19 outbreaks in United States, Italy, Spain, and China: A comparative study
- PMID: 36509703
- PMCID: PMC9877606
- DOI: 10.1111/risa.14080
Effects of air pollution and weather on the initial COVID-19 outbreaks in United States, Italy, Spain, and China: A comparative study
Abstract
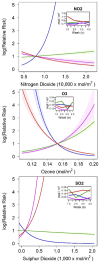
Contrasting effects have been identified in association of weather (temperature and humidity) and pollutant gases with COVID-19 infection, which could be derived from the influence of lockdowns and season change. The influence of pollutant gases and climate during the initial phases of the pandemic, before the closures and the change of season in the northern hemisphere, is unknown. Here, we used a spatial-temporal Bayesian zero-inflated-Poisson model to test for short-term associations of weather and pollutant gases with the relative risk of COVID-19 disease in China (first outbreak) and the countries with more cases during the initial pandemic (the United States, Spain and Italy), considering also the effects of season and lockdown. We found contrasting association between pollutant gases and COVID-19 risk in the United States, Italy, and Spain, while in China it was negatively associated (except for SO2 ). COVID-19 risk was positively associated with specific humidity in all countries, while temperature presented a negative effect. Our findings showed that short-term associations of air pollutants with COVID-19 infection vary strongly between countries, while generalized effects of temperature (negative) and humidity (positive) with COVID-19 was found. Our results show novel information about the influence of pollution and weather on the initial outbreaks, which contribute to unravel the mechanisms during the beginning of the pandemic.
Keywords: SARS-CoV-2; environmental quality; infection risk; pollutant gases; relative humidity; temperature.
© 2022 Society for Risk Analysis.
Figures


References
-
- Ahn, K.‐H. (2020). Coupled annual and daily multivariate and multisite stochastic weather generator to preserve low‐ and high‐frequency variability to assess climate vulnerability. Journal of Hydrology, 581, 124443. 10.1016/j.jhydrol.2019.124443 - DOI
-
- Alwan, N. A. , Burgess, R. A. , Ashworth, S. , Beale, R. , Bhadelia, N. , Bogaert, D. , Dowd, J. , Eckerle, I. , Goldman, L. R. , Greenhalgh, T. , Gurdasani, D. , Hamdy, A. , Hanage, W. P. , Hodcroft, E. B. , Hyde, Z. , Kellam, P. , Kelly‐Irving, M. , Krammer, F. , Lipsitch, M. , … Ziauddeen, H. (2020). Scientific consensus on the COVID‐19 pandemic: We need to act now. The Lancet, 396(10260), e71–e72. 10.1016/S0140-6736(20)32153-X - DOI - PMC - PubMed
-
- Auler, A. C. , Cássaro, F. A. M. , da Silva, V. O. , & Pires, L. F. (2020). Evidence that high temperatures and intermediate relative humidity might favor the spread of COVID‐19 in tropical climate: A case study for the most affected Brazilian cities. Science of The Total Environment, 729, 139090. 10.1016/j.scitotenv.2020.139090 - DOI - PMC - PubMed
Publication types
MeSH terms
Substances
LinkOut - more resources
Full Text Sources
Medical
Miscellaneous

