

Photosynthesis - beyond the leaf
- PMID: 36509710
- PMCID: PMC10953325
- DOI: 10.1111/nph.18671
Photosynthesis - beyond the leaf
Abstract
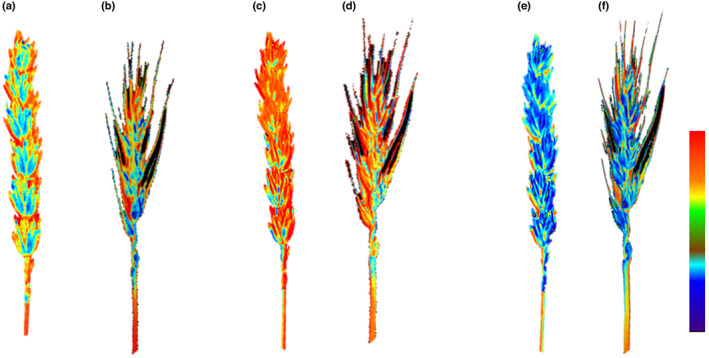
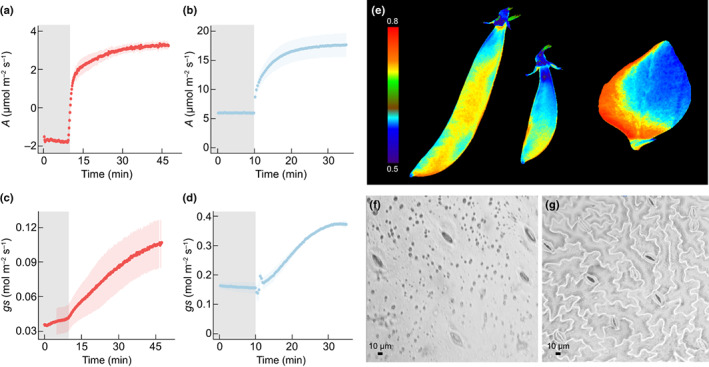
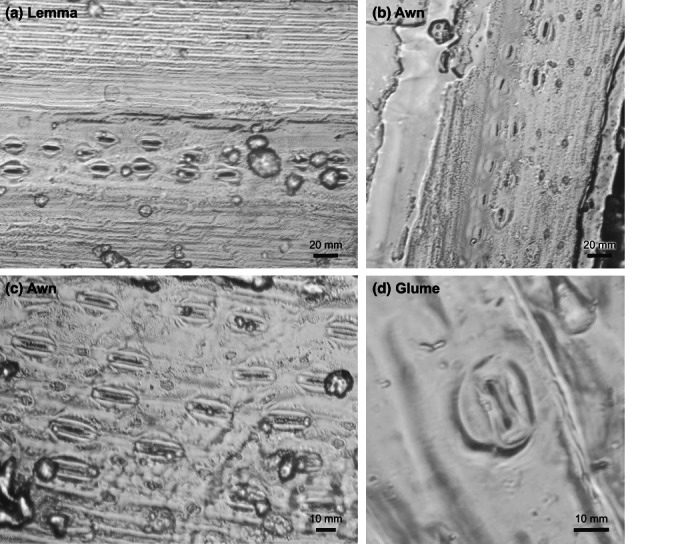
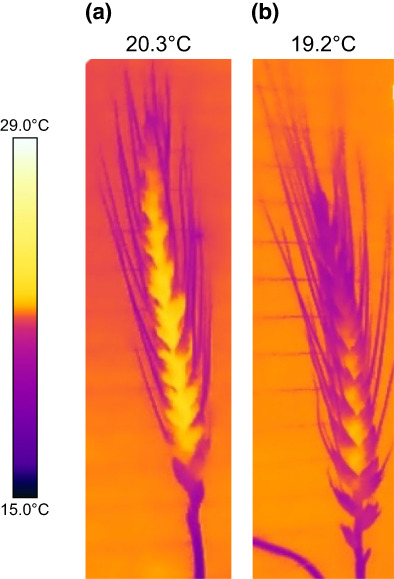
Although leaves are considered the main site for photosynthesis, other green nonfoliar tissues can carry out considerable amounts of photosynthetic carbon assimilation. With photosynthesis, a potential target for improving crop productivity, physiology and contribution of nonfoliar tissues to overall plant carbon acquisition is gaining increasing attention. This review will provide an overview of nonfoliar photosynthesis, the role of stomata in these tissues and methodologies for quantification and the contribution to overall carbon gain.
Keywords: net CO2 assimilation rate (A); nonfoliar photosynthesis; stomatal conductance (gs); stomatal density; wheat ears.
© 2022 The Authors. New Phytologist © 2022 New Phytologist Foundation.
Conflict of interest statement
None declared.
Figures
References
-
- Araus JL, Sanchez‐Bragado R, Vicente R. 2021. Improving crop yield and resilience through optimization of photosynthesis: panacea or pipe dream? Journal of Experimental Botany 72: 3936–3955. - PubMed
-
- Bertolino LT, Caine RS, Zoulias N, Yin X, Chater CCC, Biswal A, Quick WP, Gray JE. 2022. Stomatal development and gene expression in rice florets. Plant and Cell Physiology 63: 1679–1694. - PubMed
-
- Blanke MM, Lenz F. 1989. Fruit photosynthesis. Plant, Cell & Environment 12: 31–46.
-
- Bort J, Brown RH, Araus JL. 1996. Refixation of respiratory CO2 in the ears of C3 cereals. Journal of Experimental Botany 47: 1567–1575.
-
- Brazel AJ, Ó'Maoiléidigh DS. 2019. Photosynthetic activity of reproductive organs. Journal of Experimental Botany 70: 1737–1754. - PubMed
Publication types
MeSH terms
Substances
Grants and funding
LinkOut - more resources
Full Text Sources
