. 2022 Dec 12;13(1):7690.
doi: 10.1038/s41467-022-34889-z.

Brain metastatic outgrowth and osimertinib resistance are potentiated by RhoA in EGFR-mutant lung cancer

Affiliations

Brain metastatic outgrowth and osimertinib resistance are potentiated by RhoA in EGFR-mutant lung cancer

Sally J Adua et al. Nat Commun. .

Abstract

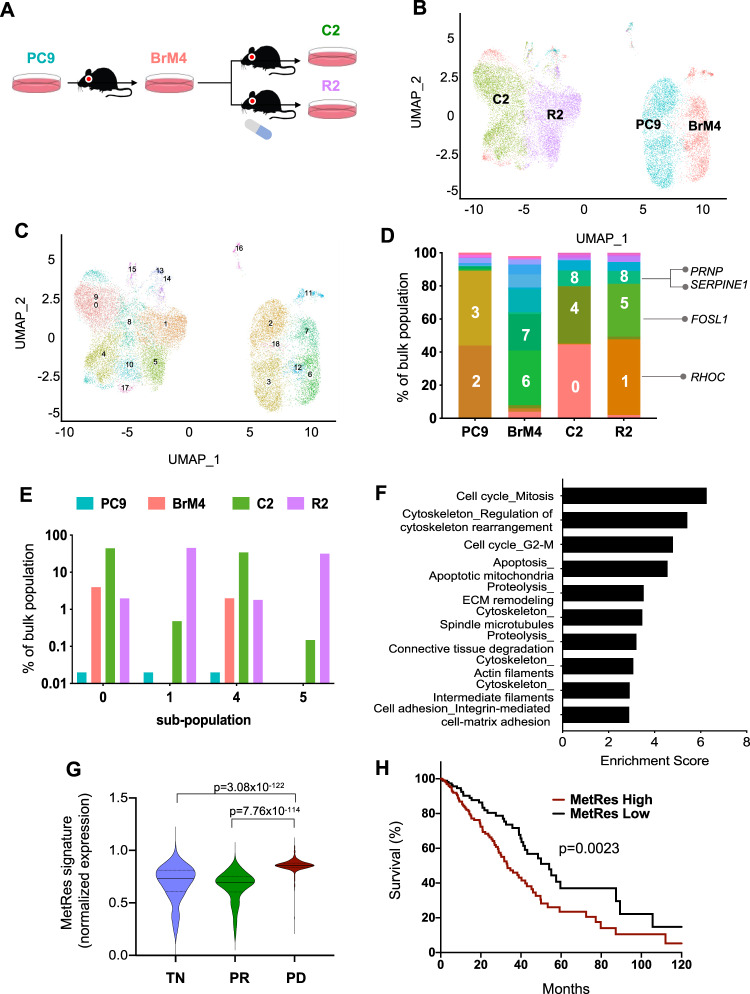
The brain is a major sanctuary site for metastatic cancer cells that evade systemic therapies. Through pre-clinical pharmacological, biological, and molecular studies, we characterize the functional link between drug resistance and central nervous system (CNS) relapse in Epidermal Growth Factor Receptor- (EGFR-) mutant non-small cell lung cancer, which can progress in the brain when treated with the CNS-penetrant EGFR inhibitor osimertinib. Despite widespread osimertinib distribution in vivo, the brain microvascular tumor microenvironment (TME) is associated with the persistence of malignant cell sub-populations, which are poised to proliferate in the brain as osimertinib-resistant lesions over time. Cellular and molecular features of this poised state are regulated through a Ras homolog family member A (RhoA) and Serum Responsive Factor (SRF) gene expression program. RhoA potentiates the outgrowth of disseminated tumor cells on osimertinib treatment, preferentially in response to extracellular laminin and in the brain. Thus, we identify pre-existing and adaptive features of metastatic and drug-resistant cancer cells, which are enhanced by RhoA/SRF signaling and the brain TME during the evolution of osimertinib-resistant disease.


Conflict of interest statement

D.X.N. received research funding from AstraZeneca Inc. V.C. received consulting fees from Monteris Medical Inc and Clearpoint Medical Inc. K.P. is co-inventor on a patent licensed to Molecular MD for EGFR T790M mutation testing (through MSKCC). K.P. has received Honoraria/Consulting fees from Janssen, Takeda, NCCN, Novartis, Merck, AstraZeneca, Tocagen, Maverick Therapeutics, Dynamo Therapeutics, Halda and research support from AstraZeneca, Kolltan, Boehringer Ingelheim, Roche, D2G Oncology and Symphogen. H.H., N.S., M.A.M., N.C., R.J.A.G., D.C., P.S. are AstraZeneca employees and own company stocks and shares. The remaining authors declare no competing interests.

Figures

Fig. 1
Fig. 1. Exposure to the brain TME promotes osimertinib persistence and resistance.
A H1975 cells were injected into the cranium of mice and then treated with vehicle or osimertinib three days later. Tumor burden was then measured by bioluminescence imaging (BLI) and bioluminescent units (BLU) plotted over time. N = 3 animals for vehicle, and N = 7 animals for osimertinib. Data presented as mean values +/− SEM. P-value calculated based on area under the curve (AUC) by Mann–Whitney (two-sided). B Experimental design in which osimertinib-resistant H1975 brain tumor cells were re-transplanted directly into the brains or hind flanks of treatment-naïve mice. C Waterfall plot of data from the experiment in B. Shown are % tumor burden changes of transplanted cells from Day 0 to Day 10–14 of treatment with osimertinib. Cranial tumor burden is determined by brain BLI and subcutaneous tumor burden is determined by flank tumor volume. N = 8 mice with cranial transplant, and N = 6 mice with subcutaneous transplant. P-value calculated by Mann–Whitney (two-sided). D PC9-BrM4 cells were injected into the arterial circulation of mice. Animals were then treated with vehicle or osimertinib after 23–51 days, and cranial and extracranial metastasis growth from the time of treatment were measured. For each animal, tumor burden is determined by BLI at a given timepoint and is normalized to BLI at Day 0 of treatment. N = 11 animals per group. Data presented as mean values +/− SEM. P-value calculated based on AUC by Mann–Whitney (two-sided). E Representative animal from (D) with confirmed brain parenchymal metastasis. Depicted is the subsequent isolation of C2 and R2 cell populations from brain metastases after 2 rounds of in vivo selection under vehicle or osimertinib treatment. F IC50 of osimertinib in C2 and R2 cells was calculated after 72 h of treatment in vitro. N = 3 samples per group. Data is representative of 2 independent experiments. Data presented as mean values +/− SEM. P-value calculated by t-test (two-sided). G Cranial tumor growth of mice with brain metastases treated with osimertinib was measured and plotted as in D. N = 4 animals for C2, and N = 15 animals for R2. Data presented as mean values +/− SEM. P-value calculated based on AUC by Mann–Whitney (two-sided). H Representative images from G at Day 0, 6, and 34 of osimertinib treatment.
Fig. 2
Fig. 2. Long-term osimertinib resistance in the brain is independent of drug distribution or lack of target inhibition.
A Representative H&E images (top) and MS images (bottom) of adjacent sections of brains harvested from mice with established C2 and R2 brain metastases treated with a single dose of osimertinib (“early”), or R2 treated with osimertinib continuously for 59 days (“late”). MS images are shown for osimertinib recorded as [M + H]+ at m/z 500.2764. MS images are also shown for a control brain, without osimertinib treatment. Arrows in C2 and R2 “early” images show small areas of metastases, while metastatic cells in R2 “late” were widely dispersed in the cortex. Scale bar indicates 2 mm. Spatial resolution of MSI experiments is 100 µm. B Relative abundance of osimertinib (measured in arbitrary units) in tumor tissue. N = 6 animals for C2 early, N = 5 animals for R2 early, and N = 3 animals for R2 late. Each point on the plot represents the average abundance for each mouse. All brains were collected 2 h after the last dose of osimertinib. Data presented as mean values +/− SEM. P-value calculated by t-test (two-sided). C pEGFR immunostaining of C2 and R2 brain metastases treated with vehicle or osimertinib for 3 days (“early”) or 37–43 days (“late”). Brains were collected 6 h after the last osimertinib dose. Scale bar indicates 100 μm. A representative image of one experiment is presented. Early: C2-vehicle (19 tumors/2 mice), C2-osimertinib (22 tumors/2 mice), R2-vehicle (21 tumors/2 mice), R2-osimertinib (24 tumors/2 mice), Late: C2-osimertinib (44 tumors/3 mice), R2-osimertinib (18 tumors /1 mouse).
Fig. 3
Fig. 3. Molecular features of metastasis and drug resistance are co-expressed in pre-existing NSCLC cell populations.
A Scheme of in vivo brain metastatic selection yielding PC9-BrM4, C2, and R2 bulk cell populations from the parental PC9 line. B scRNA-seq Uniform Manifold Approximation and Projection (UMAP) analysis of ~6000 cells from each of the bulk cell populations in A. C Same cells in B were re-colored based on distinct cell sub-populations as defined by UMAP analysis. D Stacked graph indicating the % of the sub-populations identified in C within the parental PC9, PC9-BrM4, C2, and R2 bulk populations. E Bar graph (log- scaled) plotting the % of C2 or R2 enriched sub-populations across the PC9, PC9-BrM4, C2, and R2 bulk populations. F Pathways most significantly upregulated in R2 enriched cell sub-populations (1, 5, and 8) compared to the C2 cells based on scRNA-seq analysis. Enrichment score is calculated by Metacore and plotted as –log10(P-value). G Differential mean expression of the dual Metastasis-Resistance (MetRes) signature is shown as a violin plot for single tumor cells collected from EGFR-mutant NSCLC patients (N = 20 patients). TN = treatment-naïve patients (N = 457 cells). PR = Patients with partial response after systemic therapy (N = 557 cells). PD = patients with progressive disease after systemic therapy (N = 1088 cells). P-value calculated by Welch t-test (two-sided). H Human LUADs from TCGA (N = 449) were classified as “high” or “low” based on whether expression of the MetRes signature was above or below the median, respectively. Kaplan–Meier curves were generated for the incidence of death of “high” vs. “low” groups. P-value calculated by log-rank test. The MetRes signature was generated for each sample (single cells in G; bulk tumors in H) by calculating the average expression of all MetRes genes identified in Supplementary Data 2.
Fig. 4
Fig. 4. Features of brain metastatic and drug-resistant cancer cells are enhanced in vivo.
A “Early” whole brain tissues were collected after three days of continuous treatment and “late” brain tissues 34–58 days after osimertinib treatment. All samples were collected 6 h after the last dose of osimertinib. Heatmap depicts hierarchical clustering of the 847 tumor cell-specific genes that are significantly differentially expressed between the R2 and C2 brain metastases in both “early” and “late” in vivo samples. Red vertical bars denote genes that are preferentially induced or repressed in R2 cells when compared to C2 cells in vivo. N = 3 (in vitro, C2 early/vehicle), N = 4 (R2 early and late; C2 early/osi and late). B Gene set enrichment analysis result for GO_REGULATION_OF_CYTOSKELETON_ORGANIZATION comparing tumor cell-specific genes expression in early R2 to early C2 in vivo samples. C Venn diagram depicting the intersection between genes identified in A and the MetRes signature. DF Relative expression of the indicted genes was measured by species-specific qPCR and by comparing R2 vs. C2 samples in vitro and in vivo that were treated with vehicle or osimertinib. N = 3 (in vitro, C2 early/vehicle), N = 4 (R2 early and late; C2 early/osi and late). Data presented as mean values +/− SEM. P-value calculated by ANOVA. G, H Relative expression of the indicted genes was measured by species-specific qPCR in H1975 tumor cells grown in vitro or in vivo and treated with vehicle or osimertinib. N = 3 biological replicates for all conditions except in vivo vehicle N = 4. Data was normalized to HPRT and plotted with SEM. IJ Relative expression of the indicted genes was measured in the PDX model YU-006 as in G, H. N = 4 tumors for vehicle, and N = 5 tumors for osimertinib. For GJ, Data presented as mean values +/− SEM and P-values calculated by Welch’s t-test (two-sided).
Fig. 5
Fig. 5. Re-modeling and co-option of the brain vasculature correlates with residual disease.
A Representative images of hematoxylin-eosin- (H&E-) stained brain tissue sections from mice with C2 brain metastases treated with vehicle or osimertinib and collected at “Early” or “Late” timepoints as in Fig. 4A. Scale bar indicates 100 μm. Inset is an expanded view of Late sample. White arrow indicates brain perivascular residual tumor cells in osimertinib-treated animal. Representative images from Vehicle (4 tumors/2 mice), Early (4 tumors/2 mice), Late residual (8 tumors/3 mice). B Representative images of C2 brain metastasis tissue (N = 12 images from 3 mice) collected as in A and subjected to immunofluorescent (IF) staining for nuclei (DAPI; blue), tumor cells (GFP; green), laminin (red), and vasculature (CD34; turquoise). Scale bar indicates 100 μm. C The number of GFP-positive C2 tumor cells adjacent to laminin-positive micro-vessels were manually counted from images captured as in B, graphed as a percentage of total tumor cells, and presented as mean values +/− SEM. N = 12 images of 3 animals per group. P-values calculated by Welch’s t-test (two-sided). D, E Percentage of phospho-histone H3 (pHH3)-positive tumor cells was quantified as in C. C2 (gray): vehicle early, N = 8; osimertinib early, N = 73; osimertinib late, N = 82. R2 (maroon): vehicle early N = 76, osimertinib early N = 69, osimertinib late N = 157, where each N = an independent area of different tumors. Images are from 3 animals per group. Data is presented as mean values +/− SEM. P-values for IF quantification calculated by Mann–Whitney (two-sided). F Representative IF images (from DE) for pHH3 in the indicated samples from mouse brain with metastasis. Arrows denote pHH3-positive tumor cells.
Fig. 6
Fig. 6. Laminin and RhoA promote the outgrowth of residual metastatic cells under osimertinib treatment in vitro.
A C2 and R2 cells were cultured on standard plates (Control) or plates coated with the indicated ECM proteins and treated with vehicle or 160 nM osimertinib. Relative tumor cell outgrowth was measured by BLI 18–21 days after plating. All values are normalized to C2 vehicle-treated on control plate. N = 3 biological replicates. Data is presented as mean values +/− SEM. P-values calculated by t-test (two-sided). B Representative images of samples in A grown on laminin and stained with crystal violet. C R2 cells expressing doxycycline- (Dox-) inducible short hairpins RNAs (shRNAs) against a control sequence (shCntrl) or independent shRNAs targeting RHOA (shRHOA−1 and shRHOA−2) were cultured in the absence or presence of Dox. RHOA was measured by qPCR and normalized to HPRT expression. Data is presented as mean values +/− SD. A representative of two independent experiments is shown. D R2 cells with the indicated shRNAs were cultured in the presence of Dox on laminin-coated plates and treated with vehicle or osimertinib. Relative tumor cell growth was measured as in A. All values are normalized to R2 shCntrl vehicle-treated on control plates. N = 3. Data from a representative experiment (of 3 separate experiments) is presented as mean values +/− SEM. P-values calculated by t-test (two-sided).
Fig. 7
Fig. 7. RhoA controls SRF protein levels and the expression of brain metastasis and drug resistance genes.
A C2 or R2 cells were cultured over 18 days in the presence of osimertinib on control or laminin-coated plates. Lysates were then subjected to western blotting for the indicated proteins. A representative blot from two independent experiments is shown. B R2 cells expressing the indicated shRNAs were cultured as in A. Lysates were then subjected to western blotting for SRF or tubulin. A representative blot from two independent experiments is shown. C R2 cells expressing the indicated shRNAs were cultured on laminin-coated plates with Dox and serum starved for 12 h. Expression of SERPINE1, FOSL1, and KRT13 were measured by qPCR, normalized to HPRT expression and data was plotted with SD. A representative of two independent experiments is shown. N = 3 technical replicates. D R2 cells expressing the indicated sgRNAs were cultured on laminin-coated plates and treated as in B. Expression of FOSL1 were quantified as in C. N = 3 technical replicates. Data presented as mean +/− SD and representative from 2 independent experiments for sgSRF#2 and 3 independent experiments for sgSRF#1.
Fig. 8
Fig. 8. RhoA inhibition decreases brain metastatic outgrowth and osimertinib resistance in vivo.
A Kaplan–Meier analysis of brain metastasis incidence following intracardiac injection of R2 shCntrl or R2 shRHOA−2 cells into mice that were maintained on a Dox food diet and treated with either vehicle or osimertinib starting 12 days after injection. Brain metastasis incidence was detected by BLI. N = 10 animals for shCntrl/vehicle, N = 16 animals for shCntrl/osimertinib, N = 12 animals for shRHOA-2/vehicle, and N = 17 animals for shRHOA-2/osimertinib. P-values of shRHOA groups (compared to shCntrl+Vehicle) calculated by log-rank test. B Representative BLI images of animals with median cranial tumor burden from A for each group at the indicated timepoint. C Dot plot of ex vivo brain BLI from vehicle-treated R2 shCntrl and R2 shRHOA-2 mice harvested at Day 40. N = 9 animals for shCntrl, and N = 8 animals for shRHOA-2. Data is presented as mean values +/− SEM. P-value calculated by Mann–Whitney (two-sided). D Dot plot of ex vivo brain BLI from osimertinib-treated R2 shCntrl and R2 shRHOA−2 mice harvested at Day 47. N = 10 animals per group. Data is presented as mean values +/− SEM. P-value was calculated by Welch’s t-test (two-sided). For C and D, images of brains are from animals with median tumor BLI signal.

References

    1. Cagney DN, et al. Incidence and prognosis of patients with brain metastases at diagnosis of systemic malignancy: a population-based study. Neuro Oncol. 2017;19:1511–1521. doi: 10.1093/neuonc/nox077. - DOI - PMC - PubMed
    1. Stelzer KJ. Epidemiology and prognosis of brain metastases. Surg. Neurol. Int. 2013;4:S192–S202. doi: 10.4103/2152-7806.111296. - DOI - PMC - PubMed
    1. Shin DY, et al. EGFR mutation and brain metastasis in pulmonary adenocarcinomas. J. Thorac. Oncol. 2014;9:195–199. doi: 10.1097/JTO.0000000000000069. - DOI - PubMed
    1. Rangachari D, et al. Brain metastases in patients with EGFR-mutated or ALK-rearranged non-small-cell lung cancers. Lung Cancer. 2015;88:108–111. doi: 10.1016/j.lungcan.2015.01.020. - DOI - PMC - PubMed
    1. Ouyang W, et al. Metachronous brain metastasis in patients with EGFR-mutant NSCLC indicates a worse prognosis. J. Cancer. 2020;11:7283–7290. doi: 10.7150/jca.46462. - DOI - PMC - PubMed

Publication types

MeSH terms