. 2022 Dec 12;13(1):7502.
doi: 10.1038/s41467-022-35266-6.

Sex differences in allometry for phenotypic traits in mice indicate that females are not scaled males

Affiliations

Sex differences in allometry for phenotypic traits in mice indicate that females are not scaled males

Laura A B Wilson et al. Nat Commun. .

Abstract

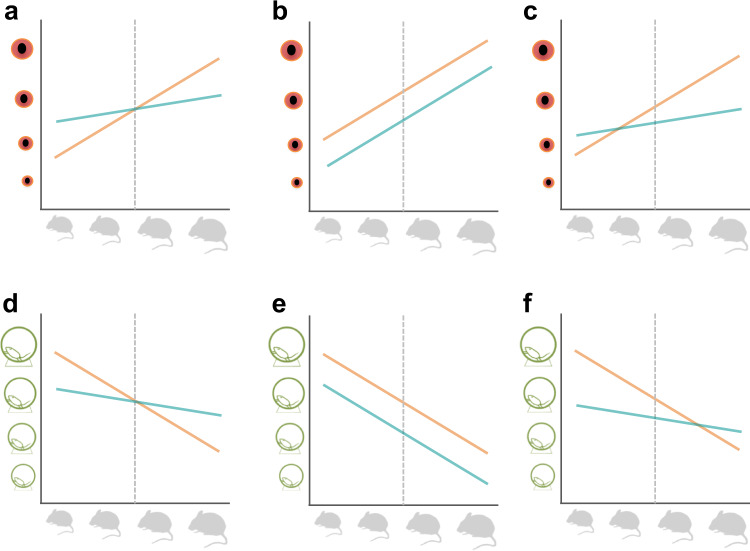
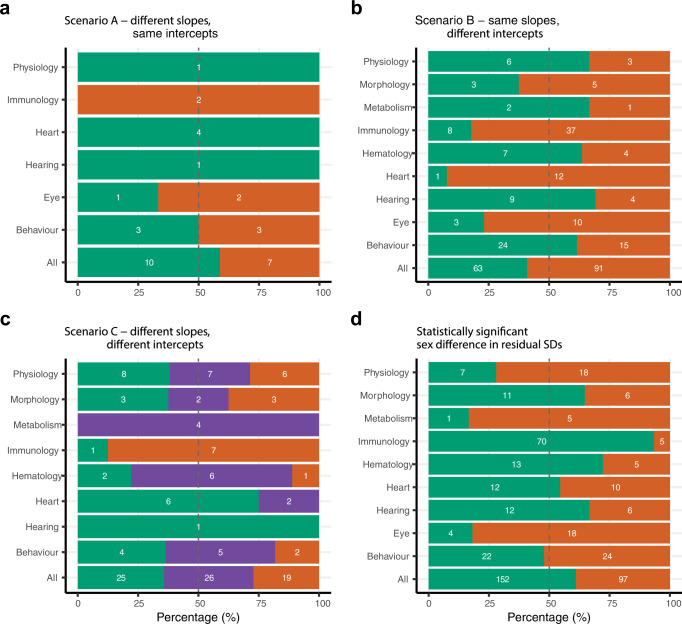
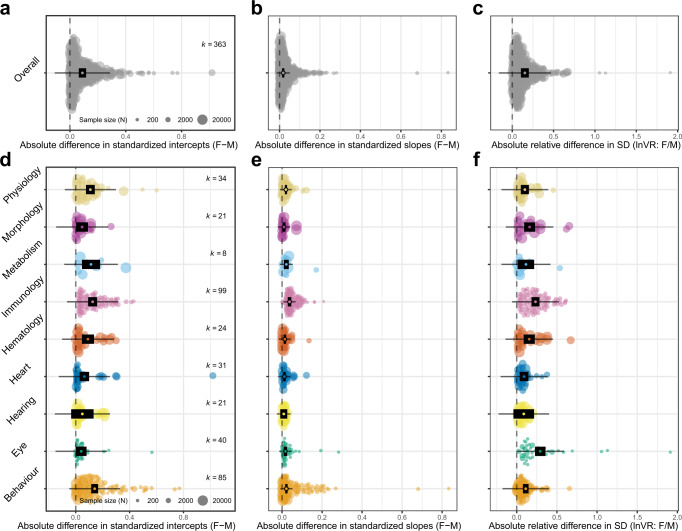
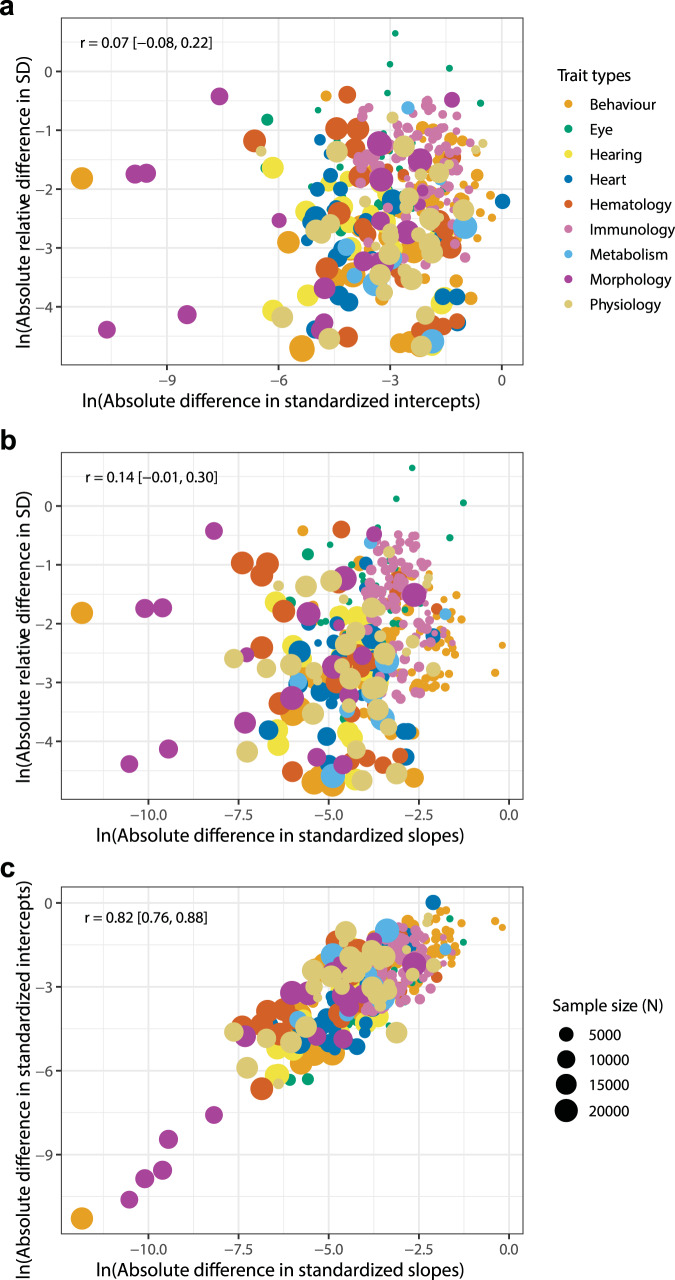
Sex differences in the lifetime risk and expression of disease are well-known. Preclinical research targeted at improving treatment, increasing health span, and reducing the financial burden of health care, has mostly been conducted on male animals and cells. The extent to which sex differences in phenotypic traits are explained by sex differences in body weight remains unclear. We quantify sex differences in the allometric relationship between trait value and body weight for 363 phenotypic traits in male and female mice, recorded in >2 million measurements from the International Mouse Phenotyping Consortium. We find sex differences in allometric parameters (slope, intercept, residual SD) are common (73% traits). Body weight differences do not explain all sex differences in trait values but scaling by weight may be useful for some traits. Our results show sex differences in phenotypic traits are trait-specific, promoting case-specific approaches to drug dosage scaled by body weight in mice.


Conflict of interest statement

The authors declare no competing interests.

Figures

Fig. 1
Fig. 1. Examples of scenarios of sex differences in the allometric relationship between phenotypic trait and body weight.
Top row shows a hypothetical positive relationship between body weight (x-axis) and eye size (y-axis) and the bottom row shows a negative relationship between body size and activity level (y-axis). Body weights are scaled and centred so that the intercept is at the trait mean represented by a grey dashed line. A series of scenarios are illustrated as follows. a The sexes show different positive slopes but the same intercept. b Both sexes have the same positive slope but different intercepts. c The sexes show different positive slopes and different intercepts. d The sexes show different negative slopes but the same intercept. e Both sexes have the same negative slope but different intercepts. f The sexes have different negative slopes and different intercepts.
Fig. 2
Fig. 2. Sex biases for phenotypic traits in mice, arranged in functional groups.
Sex bias represents a greater parameter value (slope, intercept, variance) in one sex compared to the other. Colours represent significant differences in trait values between the sexes (green = male biased, orange = female biased). The number of traits that are either female biased (relative length of orange bars) or male biased (relative length of green bars) are expressed as a percentage of the total number of traits in the corresponding group. Numbers inside the green bars represent the numbers of traits that show male bias within a given group of traits, values inside the orange bars represent the number of female biased traits, and those inside the purple bars represent a combination of female bias (for intercept or slope) and male bias (for intercept or slope). a Differences between the sexes for slope. b Differences between the sexes for intercept. c Differences between the sexes for slope and intercept, including traits with mixed (purple) significant differences (i.e., male-biased significant slope and female-biased significant intercept, or female-biased significant slope and male-biased significant intercept). d Bias in statistically significant difference in variance (residual SD) between the sexes.
Fig. 3
Fig. 3. Orchard plots illustrating results of multivariate meta-analysis.
Orchard plots show model point estimate (black open ellipse) and associated confidence interval (CIs) (thick black horizontal line), 95% prediction intervals (PIs) (thin black horizontal line; PI represents heterogeneity), and individual effect sizes (filled circle), which are scaled by their sample size (N), the number of mice included per trait. The number of effect sizes (number of phenotypic traits) is represented by k. a Overall difference between male and female absolute values for allometric intercept. b Overall difference between male and female absolute values for allometric slope. c Overall difference between male and female values for residual variance (SD). d Difference between male and female values for allometric intercept, separated by functional group. e Difference between male and female values for allometric slope, separated by functional group. f Difference between male and female values for residual variance (SD), separated by functional group.
Fig. 4
Fig. 4. Bivariate ordinations of log absolute difference between males and females for allometric variables.
Plots show biological traits collated into nine functional groups (i.e., trait types, represented as different circle colours). Individual effect sizes (circles) are scaled by their sample size (N), the number of mice included per trait. a Relationship between allometric intercept and residual SD. b Relationship between allometric slope and residual SD. c Relationship between allometric slope and intercept.

Similar articles

Cited by

References

    1. Holdcroft, A. Gender bias in research: how does it affect evidence based medicine? Report No. 0141-0768 (SAGE Publications, London, England, UK, 2007). - PMC - PubMed
    1. Mogil, J. S. & Chanda, M. L. The case for the inclusion of female subjects in basic science studies of pain. PAIN117, 1–5 (2005). - PubMed
    1. Rogers WA, Ballantyne AJ. Exclusion of women from clinical research: myth or reality. Mayo Clin. Proc. 2008;83:536–542. doi: 10.1016/S0025-6196(11)60725-8. - DOI - PubMed
    1. Kim AM, Tingen CM, Woodruff TK. Sex bias in trials and treatment must end. Nature. 2010;465:688–689. doi: 10.1038/465688a. - DOI - PubMed
    1. Beery AK, Zucker I. Sex bias in neuroscience and biomedical research. Neurosci. Biobehav. Rev. 2011;35:565–572. doi: 10.1016/j.neubiorev.2010.07.002. - DOI - PMC - PubMed

Publication types