. 2022 Dec 12;12(1):21459.
doi: 10.1038/s41598-022-11698-4.

Structural differences in the semantic networks of younger and older adults

Affiliations

Structural differences in the semantic networks of younger and older adults

Dirk U Wulff et al. Sci Rep. .

Abstract

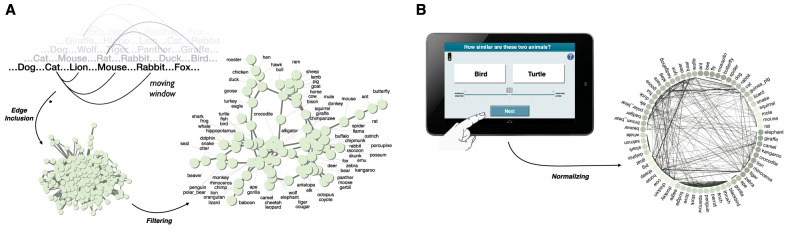
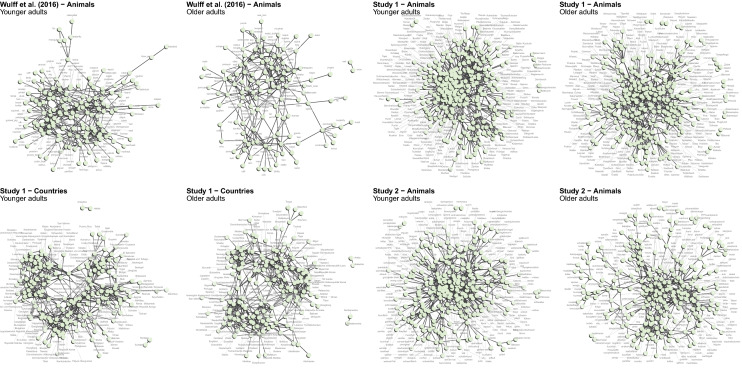
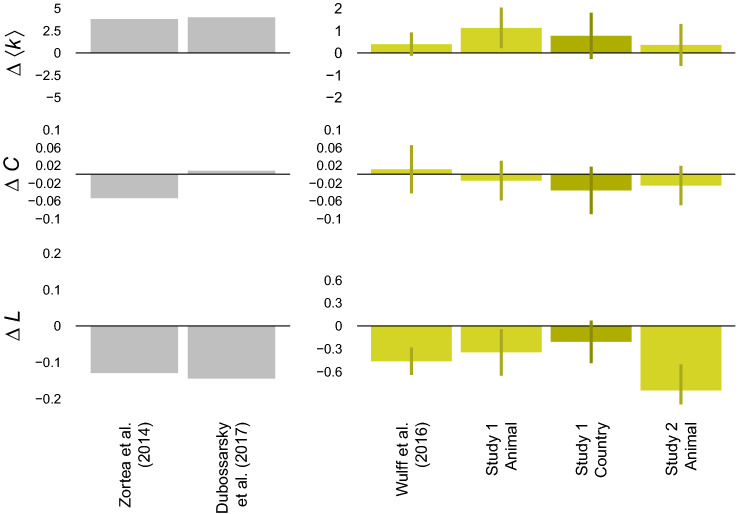
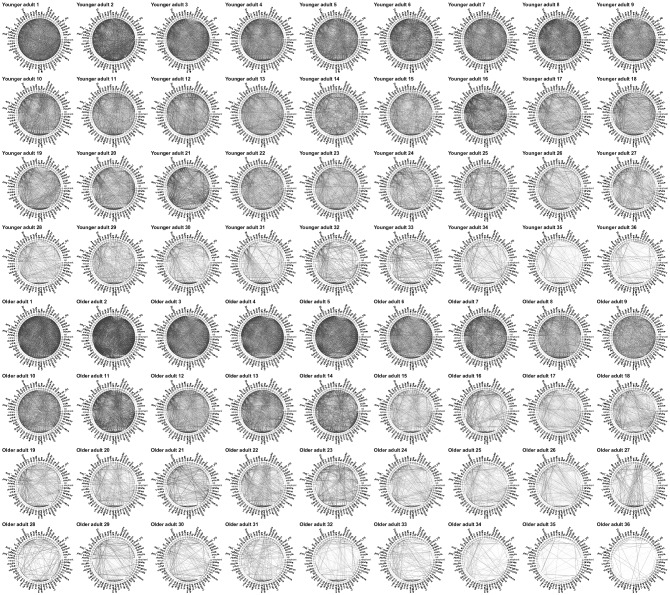
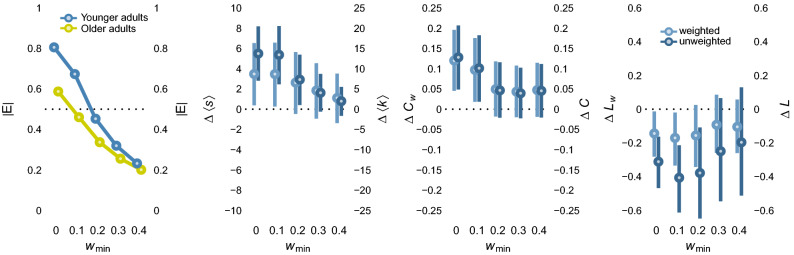
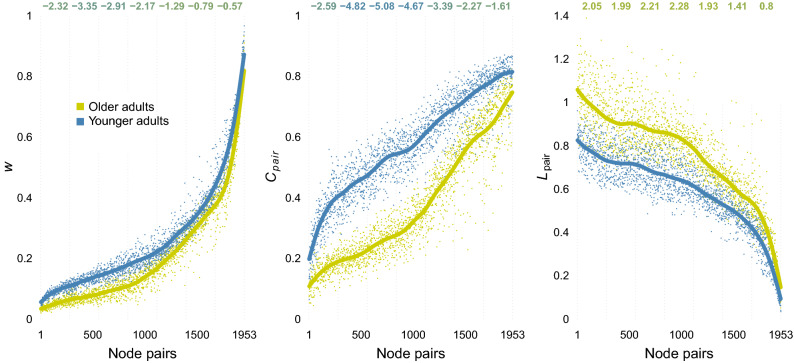
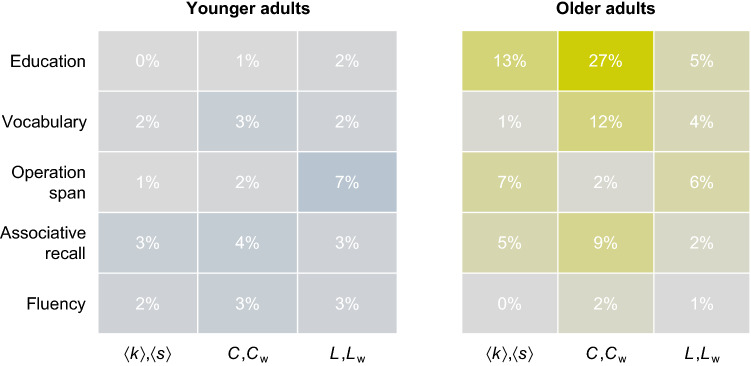
Cognitive science invokes semantic networks to explain diverse phenomena, from memory retrieval to creativity. Research in these areas often assumes a single underlying semantic network that is shared across individuals. Yet, recent evidence suggests that content, size, and connectivity of semantic networks are experience-dependent, implying sizable individual and age-related differences. Here, we investigate individual and age differences in the semantic networks of younger and older adults by deriving semantic networks from both fluency and similarity rating tasks. Crucially, we use a megastudy approach to obtain thousands of similarity ratings per individual to allow us to capture the characteristics of individual semantic networks. We find that older adults possess lexical networks with smaller average degree and longer path lengths relative to those of younger adults, with older adults showing less interindividual agreement and thus more unique lexical representations relative to younger adults. Furthermore, this approach shows that individual and age differences are not evenly distributed but, rather, are related to weakly connected, peripheral parts of the networks. All in all, these results reveal the interindividual differences in both the content and the structure of semantic networks that may accumulate across the life span as a function of idiosyncratic experiences.


Conflict of interest statement

The authors declare no competing interests.

Figures

Figure 1
Figure 1
Methodological approach. Panel (A) illustrates the two steps, edge inclusion and filtering, involved in inferring networks from semantic fluency sequences. For details see Materials and Methods. The resulting network is based on 142 sequences of the older adults’ group of study 1. To simplify the visualization more conservative inferences settings were employed than used in the analyses reported below. Panel (B) illustrates the creation of networks from similarity ratings by normalizing individuals’ responses to the range of 0 and 1. The weighted network is based on the average ratings of the older adults’ group of study 3.
Figure 2
Figure 2
Fluency networks. The figure shows the networks estimated for younger and older adults in each of the four data sets analyzed. Labels are not displayed on top of their nodes so as not to obscure the structural characteristics of the network. The figures suggest similarity in the semantic networks of the two age groups, with clustering of semantic-related items in close proximity. For details on the network inference mechanism, see Methods.
Figure 3
Figure 3
Differences in the macroscopic structure of younger and older adults’ fluency networks. Gray bars show the difference between the younger and older adults’ age group in Zortea et al. and that of age 30 and 70 in Dubossarsky et al., respectively. Yellow bars show differences in networks inferred from the four fluency data sets. Error bars show 95% bootstrapped confidence intervals. Note: Δk-Differences in average degrees; ΔC-Difference in average clustering coefficients; ΔL-Difference in average shortest path lengths.
Figure 4
Figure 4
Similarity rating networks. Each individual plot shows the network of one individual under wmin=.1. The first four  rows show the networks of younger adults, the bottom four rows those of older adults. Please note that networks are ordered by network strength to facilitate a visual comparison of between- and within-group variability in network structure. Edges’ weights have been scaled according to w2 to increase visibility. Nodes are ordered and colored according to ten animal categories. These are, starting at 0, African animals (plus kangaroo), large apes, birds, farm animals, fish, forest animals, pets, reptiles, and rodents. Animals names were translated from German.
Figure 5
Figure 5
Differences in the macroscopic structure of younger and older adults’ similarity rating networks. Blue and yellow circles, in panel 1, correspond to younger and older adults, respectively. In panels 2 to 4, light blue circles and dark blue circles correspond to differences between the younger and older adults’ networks derived from weighted and unweighted networks, respectively. Error bars show 95% bootstrapped confidence intervals. Note: |E| - Proportion of edges relative to fully-connected graph; Δs, Δk - Differences in average strengths/degrees (unweighted); ΔCw, ΔC - Difference in average clustering coefficients of weighted/unweighted networks; ΔLw, ΔL - Difference in average shortest path lengths of weighted/unweighted networks.
Figure 6
Figure 6
Comparisons between younger and older adults’ networks across all 1,953 node pairs. The panels show separately for younger (blue) and older (yellow) adults the average edge weights under wmin=0 (left panel), the proportion of triangles that existing edges form with other edges under wmin=.1 (middle panel), and the shortest paths between the nodes wmin=.1 (bottom panel). The numbers on top of each panel show the Cohen’s d (younger–older adults) for bins of 200 node pairs. Note: w—Edge weight; Cpair—Proportion of triangles formed by pair; Lpair—Distance between between nodes in pair.
Figure 7
Figure 7
Shared variances between network structure, education, and cognitive performance. Numbers display the average proportion of shared variance across wmin[0,.1,.2,.3,.4] and weighted and unweighted versions of individuals’ networks. Note: s, k—Differences in average strengths/degrees (unweighted); C, Cw—Difference in average clustering coefficients of weighted/unweighted networks; L, Lw—Difference in average shortest path lengths of weighted/unweighted networks.

Similar articles

Cited by

References

    1. Baronchelli A, Ferrer-i-Cancho R, Pastor-Satorras R, Chater N, Christiansen MH. Networks in cognitive science. Trends Cogn. Sci. 2013;17(7):348–360. doi: 10.1016/j.tics.2013.04.010. - DOI - PubMed
    1. Beer RD. Dynamical approaches to cognitive science. Trends Cogn. Sci. 2000;4(3):91–99. doi: 10.1016/S1364-6613(99)01440-0. - DOI - PubMed
    1. Borge-Holthoefer J, Arenas A. Semantic networks: Structure and dynamics. Entropy. 2010;12(5):1264–1302. doi: 10.3390/e12051264. - DOI
    1. Anderson JR. A spreading activation theory of memory. J. Verbal Learn. Verbal Behav. 1983;22(3):261–295. doi: 10.1016/S0022-5371(83)90201-3. - DOI
    1. Collins AM, Loftus EF. A spreadingactivation theory of semantic processing. Psychol. Rev. 1975;82(6):407. doi: 10.1037/0033-295X.82.6.407. - DOI

Publication types