. 2022 Dec 12;13(1):7692.
doi: 10.1038/s41467-022-35406-y.

Tagging active neurons by soma-targeted Cal-Light

Affiliations

Tagging active neurons by soma-targeted Cal-Light

Jung Ho Hyun et al. Nat Commun. .

Abstract

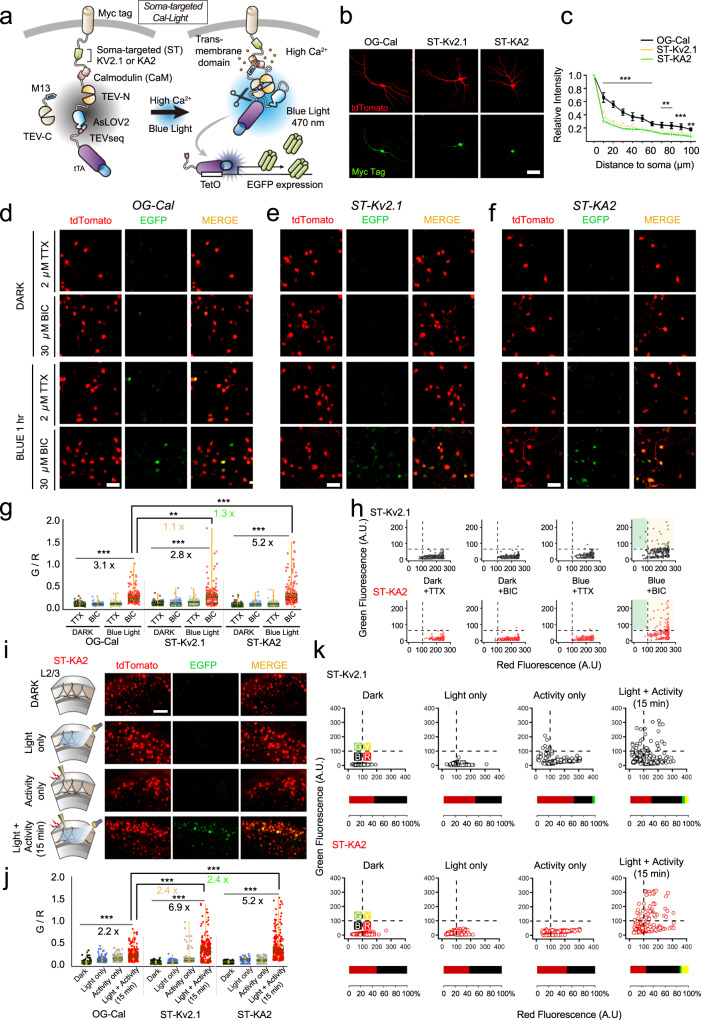
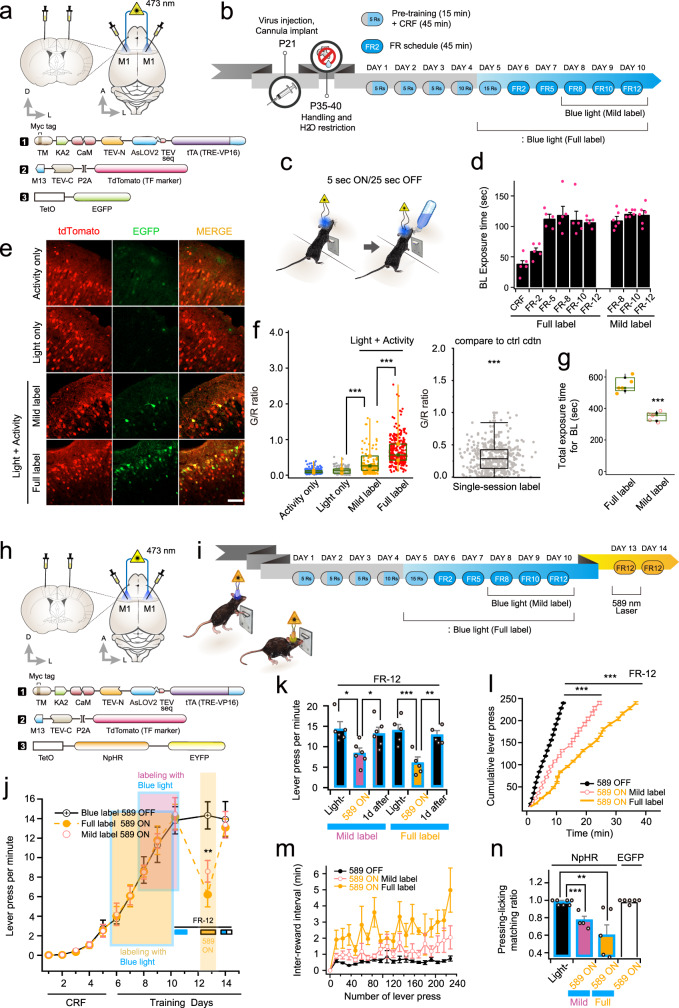
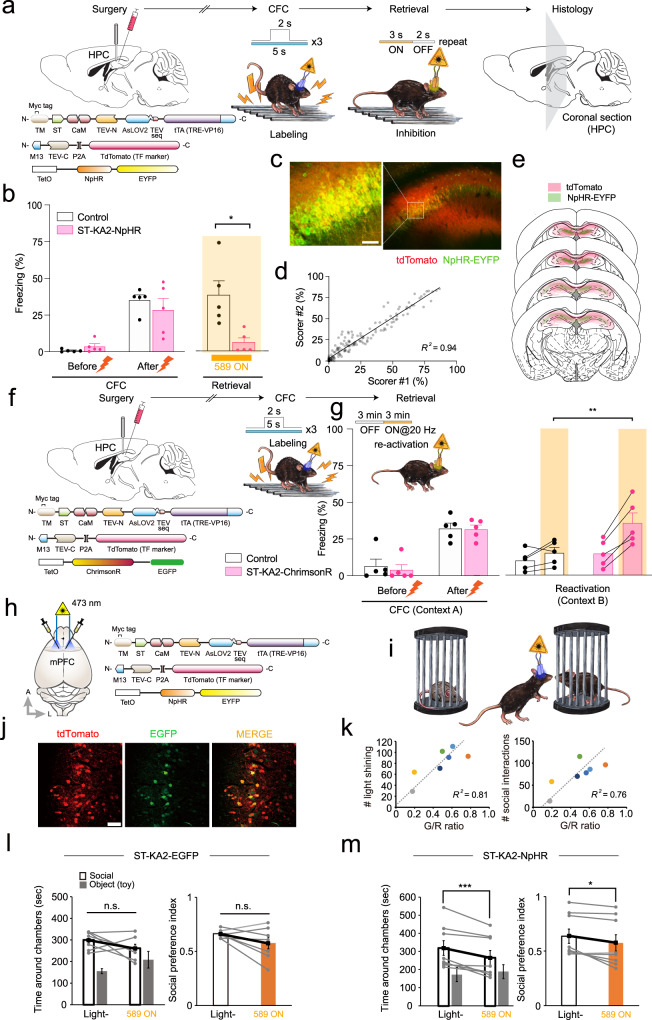
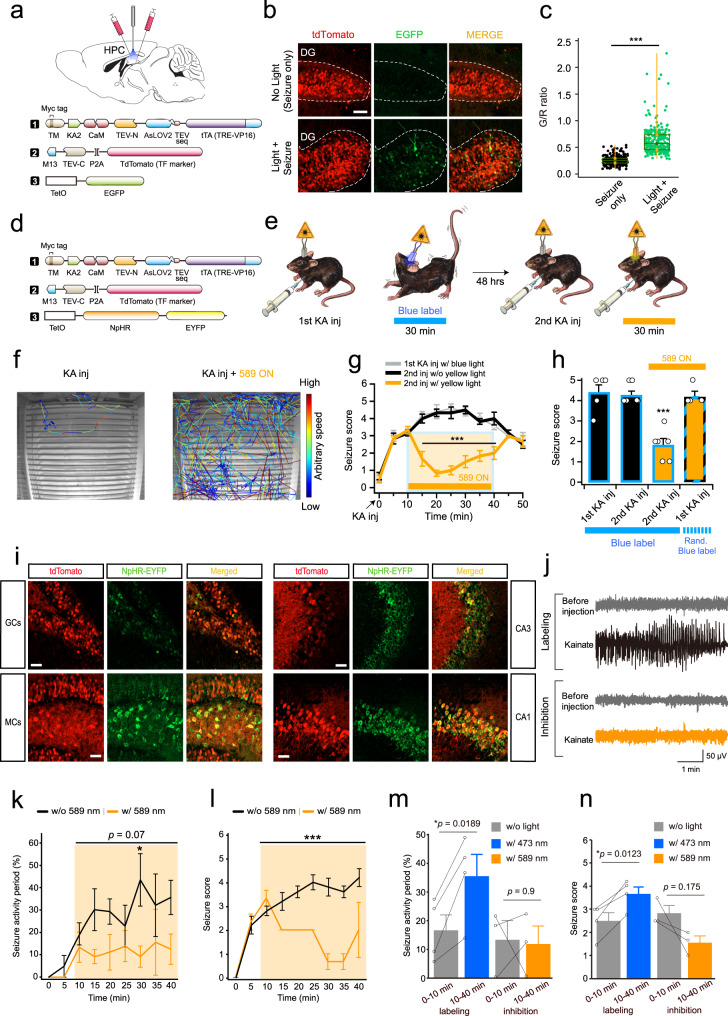
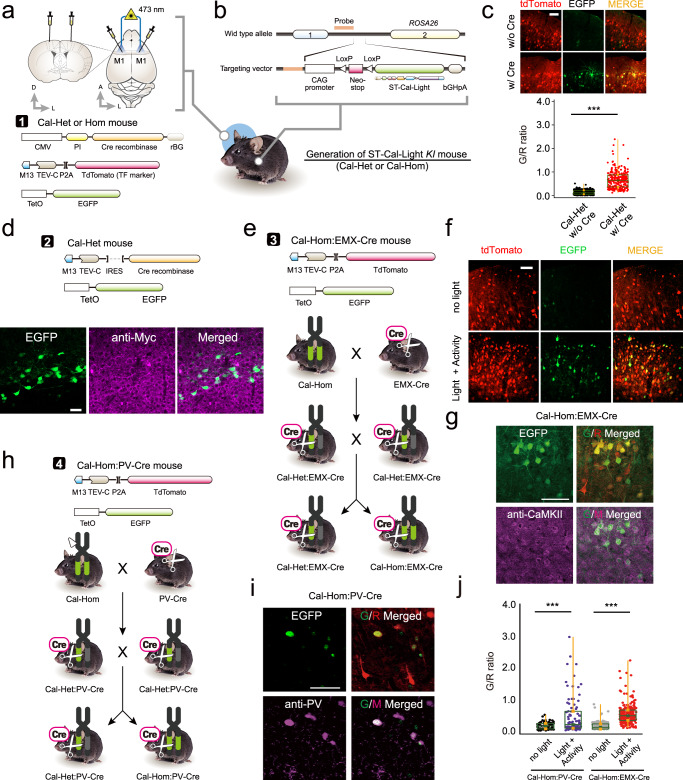
Verifying causal effects of neural circuits is essential for proving a direct circuit-behavior relationship. However, techniques for tagging only active neurons with high spatiotemporal precision remain at the beginning stages. Here we develop the soma-targeted Cal-Light (ST-Cal-Light) which selectively converts somatic calcium rise triggered by action potentials into gene expression. Such modification simultaneously increases the signal-to-noise ratio of reporter gene expression and reduces the light requirement for successful labeling. Because of the enhanced efficacy, the ST-Cal-Light enables the tagging of functionally engaged neurons in various forms of behaviors, including context-dependent fear conditioning, lever-pressing choice behavior, and social interaction behaviors. We also target kainic acid-sensitive neuronal populations in the hippocampus which subsequently suppress seizure symptoms, suggesting ST-Cal-Light's applicability in controlling disease-related neurons. Furthermore, the generation of a conditional ST-Cal-Light knock-in mouse provides an opportunity to tag active neurons in a region- or cell-type specific manner via crossing with other Cre-driver lines. Thus, the versatile ST-Cal-Light system links somatic action potentials to behaviors with high temporal precision, and ultimately allows functional circuit dissection at a single cell resolution.


Conflict of interest statement

The authors declare no competing interests.

Figures

Fig. 1
Fig. 1. Development and verification of soma-targeted Cal-Light.
a Graphical illustration of soma-targeted Cal-Light system. Elevation of Ca2+ concentration in the cytosol causes M13 and CaM protein interaction which causes binding of c- and n-terminus of tobacco etch virus (TEV) protease (TEV-C and TEV-N). When TEV-C and -N fragment bind, they regain proteolytic functions; however, the TEV recognition sequence (TEVseq) is buried inside of AsLOV2 Jα-helix, so TEV protease access to the TEVseq is prohibited. Blue light triggers structural changes of AsLOV2, rendering the TEVseq exposed to the cytosol. Then, TEV protease cleaves out tTA, and gene expression begins. b Confocal images of the cell transfection marker, tdTomato (red), and antibody staining of myc epitope (green). The scale bar indicates 50 μm. c The degree of expression in soma and dendrites. The green-to-red signal (G/R) ratio was normalized to the cell body, and the ratio was measured from the cell body up to 100 μm in dendrites. df Representative images of EGFP reporter gene expression in various conditions. Original Cal-Light (d), ST-KV2.1 (e), and ST-KA2 constructs (f) were transfected in hippocampal culture neurons, and neural activity was controlled by 2 μM TTX or 30 μM bicuculline (Bic). The scale bar indicates 50 μm. g Comparison of gene expression. G/R ratios from individual cells are plotted. An intermittent flash of blue light (1 s ON/9 s OFF) was illuminated for 1 h G/R and was analyzed with one-way ANOVA. Asterisks (**p < 0.01 and ***p < 0.001) indicate Bonferroni post hoc significance. h Scatter plot of G/R. Open circles indicate individual neurons. Yellow-colored area indicates neuronal population with both green and red signals. The green area indicates cells with a green fluorescence alone. i Schematic of experimental conditions. Representative images from each condition (dark, light only, activity only, light + activity) are shown. tdTomato is a transfection marker, and EGFP is a reporter. Scale bars, 80 μm. j Summary graph of the G/R ratio from cells transfected with OG-Cal, ST-Kv2.1, and ST-KA2, respectively. G/R values from individual neurons and a summary box plot chart are superimposed. The magnitude was robustly enhanced when both light and activity were present. k Green and red fluorescence values from individual neurons were plotted. Individual neurons were divided into four groups (green, yellow, red, and black) by the level of red and green fluorescence. The horizontal bar graph represents the percentage of red, black, green, and yellow groups. For all graphs, *,**, and *** indicate p < 0.05, p < 0.001, and p < 0.005, respectively. Box plots show the median, 25th and 75th percentiles, and whiskers show min to max. Error bars indicate s.e.m. Source data and statistics are provided in the Source Data file.
Fig. 2
Fig. 2. Labeling and control of active neurons engaged with lever-pressing behavior.
a ST-KA2 viruses with AAV-TetO-EGFP were bilaterally injected into layer 2/3 of the primary motor cortex. b Schematic mouse training schedule and labeling procedures with blue light. 5Rs, 10Rs, and 15Rs indicate that mice receive five (5Rs), ten (10Rs), and fifteen rewards (15Rs), respectively. c Fiber optics for blue light illumination were implanted in both sides of the primary motor cortex. d Blue light exposure time per training day was measured. tdTomato signal indicates the efficiency of viral injection. Higher green fluorescence was observed as blue light exposure time increases. Scale bars, 100 μm. e When cell labeling is finished, the brain was fixed, and the degree of gene expression was quantified by confocal imaging. f Individual G/R ratios with the box plot chart superimposed. g, A box plot chart for total blue light exposure time at each condition. h Schematic drawing of virus injection and fiber optic implantation (top) and injected three viral constructs (bottom). i Mouse training, labeling by blue light, and halorhodopsin inhibition procedures. Active neurons during lever pressing were labeled by blue light, and their activity was inhibited by 589 light. j Total number of lever presses increased over training days. Periods of blue light labeling were indicated by shaded boxes with different colors (five mice for full labeling, and six mice for mild labeling). The number of lever presses was significantly reduced by a 589 nm laser but fully recovered the following day in the absence of 589 nm light (inset: blue horizontal bar underneath the FR-12 label indicates the last day of training with labeling in the presence of blue light. The yellow horizontal bar indicates the probe-test day in the presence of yellow light throughout the session (2 s ON, 1 s OFF). The bar half-filled with blue indicates the following day in the absence of yellow light but labeled with blue light during training). k, The total lever pressing number was compared before and after 589 nm light, and the following day of the inhibition test. l The number of lever presses was plotted over time to demonstrate how fast animals reach the goal. Note that more time was required to reach 250 lever presses when the 589 nm light is turned on after labeling. m Inter-reward interval was prolonged when the yellow light was turned on. n Summary graph of lever pressing-licking matching ratio. For all graphs, *,**, and *** indicate p < 0.05, p < 0.001, and p < 0.005, respectively. Box-and-whisker plot shows the median, 25th and 75th percentiles, and whiskers show min to max. Error bars indicate s.e.m. Source data and statistics are provided in the Source Data file.
Fig. 3
Fig. 3. Controlling context-dependent fear conditioning and social interaction behavior.
a Schematic illustration of virus injection and fear conditioning experiments. A mixture of viruses expressing ST-KA2, M13-TEV-C, and TetO-NpHR-EYFP was injected into the dorsal hippocampus. Fiber optics were implanted bilaterally above the viral injection site. Short pulses of blue light (5 s × 3 times) were delivered for labeling active neurons, and yellow light was shined during the probe test. Reporter gene expression was confirmed by taking confocal images. b The percentage of freezing was compared before and after conditioning, and with or without 589 nm light during the retrieval period. *p < 0.05. Graphs expressed as mean ± SEM. The sample size presents the number of independent mice. c Representative image of NpHR-EYFP expression. Scale bars, 50 μm. d Freezing score was analyzed by two independent people in a blind manner. The freezing percentage was scored every 10 s and crossed-checked with correlation analysis. e The extent of virus injection and NpHR-EYFP expression is plotted across several coronal sections of the brain. Images illustrate a series of coronal schematics showing the extent of AAV expression (red) and activity-dependent labeling (green). The extents were traced based on fluorescent images taken at low magnification (2.5×) for each animal (n = 5 independent mice). Darkness represents coincidence from different animals. f Schematic illustration of the experimental procedure. Viruses expressing ST-KA2, M13-TEV-C, and TetO-ChrimsonR-EGFP were injected into the dorsal hippocampus CA1 area bilaterally. Short pulses of blue light (5 s × 3 times) were delivered with a 1-min interval for labeling, and 589 nm yellow light was shined for testing behavioral causality. g The percentage of freezing was compared before and after conditioning. During the reactivation session, freezing behavior in a novel context (context B) was compared before and after the delivery of 589 nm light. Reactivation of ST-Cal-Light-labeled neurons was sufficient to trigger freezing in context B. h Virus injection and fiber optic implantation scheme. Viruses were injected into layer 5/6 of the mPFC. i Cartoon for social interaction experiments. Whenever the mouse entered a social zone, a blue laser connected to the fiber optics was switched on. j Sample images of active neuron labeling in the mPFC by ST-Cal-Light. Scale bars, 100 μm. k Graphical demonstration of positive correlation between the number of blue light illumination/social interactions and G/R ratio. Each data point corresponds to one mouse. l When active neurons were labeled with EGFP reporter, 589 nm light did not decrease social interaction. Data are presented as mean values ± SEM. Statistical significance is judged by a two-tailed paired t-test. m NpHR reporter gene was expressed during the labeling process, social interaction behavior was significantly inhibited during the probe test. Source data and statistics are provided in the Source Data file.
Fig. 4
Fig. 4. Amelioration of epileptic seizure by ST-Cal-Light.
a Schematic drawing of virus injection and fiber optic implantation. ST-Cal-Light viruses with TetO-EGFP reporter were injected into both hippocampal CA1 and CA3 areas bilaterally. b Representative images of tdTomato (transfection marker) and EGFP reporter gene expression. When seizure was induced by KA administration, little gene expression was created in the absence of light, demonstrating cell labeling was dependent on blue light. Scale bars, 50 μm. c A box-and-whisker plot of G/R ratio. Each circle indicates the cell (Seizure only: 0.258 ± 0.005 from 252 cells; light + seizure: 0.629 ± 0.017 from 252 cells, P = 6.71 × 10−72). The top and bottom of the box indicate the 25th and 75th percentile, respectively, the horizontal line across the box presents the median, and the whiskers mean the minimum and maximum values. Asterisks (***P < 0.005) indicate a two-tailed unpaired t-test. d For inhibition experiments, a TetO-NpHR reporter was used. The same ST-Cal-Light viruses were injected, as shown in (a). e A cartoon demonstrating experiment procedures. A seizure was induced by KA injection, and blue light was illuminated for labeling. Two days later, KA was injected again for the second seizure induction and compared the severity of the seizure with or without 589 nm light. f Sample movement traces after KA injection with or without yellow light. Movement during the same period of time was plotted. Different colors represent animal movement speed. ezTrack analysis was used for tracing (from Denise Cai’s lab). g Time-lapse changes of seizure score after KA administration. h Average seizure scores at various conditions. The random blue label condition was 5 s of blue light 3 times at the 1 min interval during the fear conditioning. i Hippocampal granule cells (GCs), mossy cells (MCs), CA1 and CA3 neurons were labeled by ST-Cal-Light, indicating increased neuronal activity in broad hippocampal areas. Scale bars, 50 μm. j Representative traces of normal and ictal-like activity before and after KA injection. k Time course of seizure activity progression after KA injection. The data of the time course are shown as mean values ± SEM. l Average changes in seizure score over time. m, n Comparison of seizure activity period between the first 10 min and the rest of 30 min. Source data and statistics are provided in the Source Data file.
Fig. 5
Fig. 5. Generation of conditional ST-Cal-Light knock-in mice.
a Schematic illustration of virus injection and fiber optic implantation. b Plasmid design for generating conditional ST-Cal-Light KI mouse. c Representative images of tdTomato (transfection marker) and EGFP (reporter) and G/R ratio distributions with or without introducing Cre recombinase (Cal-Het w/o Cre: 0.137 ± 0.005 from n = 292 independent cells; Cal-Het w/ Cre: 0.671 ± 0.022 from n = 258 independent cells). Scale bar, 100 μm. The border lines of the box indicate the 25th and 75th percentile, respectively, the horizontal line in the box shows the median and the whiskers mean the minimum and maximum values. Asterisks indicate ***P < 0.001. d Injected viruses (top) and images of EGFP and anti-myc staining. Myc epitope is expressed in a cre-dependent manner and localized at the somatic membranes. EGFP signals indicate active neurons. Scale bars, 50 μm. e Cartoon of the breeding scheme. f A mixture of viruses was injected into the primary motor cortex of Cal-Hom:EMX-Cre mouse (top). Blue light-dependent gene expression in neocortical excitatory neurons under Emx1 promoter (bottom). Scale bars, 50 μm. g Excitatory neuron labeling was confirmed by CaMKII antibody staining. Scale bar, 50 μm. h Virus injection scheme in Cal-Hom:PV-Cre mice. i Schematic flow of generating either Cal-Het:PV-Cre or Cal-Hom: PV-Cre (left). Active PV-positive neurons were labeled and confirmed by PV antibody staining. Scale bars, 50 μm. j Cell-type specific, light- and activity-dependent gene expressions were confirmed. Source data are provided as a Source Data file.

Similar articles

Cited by

References

    1. Guenthner CJ, Miyamichi K, Yang HH, Heller HC, Luo L. Permanent genetic access to transiently active neurons via TRAP: targeted recombination in active populations. Neuron. 2013;78:773–784. doi: 10.1016/j.neuron.2013.03.025. - DOI - PMC - PubMed
    1. Kawashima T, et al. Functional labeling of neurons and their projections using the synthetic activity-dependent promoter E-SARE. Nat. Methods. 2013;10:889–895. doi: 10.1038/nmeth.2559. - DOI - PubMed
    1. Liu X, et al. Optogenetic stimulation of a hippocampal engram activates fear memory recall. Nature. 2012;484:381–385. doi: 10.1038/nature11028. - DOI - PMC - PubMed
    1. Sakurai K, et al. Capturing and manipulating activated neuronal ensembles with CANE delineates a hypothalamic social-fear circuit. Neuron. 2016;92:739–753. doi: 10.1016/j.neuron.2016.10.015. - DOI - PMC - PubMed
    1. Sorensen, A. T. et al. A robust activity marking system for exploring active neuronal ensembles. Elife510.7554/eLife.13918 (2016). - PMC - PubMed

Publication types