. 2022 Dec 12;13(1):7670.
doi: 10.1038/s41467-022-35357-4.

Molecular models of multiple sclerosis severity identify heterogeneity of pathogenic mechanisms

Affiliations

Molecular models of multiple sclerosis severity identify heterogeneity of pathogenic mechanisms

Peter Kosa et al. Nat Commun. .

Abstract

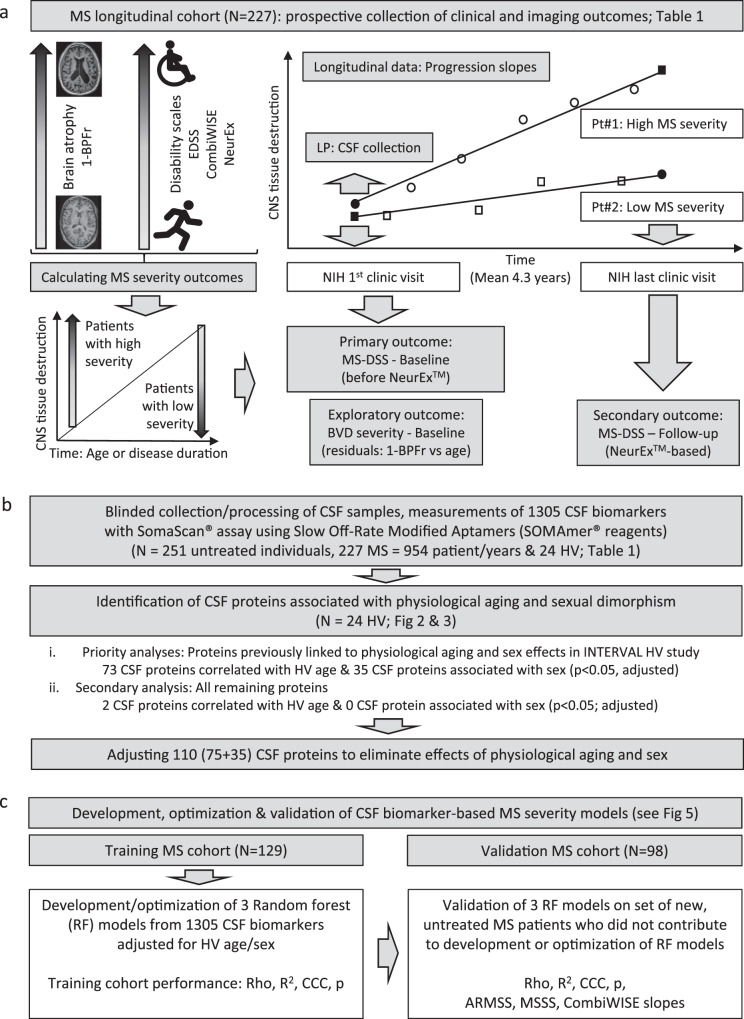
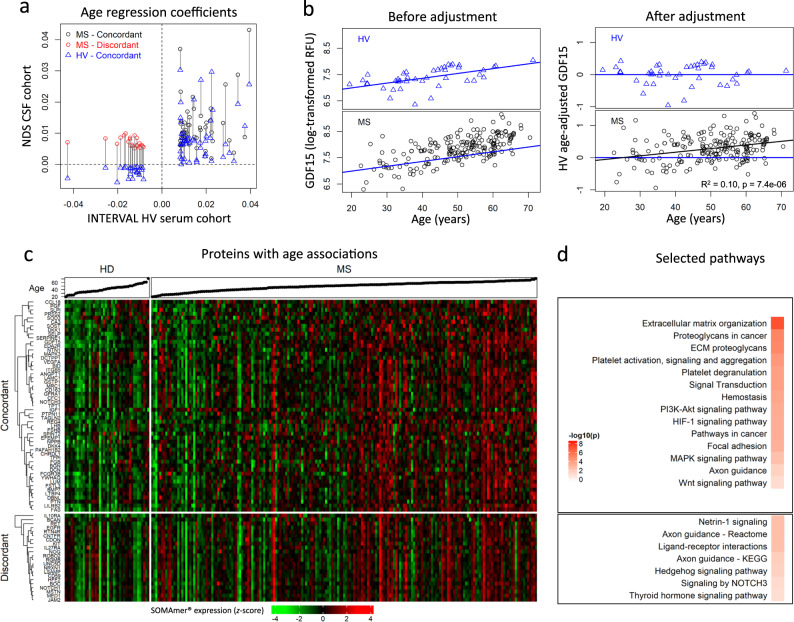
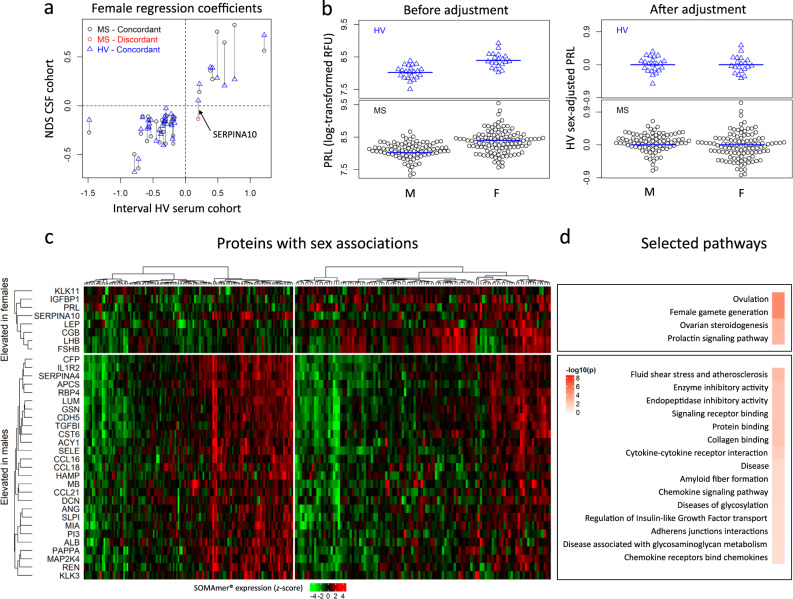
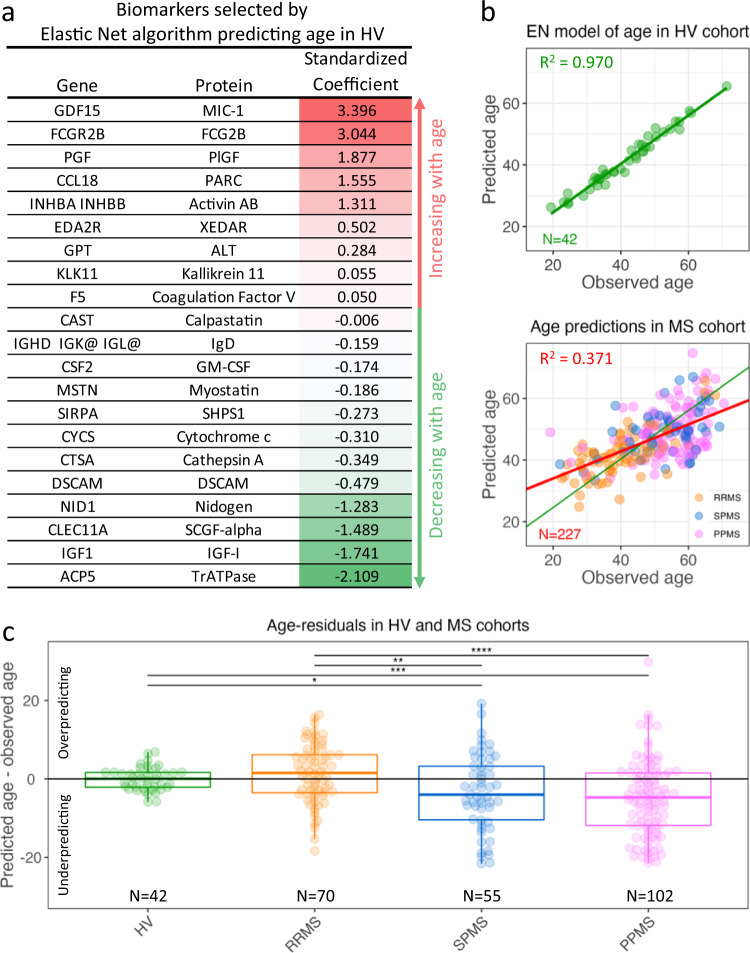
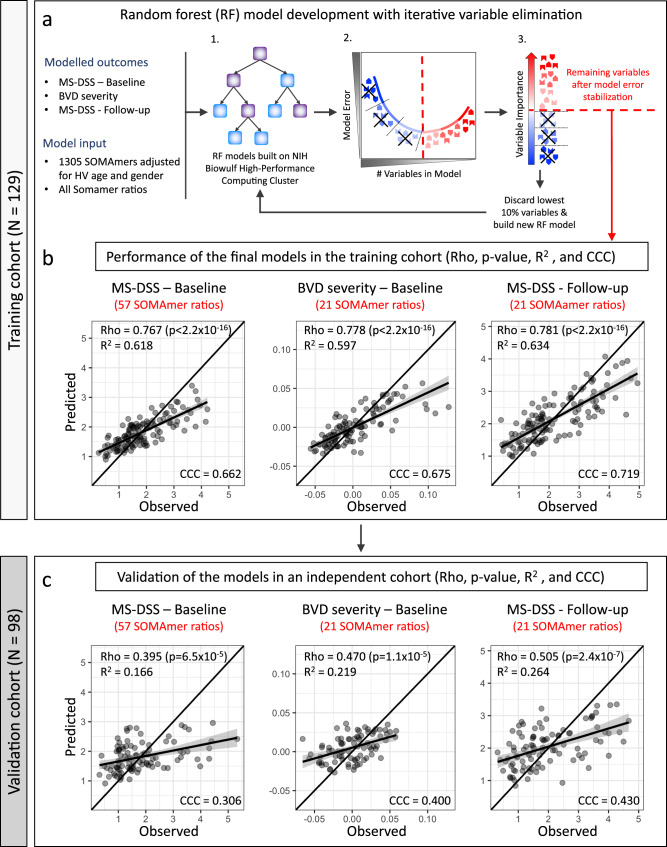
While autopsy studies identify many abnormalities in the central nervous system (CNS) of subjects dying with neurological diseases, without their quantification in living subjects across the lifespan, pathogenic processes cannot be differentiated from epiphenomena. Using machine learning (ML), we searched for likely pathogenic mechanisms of multiple sclerosis (MS). We aggregated cerebrospinal fluid (CSF) biomarkers from 1305 proteins, measured blindly in the training dataset of untreated MS patients (N = 129), into models that predict past and future speed of disability accumulation across all MS phenotypes. Healthy volunteers (N = 24) data differentiated natural aging and sex effects from MS-related mechanisms. Resulting models, validated (Rho 0.40-0.51, p < 0.0001) in an independent longitudinal cohort (N = 98), uncovered intra-individual molecular heterogeneity. While candidate pathogenic processes must be validated in successful clinical trials, measuring them in living people will enable screening drugs for desired pharmacodynamic effects. This will facilitate drug development making, it hopefully more efficient and successful.


Conflict of interest statement

The authors declare no competing interests.

Figures

Fig. 1
Fig. 1. Experimental design.
a Prospective collection of longitudinal clinical (Expanded Disability Status Scale [EDSS], Combinatorial Age-adjusted Disability Score [CombiWISE]), and cross-sectional imaging outcomes (brain parenchymal fraction (BPFr]) paired with lumbar puncture (LP) at the first clinic visit. b 1305 biomarkers measured in blinded fashion in cerebrospinal fluid (CSF) samples of multiple sclerosis (MS) patients and healthy volunteers (HV) were mathematically adjusted to eliminate the effects of aging and sex. c Random forest (RF) algorithm was applied to training cohort (N = 129) data, resulting in three models of MS severity. Models’ performance was assessed by Spearman Rho, R2, Concordance Correlation Coefficient (CCC), and p-value (p) of the Spearman correlation between observed and model-predicted values. The validity of the three models was then evaluated in an independent cohort (N = 98) by measuring the above-mentioned characteristics of the observed vs predicted outcomes. MS-DSS Multiple Sclerosis Disease Severity Scale, BVD brain volume deficit.
Fig. 2
Fig. 2. Adjusting SOMAmers based on physiological age associations.
a Regression coefficients for the 75 SOMAmers with age associations verified in healthy volunteers (HV) cerebrospinal fluid (CSF). Blue triangles compare effect sizes (regression coefficients) of physiological age on protein concentrations in serum (external HV cohort from INTERVAL study; x-axis) versus CSF (internal HV cohort; y-axis). Circles correspond to multiple sclerosis (MS) CSF coefficients with concordant (black) or discordant (red) associations with age compared to HV cohorts. Vertical lines connect the CSF coefficients for MS and HV cohorts for the same biomarker. b Example of adjusting measured CSF concentrations of a single protein (growth differentiation factor 15; GDF15) by subtracting effect of healthy aging. GDF15 log-transformed relative fluorescent unit (RFU) values (y-axis) versus age (x-axis) are displayed for HV (top) and MS (bottom) cohorts, before (left) and after (right) adjustment. The HV simple linear regression line (blue) used for the adjustment is superimposed on each panel. The coefficient of determination [R2] and the corresponding p-value were extracted from the linear model (represented by the black line) of HV age-adjusted GDF15 values versus age in MS patients. c Heatmap displaying the standardized expression (log-scaled z-scores) for the 75 selected SOMAmers (rows, for ordered list of proteins, see Supplementary Data 15), separated based on HV/MS concordance or discordance, for all patient samples (columns). Corresponding ages for each participant are displayed in ascending order at the top of the heatmap. d Selected pathways identified using functional enrichment STRING analysis along with Benjamini–Hochberg-adjusted –log10(p-values) describing how significant the functional enrichment is for age concordant and discordant proteins, respectively. See also Supplementary Data 1 and Supplementary Data 2. All statistical tests were two-sided. Source data are provided as a Source Data file.
Fig. 3
Fig. 3. Adjusting SOMAmers to subtract effects of physiological sex associations.
a Regression coefficients for the 35 SOMAmers with sex associations from cerebrospinal fluid (CSF) and serum. Blue triangles compare effect sizes (regression coefficients) of protein association with sex measured in healthy volunteer (HV) serum in the published (INTERVAL) study (x-axis) with internal HV CSF cohort (y-axis). Circles correspond to multiple sclerosis (MS) CSF coefficients with concordant (black) and discordant (red) associations with sex compared to HV. Vertical lines connect the CSF coefficients for our MS and HV cohorts for the same biomarker. SERPINA10, identified by a black arrow, showed discordant association with sex in MS versus HV. b Example of adjusting CSF protein concentration to subtract effects of physiological sex differences on prolactin (PRL). CSF PRL log-transformed relative fluorescent unit (RFU) values (y-axis) versus sex (x-axis) are displayed for both HVs (top) and MS (bottom) cohorts, before (left) and after (right) adjustment, showing no residual difference between MS and HV. c Heatmap displaying the standardized expression (log-scaled z-scores) for the 35 sex-associated biomarkers (rows), separated based on elevation in females/males, for all patient samples, separated by males and females (columns). d Selected pathways identified using functional enrichment STRING analysis along with Benjamini—Hochberg-adjusted –log10(p-values) describing how significant the enrichment is for female- elevated and male-elevated proteins, respectively. See also Supplementary Data 3 and Supplementary Data 4. All statistical tests were two-sided. Source data are provided as a Source Data file.
Fig. 4
Fig. 4. MS is not associated with accelerated aging.
a Standardized regression coefficients from the elastic net (EN) model predicting age in the healthy volunteers (HV). Red-shading corresponds to biomarkers that increase with age, and green-shading corresponds to biomarkers decreasing with age. b Observed vs model-predicted age in the HV cohort (top) and multiple sclerosis (MS) cohort (bottom). The linear regression line (red) of observed vs predicted MS samples is superimposed on the green regression line of the HV cohort. The coefficient of determination (R2) of the red line shows that cerebrospinal fluid (CSF) biomarkers explain almost 40% of variance associated with age of MS patients. c Difference between CSF model-predicted ages and observed ages (y-axis) in HV and MS subtypes (x-axis). The black bars mark significant differences based on pairwise comparisons of the diagnostic groups using two-sided Wilcoxon test and false-discovery rate (FDR) adjustment for multiple comparisons (p < 0.0001 ****, p < 0.001 ***, p < 0.01 **, p < 0.05 *). Exact FDR-adjusted p-values for individual comparisons: HV-SPMS: p = 0.049, HV-PPMS: p = 0.00058, RRMS-SPMS: p = 0.0072, RRMS-PPMS: p = 2.3 × 10-5. The lower and upper hinges of the boxplots correspond to the first and third quartiles (the 25th and 75th percentiles). The upper whisker extends from the hinge to the largest value no further than 1.5 * interquartile range (IQR) from the hinge. The lower whisker extends from the hinge to the smallest value at most 1.5 * IQR of the hinge. Source data are provided as a Source Data file.
Fig. 5
Fig. 5. Molecular pathways associated with MS severity.
One-thousand three-hundred five healthy volunteer (HV) age- and sex-adjusted SOMAmers were correlated with the three multiple sclerosis (MS) severity outcomes—multiple sclerosis disease severity score (MS-DSS) at baseline (dark green), MS-DSS at follow-up (light green), and brain volume deficit (BVD) severity (orange). Spearman correlation coefficients were used for the Functional enrichment analysis (FEA) in the STRING database. Enriched pathways and processes with false-discovery rate (FDR)-adjusted p-value < 0.05 were grouped into five main categories, and the boxplots for the p-values of individual processed are displayed. The validity of the findings was tested in g:Profiler database, where the same list of 1305 genes ordered by the increasing p-value was inputted for the FEA using the g:GOSt tool. The boxplots of FDR-adjusted p-values are shown. # term counts the number of processes identified for each category and outcome. Biomarkers significantly (FDR-adjusted p-value < 0.05) correlating with either of the three outcomes were submitted to g:Profiler using the custom set of 1305 SOMAmers (dark blue) or the whole proteome (light blue) as analysis background. The same set of SOMAmers was also analyzed by STRING using whole proteome background (violet). Boxplots of p-values for significantly enriched processes are displayed, as well as the number of significantly enriched processes that the g:Profiler identified linked to MS severity outcomes using 1305 SomaScan proteins as a background. FDR-adjusted p-values are displayed on a –log10 scale, the red dashed line depicts the FDR-adjusted p-value of 0.05. The lower and upper hinges of the boxplots correspond to the first and third quartiles (the 25th and 75th percentiles). The upper whisker extends from the hinge to the largest value no further than 1.5 * interquartile range (IQR) from the hinge. The lower whisker extends from the hinge to the smallest value at most 1.5 * IQR of the hinge. Source data are provided as a Source Data file.
Fig. 6
Fig. 6. Development and validation of CSF-based MS severity models.
a All models were developed and optimized in the training cohort (N = 129). Three modeling outcomes were used: Multiple Sclerosis Disease Severity Score (MS-DSS) at baseline, brain volume deficit (BVD) severity at baseline, and MS-DSS at most recent follow-up. Healthy volunteer (HV) age- and sex-adjusted SOMAmers and all possible SOMAmer ratios were used as variables for the modeling. Random forest models were generated using a high-performance computing cluster (1), A statistical learning pipeline optimized models by decreasing the number of predictors to minimize overfit: At each step, we constructed 10 random forest models and recorded the training out-of-bag (OOB) model error (2), We also averaged variable importance measures from these 10 random forest models based on node impurity (3). The 10% least contributing variables were excluded, and the process repeated till the OOB error had minimized (red dashed line). The remaining predictors constituted the final/optimized model. b Performance of the final models was evaluated by Spearman correlation test (Rho), coefficient of determination (R2) of a linear regression model, Lin’s concordance correlation coefficient (CCC), and p-value of the Spearman correlation between observed (x-axis) and predicted (y-axis) outcomes in the training cohort. c The validity of the three RF models was tested in an independent cohort of 98 samples that did not contribute in any way to development of the models. Concordance line (x = y) is shown in black. Linear regression lines are shown in black with gray-shaded error band representing 95% confidence interval. All statistical tests were two-sided. Source data are provided as a Source Data file.
Fig. 7
Fig. 7. MS severity outcomes in the validation cohort and their associations with cerebrospinal fluid (CSF) model predictions.
a Spearman correlation (the size and color of the square represent the Spearman Rho; significance levels are depicted by stars) between five measured clinical outcomes and two CSF biomarker-predicted multiple sclerosis (MS) severity outcomes in the validation cohort (N = 98). b Correlations between prospectively measured MS progression slopes (i.e., therapy adjusted CombiWISE slopes derived from longitudinal clinical follow-up; y-axes), clinical/imaging outcomes and CSF biomarker-predicted outcomes (x-axes). For exact Spearman Rho, p-values, and R2 see Supplementary Data 8. MS-DSS Multiple Sclerosis Disability Severity Score, MSSS Multiple Sclerosis Severity Score, ARMSS Age-Related Multiple Sclerosis Severity, CombiWISE Combinatorial weight-adjusted disability score, sNFL serum neurofilament light chain, cNFL CSF neurofilament light chain. All statistical tests were two-sided. Source data are provided as a Source Data file.
Fig. 8
Fig. 8. SomaScan-based models of multiple sclerosis (MS) severity reveal pathophysiological heterogeneity among MS patients.
a Heatmap displaying the log-expression of the selected proteins from the three severity models in the MS cohort, with hierarchical cluster analysis identifying four protein modules (rows) across seven patient clusters (columns). RRMS relapsing-remitting multiple sclerosis, SPMS secondary progressive multiple sclerosis, PPMS primary progressive multiple sclerosis, MS-DSS Multiple Sclerosis Disease Severity Score, BVD brain volume deficit. Black rectangles on the right of the module annotations indicate whether the specific protein was present in a given model. b Spearman correlation plot of pipeline-selected biomarkers, ordered by module membership (left), along with Spearman correlation coefficients between model-selected biomarkers and measured MS severity outcomes (right). Colors of the protein labels correspond to module membership in a. c Selected pathways identified using STRING analysis, along with false-discovery rate (FDR)-adjusted –log10 p-values for the four protein modules, respectively. See also Supplementary Data 9–12. Ordered list of proteins displayed in the heatmap (8a) and correlation matrix (8b) is available in Supplementary Data 16. Source data are provided as a Source Data file.

References

    1. Sun BB, et al. Genomic atlas of the human plasma proteome. Nature. 2018;558:73–79. doi: 10.1038/s41586-018-0175-2. - DOI - PMC - PubMed
    1. Emilsson V, et al. Co-regulatory networks of human serum proteins link genetics to disease. Science. 2018;361:769–773. doi: 10.1126/science.aaq1327. - DOI - PMC - PubMed
    1. Barbour C, et al. Molecular-based diagnosis of multiple sclerosis and its progressive stage. Ann. Neurol. 2017;82:795–812. doi: 10.1002/ana.25083. - DOI - PMC - PubMed
    1. Filippi M, et al. Prediction of a multiple sclerosis diagnosis in patients with clinically isolated syndrome using the 2016 MAGNIMS and 2010 McDonald criteria: a retrospective study. Lancet Neurol. 2018;17:133–142. doi: 10.1016/S1474-4422(17)30469-6. - DOI - PubMed
    1. Thompson, A.J. et al. Diagnosis of multiple sclerosis: 2017 revisions of the McDonald criteria. Lancet Neurol.17, 162–173 (2017). - PubMed

Publication types