. 2022 Dec 12;12(1):20257.
doi: 10.1038/s41598-022-23998-w.

Shallow magmatic intrusion evolution below La Palma before and during the 2021 eruption

Affiliations

Shallow magmatic intrusion evolution below La Palma before and during the 2021 eruption

José Fernández et al. Sci Rep. .

Abstract

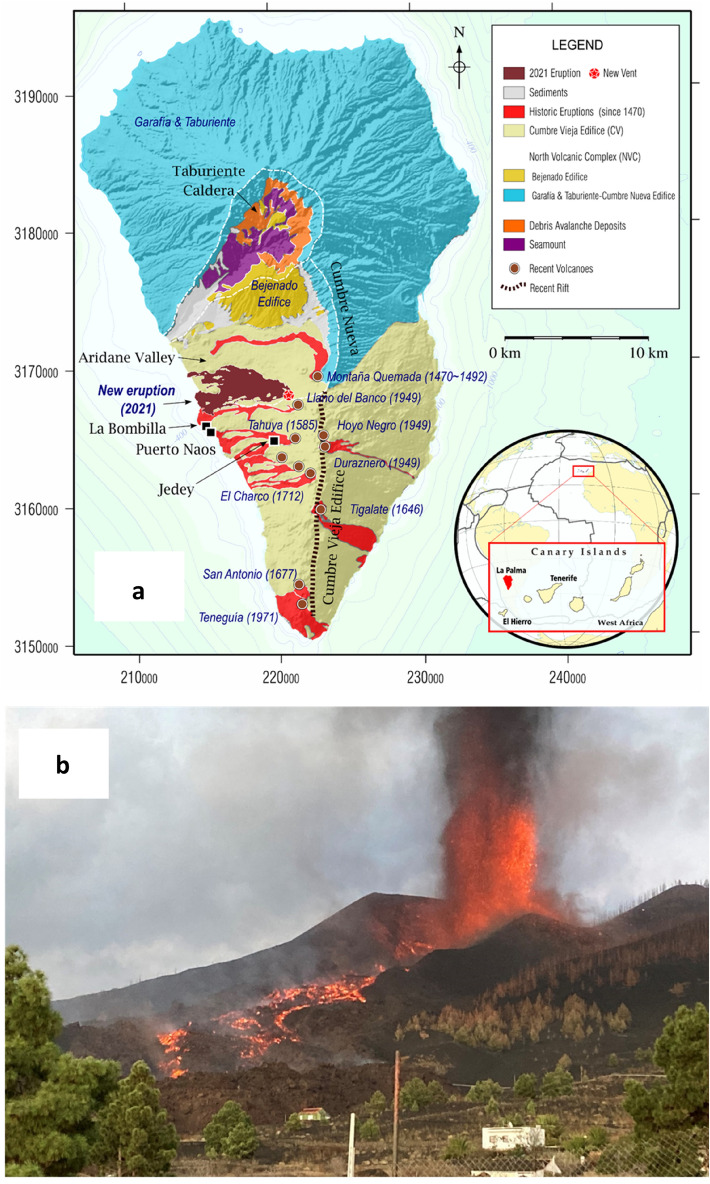
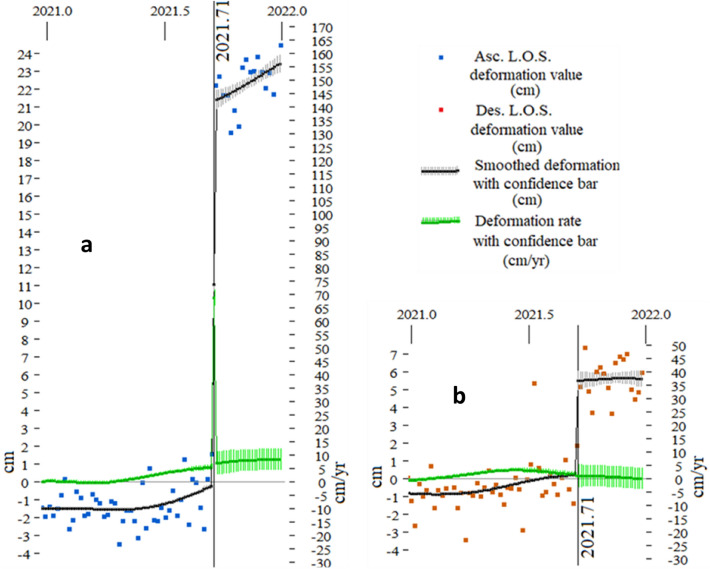
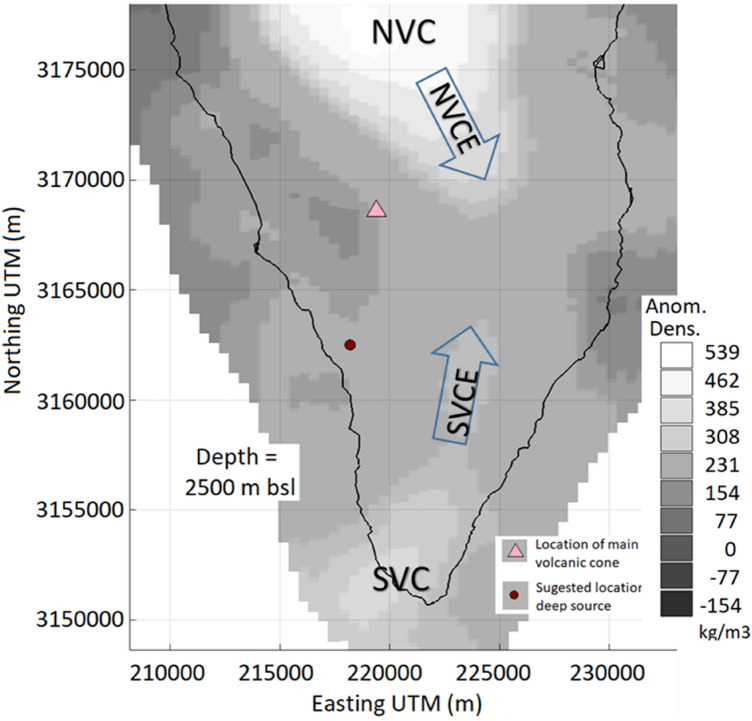
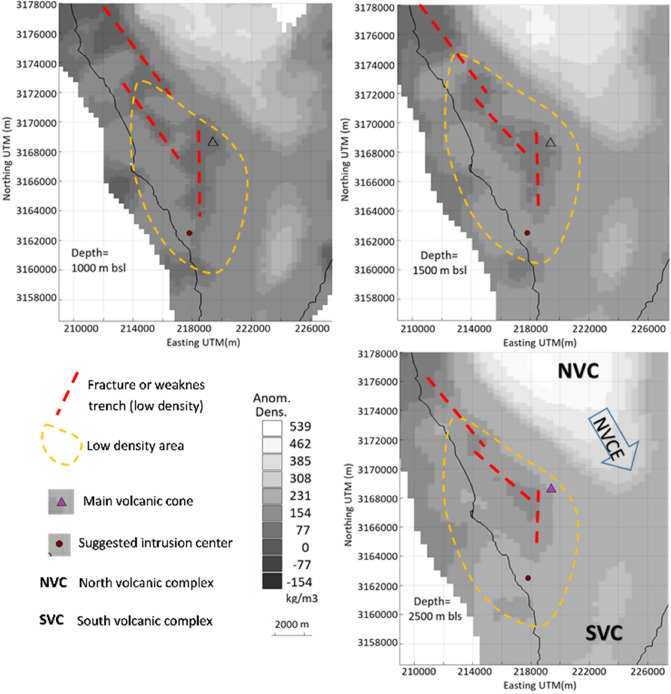
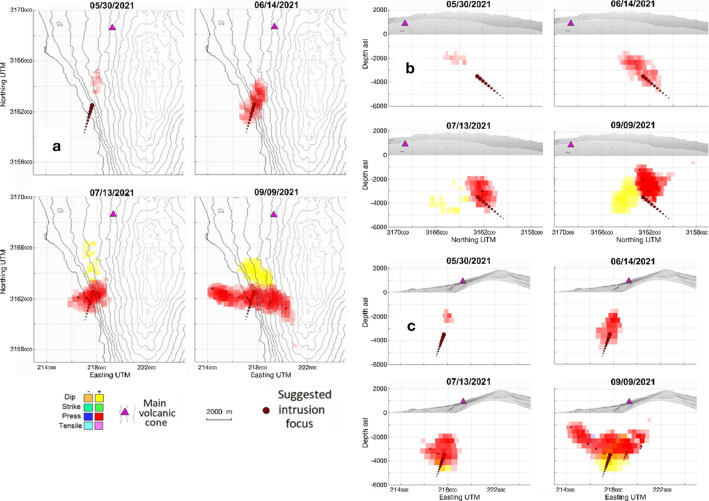
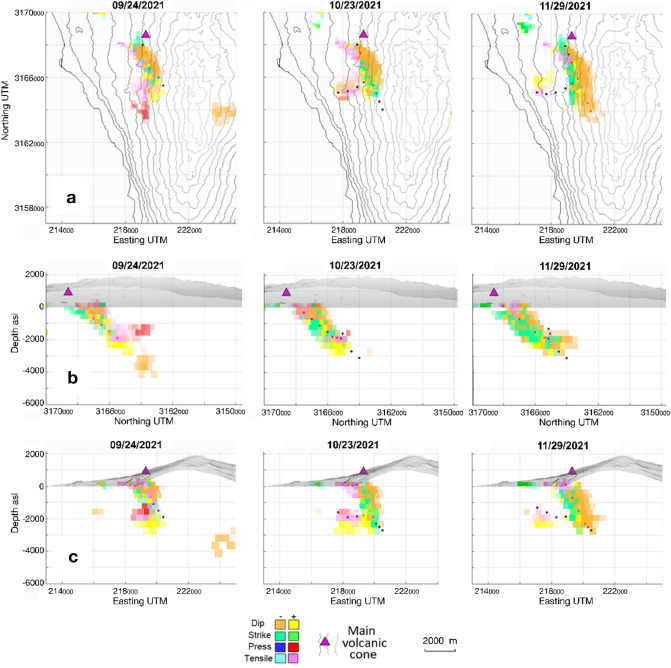
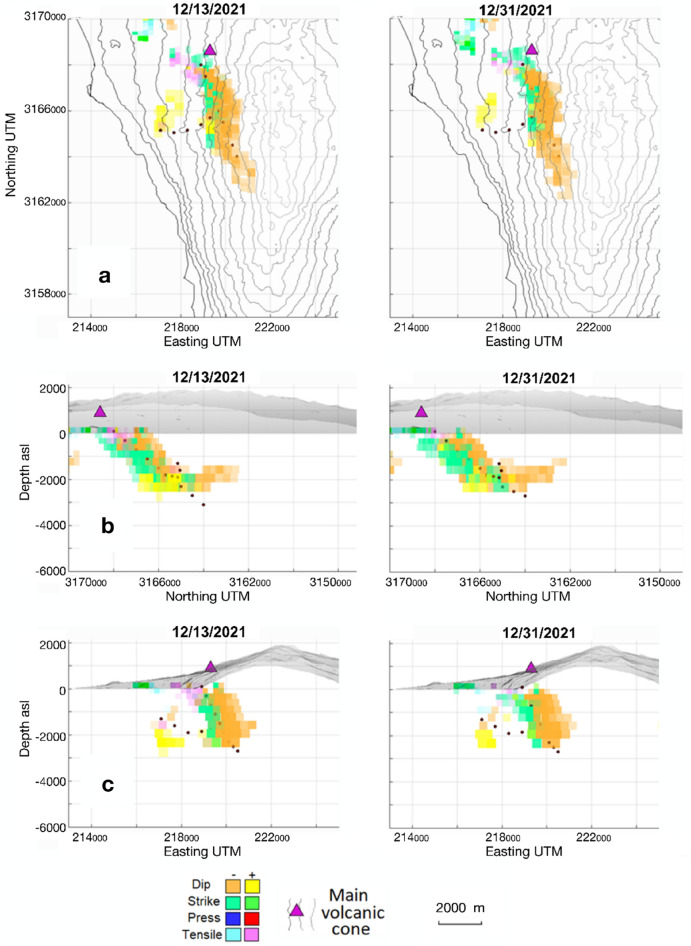
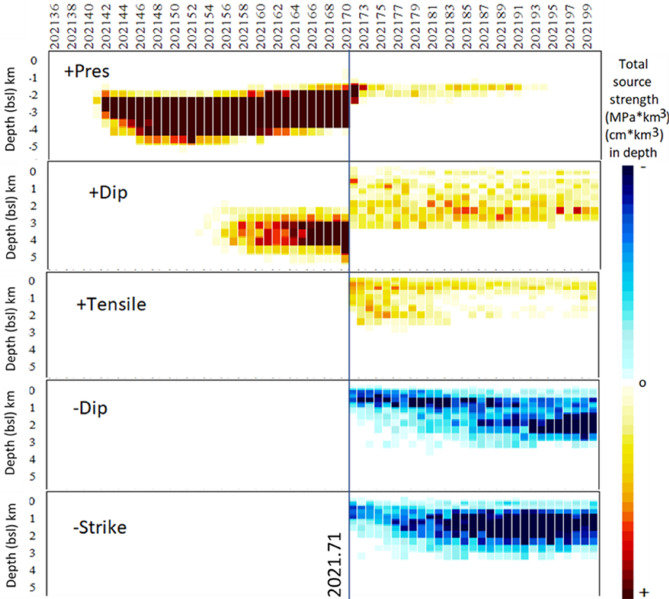
La Palma, Canary Islands, underwent volcanic unrest which culminated in its largest historical eruption. We study this unrest along 2021 using Interferometric Synthetic Aperture Radar (InSAR) and a new improved interpretation methodology, comparing achieved results with the crustal structure. We reproduce the final phase of La Palma volcanic unrest, highligthing a shallow magma accumulation which begins about 3.5 months before the eruption in a crustal volume charactherized by low density and fractured rocks. Our modeling, together with our improved pictures of the crustal structure, allows us to explain the location and characteristics of the eruption and to detect failed eruption paths. These can be used to explain post-eruptive phenomena and hazards to the local population, such as detected gases anomalies in La Bombilla and Puerto Naos. Our results have implications for understanding volcanic activity in the Canaries and volcano monitoring elsewhere, helping to support decision-making and providing significant insights into urban and infrastructure planning in volcanic areas.


Conflict of interest statement

The authors declare no competing interests.

Figures

Figure 1
Figure 1
Geographic location and geologic elements of La Palma and eruption photo. (a) Location of Canary Islands and La Palma Island (lower inset) and simplified updated geological map (UTM28 North reference system, coordinates in m). The main volcanic complexes, ridges as well as the last historical eruptions on the Island are shown. The towns of Jedey, La Bombilla and Puerto Naos (black squares) are also depicted. The 2021 lava flow field was the most voluminous of the last 600 years. See upper insets for scale and keys description. (b) Snapshot of the eruption during the first days after September 19, 2021. Photo by the authors (September 23, 2021; 20:12 local time). GMT software (www.generic-maping-tools .org) and Microsoft PowerPoint 2016 were used to create this figure.
Figure 2
Figure 2
Input deformation data for a pixel close to the maximum deformation site with UTM coordinates (218,000,3,166,000). Dots denote the discrete satellite data, using blue color for ascending (a) and red for descending (b) LOS displacements. Black lines are smoothed deformation (cm) (left axis) with confidence bars for one standard deviation. Smoothing approach is described in the Methods section. Green lines are smoothed deformation rate (cm/yr) (right axis) with confidence bars for one standard deviation. At 2021.71 (09/17/2021) there is a clear jump in the deformation record. Pixel location is shown in Supplementary Fig. 3. Matlab software (www.mathworks.com) and Microsoft PowerPoint 2016 were used to create this figure.
Figure 3
Figure 3
Horizontal slice of the obtained 3D crustal density model for La Palma. Horizontal section of the 3D model for anomalous density for La Palma Island at 2500 m depth below sea level (bsl). Suggested location of deep source is an approximation to the location of the input of magma from deeper zones, from our geodetic modeling. Matlab software (www.mathworks.com) and Microsoft PowerPoint 2016 were used to create this figure.
Figure 4
Figure 4
Density crustal model for La Palma Island. Horizontal sections of the crustal density model for La Palma Island at different depths bsl. Density minima alignments, in particular associated with the shallow magma storage and the fissure eruption, are marked with red dashed lines. Triangle indicates the location of the main volcanic vent during the eruption. Red point indicates the location of the deep magma feeding the shallow magmatic reservoir below Jedey area from our geodetic modeling. Low density area is approximately delineated by the dashed yellow line. Matlab software (www.mathworks.com) and Microsoft PowerPoint 2016 were used to create this figure.
Figure 5
Figure 5
Time evolution of the modeled sources for 01/01/2021–09/13/2021 (2021.00–2021.70). (a) Horizontal, (b) vertical N-S and (c) vertical W-E projections of the sources obtained for different epochs in 2021.00–2021.70. The different plots show the time evolution of the different sources obtained from inversion of Sentinel-1 ascending and descending LOS displacement. Purple triangle shows the location of the main volcanic vent during the 2021 La Palma eruption. Red dots indicate the provenance of the deep magma feed in the detected shallow reservoir from the geodetic modeling. All coordinates and depths are in meters. Matlab (www.mathworks.com) and GMT (www.generic-mapin-tools.org) softwares were used to create this figure. This figure complements with Supplementary Movies 1–6.
Figure 6
Figure 6
Time evolution of the modeled sources for 09/13/2021–09/20/2021 (2021.70–2021.72) period. (a) Horizontal and vertical N-S and W-E projections of the sources obtained for the jump in displacements measured in 2021.70–2021.72. Black stars represent the seismicity in that period. (b) Horizontal and vertical N-S and W-E projections of the pressure and tensile sources obtained for the jump in displacements measured in 2021.70–2021.72. (c) Horizontal and vertical N-S and W-E projections of the dip- and strike-slip sources obtained for the jump in displacements measured in 2021.70–2021.72. The different sources are obtained from inversion of Sentinel-1A/B ascending and descending LOS displacement. Purple triangle shows the location of the main volcanic vent during the 2021 La Palma eruption. Red dot indicates the provenance of the deep magma feed in the detected shallow reservoir. All coordinates and depths are in meters. Matlab (www.mathworks.com) and GMT (www.generic-mapin-tools.org) softwares were used to create this figure. This figure is complemented by Supplementary Movies 1–6.
Figure 7
Figure 7
Time evolution of the modeled sources for 09/24/2021–11/29/2021 (2021.73–2021.91). (a) Horizontal, (b) vertical N-S and (c) vertical W-E projections of the sources obtained for diferent epochs in 2021.73–2021.91. The different plots show the time evolution of the different sources obtained from inversion of Sentinel-1 ascending and descending LOS displacement. Purple triangle shows the location of the main volcanic vent during the 2021 La Palma eruption. Red dots indicate the inferred direction of magma flows from deeper areas. The isolated negative dip-slip source which only appear in 09/24/2021 to the East of the vent could be real or an artifact produced by the location to the limit of the study area. But with the information available we can not discriminate between both options. Matlab (www.mathworks.com) and GMT (www.generic-mapin-tools.org) softwares were used to create this figure. This figure complements with Supplementary Movies 1–6.
Figure 8
Figure 8
Time evolution of the modeled sources around the end of the eruption. (a) Horizontal, (b) vertical N-S and (c) vertical W-E projections of the sources obtained for different epochs in 2021.95 (12/13/2021, end of the eruption) and 2021.99 (12/28/2021, one of the initial post-eruptive steps). The different plots show the time evolution of the different sources obtained from inversion of Sentinel-1 ascending and descending LOS displacement. Purple triangle shows the location of the main volcanic vent during the 2021 La Palma eruption. Red dots indicate the inferred direction of magma flows from deeper areas. Matlab (www.mathworks.com) and GMT (www.generic-mapin-tools.org) softwares were used to create this figure. This figure complements with Supplementary Movies 1–6.
Figure 9
Figure 9
Graphical evolution of the characteristics of the sources below Jedey area. Panels show intensity chronograms as function of time (x axis) and depth range (km, y axis). The evolution of the different types of considered sources before and after the “jump” episode (2021.71, 09/17/2021) in deformation are indicated using hot colours (from yellow to garnet) to show increasing positive values, and cold colours (from light to dark blue) for increasing negative values. Pressure strength values range between ± 20 MPa·km3 each km in depth, dislocation strength values range between ± 50 cm·km3 each km in depth. Two precursor phenomena are clearly distinguished: (1) the intrusive pressure increase from 2021.40 (05/26/2021), and (2) the ascending mass dip from 2021.55 (20/07/2021). Matlab software (www.mathworks.com) was used to create this figure.

References

    1. Padrón E, et al. Dynamics of diffuse carbon dioxide emissions from Cumbre Vieja volcano, La Palma Canary Islands. Bull. Volcanol. 2015;77:28. doi: 10.1007/s00445-015-0914-2. - DOI
    1. Torres-González PA, et al. Unrest signals after 46 years of quiescence at Cumbre Vieja, La Palma Canary Islands. J. Volcanol. Geotherm. Res. 2020;392:106757. doi: 10.1016/j.jvolgeores.2019.106757. - DOI
    1. Fernández J, et al. Detection of volcanic unrest onset in La Palma, Canary Islands, evolution and implications. Sci. Rep. 2021;11:2540. doi: 10.1038/s41598-021-82292-3. - DOI - PMC - PubMed
    1. Padrón, E., Pérez, N. M., Melián, G. v, Sumino, H. & Alonso, M. Temporal evolution of 3 He/4 He isotopic ratio at Dos Aguas cold mineral spring , La Palma , Canary Islands. In EGU General Assembly 14994 (2021).
    1. Pérez, N. M., Melián, G. v, Hernández, P. A. & Asensio-ramos, M. Diffuse H2 degassing studies: a useful geochemical tool for monitoring Cumbre Vieja volcano, La Palma, Canary Islands. In EGU General Assembly (2021).