Multicenter Study
. 2022 Dec 12;12(1):21458.
doi: 10.1038/s41598-022-25892-x.

Prospective multicentre study of host response signatures in neonatal sepsis in Sub Saharan Africa

Affiliations
Multicenter Study

Prospective multicentre study of host response signatures in neonatal sepsis in Sub Saharan Africa

Sem Ezinmegnon et al. Sci Rep. .

Abstract

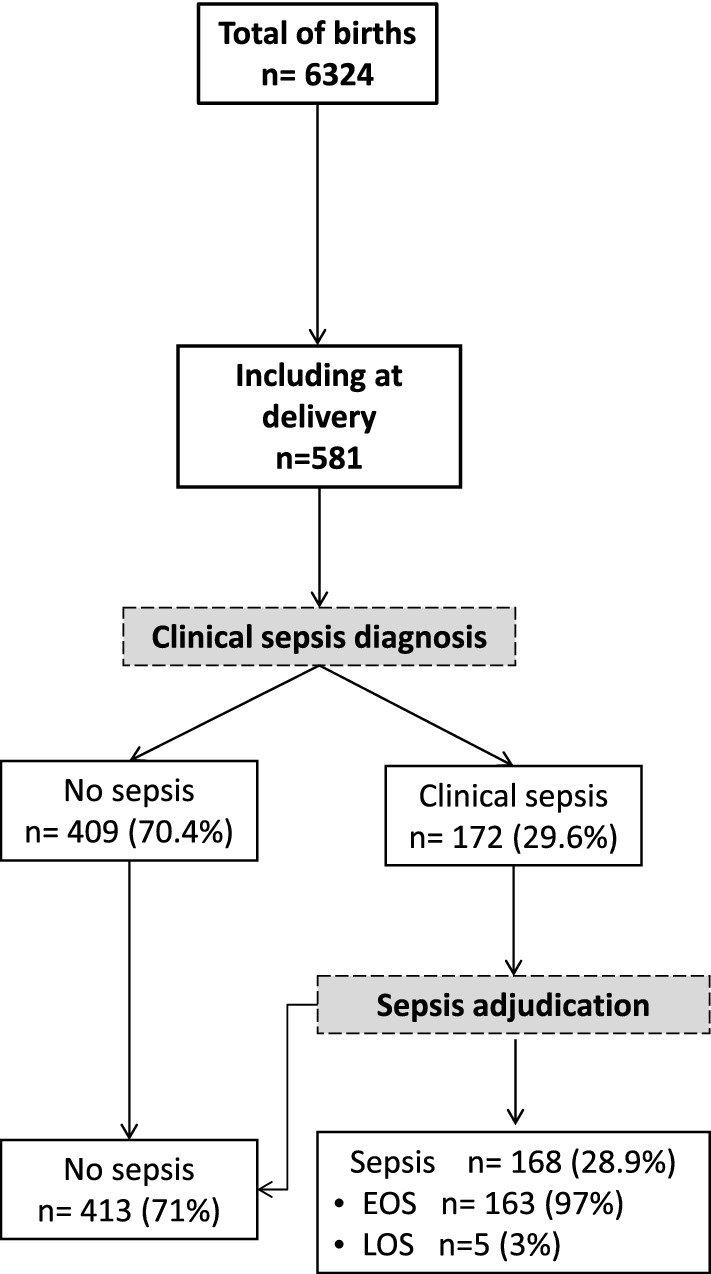
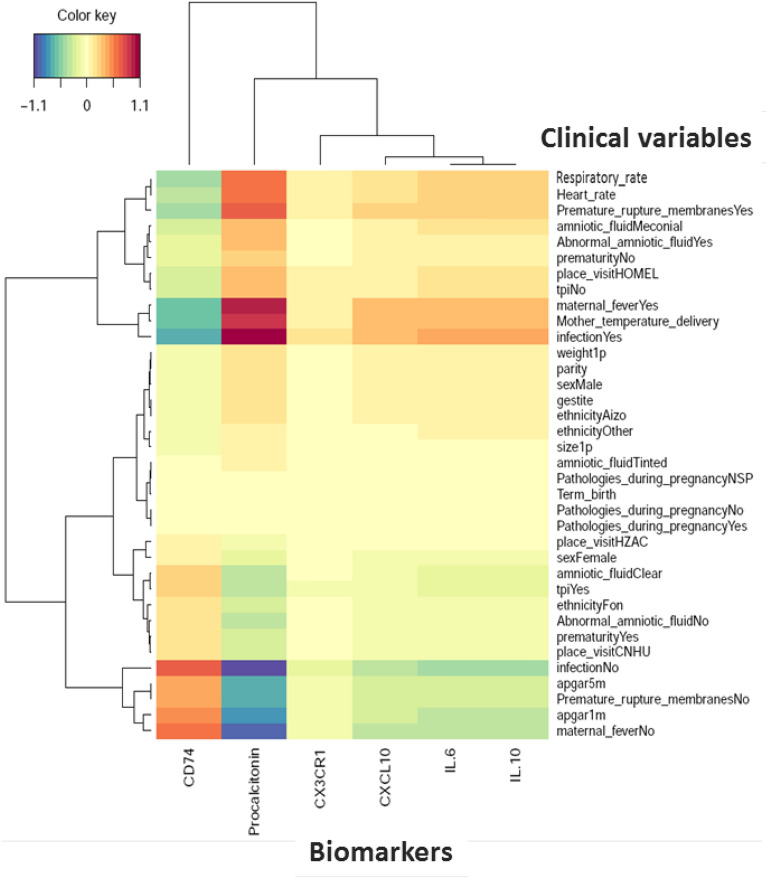
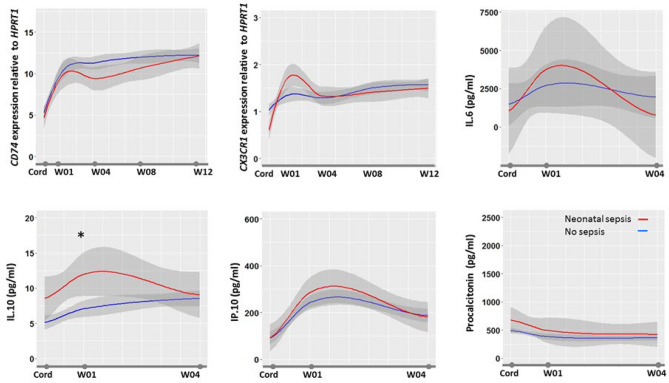
Few biomarkers for sepsis diagnosis are commonly used in neonatal sepsis. While the role of host response is increasingly recognized in sepsis pathogenesis and prognosis, there is a need for evaluating new biomarkers targeting host response in regions where sepsis burden is high and medico-economic resources are scarce. The objective of the study is to evaluate diagnostic and prognostic accuracy of biomarkers of neonatal sepsis in Sub Saharan Africa. This prospective multicentre study included newborn infants delivered in the Abomey-Calavi region in South Benin and their follow-up from birth to 3 months of age. Accuracy of transcriptional (CD74, CX3CR1), proteic (PCT, IL-6, IL-10, IP-10) biomarkers and clinical characteristics to diagnose and prognose neonatal sepsis were measured. At delivery, cord blood from all consecutive newborns were sampled and analysed, and infants were followed for a 12 weeks' period. Five hundred and eighty-one newborns were enrolled. One hundred and seventy-two newborns developed neonatal sepsis (29.6%) and death occurred in forty-nine infants (8.4%). Although PCT, IL-6 and IP-10 levels were independently associated with sepsis diagnosis, diagnostic accuracy of clinical variables combinations was similar to combinations with biomarkers and superior to biomarkers alone. Nonetheless, CD74, being the only biomarkers independently associated with mortality, showed elevated prognosis accuracy (AUC > 0.9) either alone or in combination with other biomarkers (eg. CD74/IP-10) or clinical criterion (eg. Apgar 1, birth weight). These results suggest that cord blood PCT had a low accuracy for diagnosing early onset neonatal sepsis in Sub Saharan African neonates, while association of clinical criterion showed to be more accurate than any biomarkers taken independently. At birth, CD74, either associated with IP-10 or clinical criterion, had the best accuracy in prognosing sepsis mortality.Trial registration Clinicaltrial.gov registration number: NCT03780712. Registered 19 December 2018. Retrospectively registered.


Conflict of interest statement

The authors declare no competing interests.

Figures

Figure 1
Figure 1
Flow diagram of study population. Recruitment and flow of newborn with risk of neonatal sepsis. At delivery, clinical sepsis diagnosis was established by the local pediatricians based on the child clinical examination and initial workup including haemogram, C-reactive protein (CRP) and microbiological cultures (blood, cerebral fluids and urine). All newborns with a clinical sepsis were subsequently adjudicated by two independent pediatricians and sorted into ‘LOS’ and ‘EOS’ (Figure drawn using Microsoft PowerPoint 2016, Redmond, CA).
Figure 2
Figure 2
Cord blood biomarkers level in septic neonates. (A) Box-plot of transcriptional and protein biomarkers in clinical sepsis diagnosis. CD74 and CX3CR1 mRNA level were evaluated by RT-qPCR with ABI7500 fast and plasma PCT; IL6; IL10 and IP-10 concentrations were measured by multiplexed assay with the Ella platform in cord blood sample obtained from sepsis neonates and no sepsis neonates. Results are presented as box-plots as well as individual values in groups (hospital non-sepsis, hospital sepsis and non-sepsis suburban). Anova test (or the Kruskal-Wallis test when distribution was not normal or when homoscedasticity was rejected) was used to compare biomarkers. Data are shown as median, IQR with whiskers drawn within 1.5 IQR. A p value < 0.05 was considered as significant. A post hoc Student t test was performed to compare the groups against each other (*p ≤ 0.05; **p < 0.01; ***p < 0.001). (B) Transcriptional and protein biomarkers expression in sepsis non survivors neonates and survivors neonates. CD74 and CX3CR1 mRNA level were evaluated by RT-qPCR with ABI7500 fast and plasma PCT; IL6; IL10 and IP-10 concentrations were measured by multiplexed assay with the Ella platform in cord blood sample obtained from non-surviving neonates and surviving neonates. Results are presented as box-plots as well as individual values in groups (hospital survivors, hospital non-survivors and suburban survivors). Anova test (or the Kruskal-Wallis test when distribution was not normal or when homoscedasticity was rejected) was used to compare biomarkers levels in suburban survivors, hospital non survivors and hospital survivor groups (statistically significant test p ≤ 0.05). Data are shown as median, IQR with whiskers drawn within 1.5 IQR. A post hoc Student t test was performed to compare the groups against each other (*p ≤ 0.05; **p < 0.01; ***p < 0.001).
Figure 3
Figure 3
Biomarkers and clinical variables correlation in neonatal clinical sepsis diagnosis. Heatmap of correlation matrix (Partial Last Squares Regression) to predict biomarkers from Clinical Variables. The rows and columns correspond to clinical variables and biomarkers. Respectively positive correlations are red and negative correlations are blue. The figure shows only variables with covariances greater than max (covariance)/2 (Figure drawn using Rstudio, version2021.9.1.372, http://wwwrstudio.com, Boston MA).
Figure 4
Figure 4
Biomarkers kinetics during 3 months of follow-up. The figure shows the biomarkers profile during the first 3 months of life in healthy infants with median value (in blue), 95%confidence interval (in gray), and median value in septic infants (in red). Biomarkers were measured at delivery in cord blood (Cord) and at first, 4, 8 and 12 weeks in peripheral blood. Data are expressed as medians. Anova test was used to compare biomarkers levels.

References

    1. IHME. Global Burden of Disease Collaborative Network. (2018).
    1. Watkins RR, et al. A Multicenter survey of house staff knowledge about sepsis and the "surviving sepsis campaign guidelines for management of severe sepsis and septic shock". J. Intensive Care Med. 2020;35:187–190. doi: 10.1177/0885066617737304. - DOI - PubMed
    1. Bailey PE, et al. Institutional maternal and perinatal deaths: a review of 40 low and middle income countries. BMC Pregnancy Childbirth. 2017;17:295. doi: 10.1186/s12884-017-1479-1. - DOI - PMC - PubMed
    1. Seale AC, et al. Maternal and early onset neonatal bacterial sepsis: burden and strategies for prevention in sub-Saharan Africa. Lancet Infect. Dis. 2009;9(7):428–438. doi: 10.1016/S1473-3099(09)70172-0. - DOI - PMC - PubMed
    1. Simon AK, et al. Evolution of the immune system in humans from infancy to old age. Proc. Biol. Sci. 2015;282:20143085. - PMC - PubMed

Publication types

Associated data