. 2022 Dec 12;5(1):1361.
doi: 10.1038/s42003-022-04294-9.

One-year-later spontaneous EEG features predict visual exploratory human phenotypes

Affiliations

One-year-later spontaneous EEG features predict visual exploratory human phenotypes

Miriam Celli et al. Commun Biol. .

Abstract

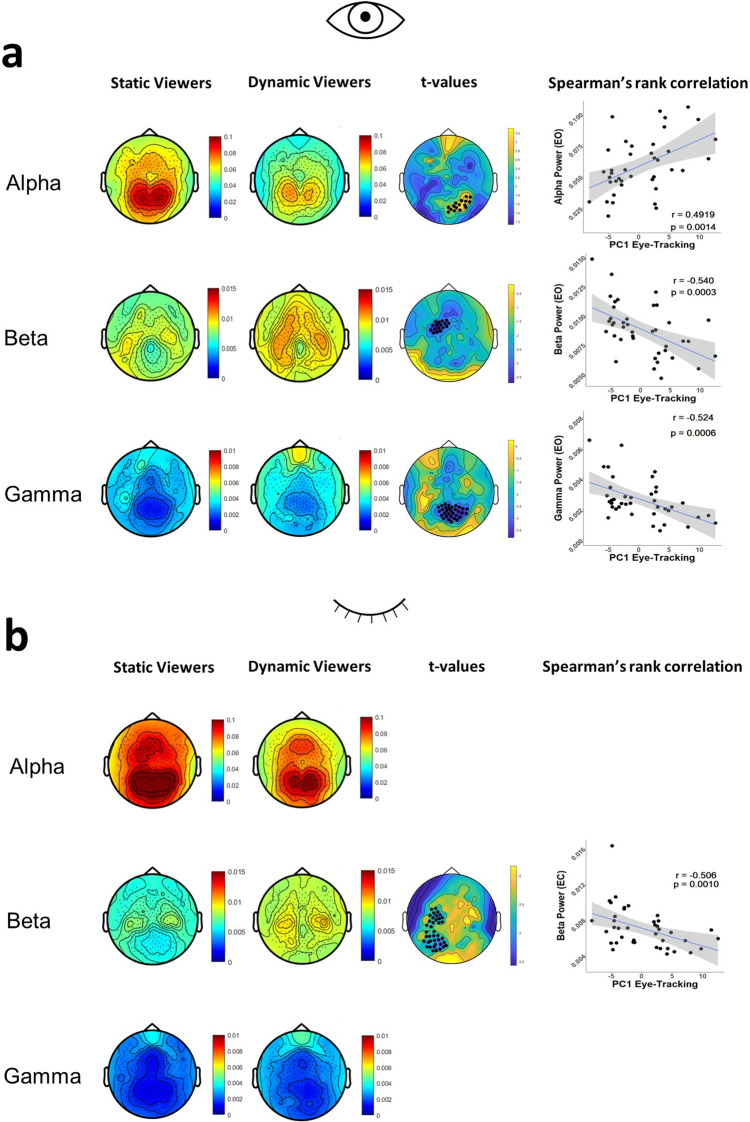
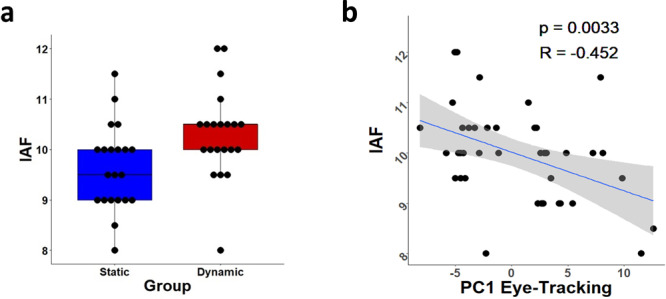
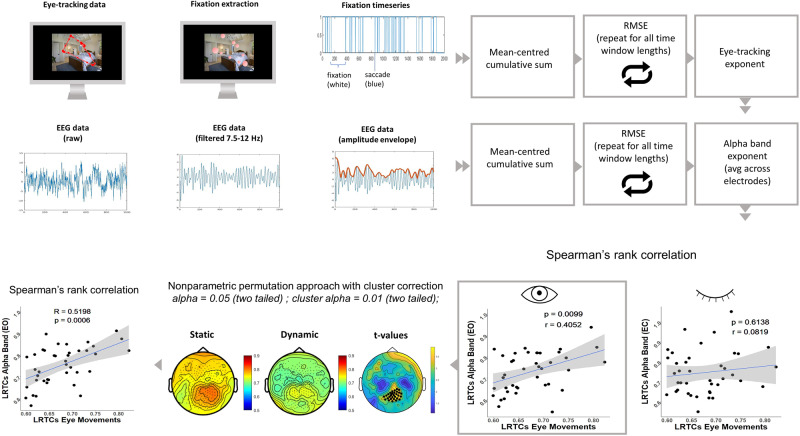
During visual exploration, eye movements are controlled by multiple stimulus- and goal-driven factors. We recently showed that the dynamics of eye movements -how/when the eye move- during natural scenes' free viewing were similar across individuals and identified two viewing styles: static and dynamic, characterized respectively by longer or shorter fixations. Interestingly, these styles could be revealed at rest, in the absence of any visual stimulus. This result supports a role of intrinsic activity in eye movement dynamics. Here we hypothesize that these two viewing styles correspond to different spontaneous patterns of brain activity. One year after the behavioural experiments, static and dynamic viewers were called back to the lab to record high density EEG activity during eyes open and eyes closed. Static viewers show higher cortical inhibition, slower individual alpha frequency peak, and longer memory of alpha oscillations. The opposite holds for dynamic viewers. We conclude that some properties of spontaneous activity predict exploratory eye movement dynamics during free viewing.


Conflict of interest statement

The authors declare no competing interests.

Figures

Fig. 1
Fig. 1. Spectral analysis results.
a Group scalp maps in eyes open condition for alpha (7.5–12 Hz), beta (12.5–32 Hz) and gamma (32.5–45 Hz) relative power and t-value maps (where the comparison yielded significant results) for the cluster-based permutation analysis. Black dots index significance with cluster alpha at p < 0.01 (two-tailed) and alpha p < 0.05 (two-tailed). The right panel shows the Spearman’s rank correlation between PC1 and averaged power in the significant cluster of electrodes (with Spearman’s r, p-value and 95% CI). N = 40. b Group scalp maps in eyes closed condition for alpha (7.5–12 Hz), beta (12.5–32 Hz) and gamma (32.5–45 Hz) relative power and t-value maps (where the comparison yielded significant results) for the cluster-based permutation analysis. Black dots index significance with cluster alpha at p < 0.01 (two-tailed) and alpha p < 0.05 (two-tailed). The right panel shows the Spearman’s rank correlation between PC1 and averaged power in the significant cluster of electrodes (with Spearman’s r, p-value and 95% CI). N = 40.
Fig. 2
Fig. 2. Individual alpha frequency results.
a Individual alpha frequency values by group (static n = 19, median = 9.5 Hz; dynamic n = 21, median = 10.5 Hz). N = 40. b Spearman’s rank correlation between PC1 and Individual Alpha Frequency values (with Spearman’s r, p-value and 95% CI). N = 40.56.
Fig. 3
Fig. 3. Procedure and results for DFA analysis.
Workflow for DFA analysis. For eye-tracking data, after extracting fixations with a velocity-based algorithm, a fixation timeseries is built (where 0 = fixation; 1 = saccade). EEG data are the first bandpass filtered in the frequency of interest (7.5–12 Hz, filter order = 66), then the amplitude envelope is computed. For both timeseries, DFA analysis is performed. First, a correlation between eye-tracking exponents and mean alpha band exponents (i.e., averaged across 256 channels) is computed. A significant positive correlation is found in the eyes open condition (r = 0.405, p = 0.009). In this condition, Spearman’s rank correlation coefficients are computed in each electrode between alpha band DFA exponents and eye-tracking DFA exponents. Null hypothesis testing is conducted by using the nonparametric permutation approach with cluster correction. Black dots index significance with cluster alpha at p < 0.01 (two-tailed) and alpha p < 0.05 (two-tailed). Finally, a Spearman’s rank correlation is computed between DFA exponents in eye movements and DFA exponents in alpha band in the significant cluster of electrodes (r = 0.455, p = 0.003). All the scatterplots show Spearman’s r, p-value, and 95% CI. N = 40. LRTCs long-range temporal correlations, RMSE root-mean-square error.

References

    1. Buzsáki, G. The Brain from Inside Out (Oxford University Press, 2019).
    1. Itti L, Koch C, Niebur E. A model of saliency-based visual attention for rapid scene analysis. IEEE Trans. Pattern Anal. Mach. Intell. 1998;20:1254–1259. doi: 10.1109/34.730558. - DOI
    1. Torralba A, Oliva A, Castelhano MS, Henderson JM. Contextual guidance of eye movements and attention in real-world scenes: the role of global features in object search. Psychol. Rev. 2006;113:766–786. doi: 10.1037/0033-295X.113.4.766. - DOI - PubMed
    1. Einhäuser W, Koch C. Task-demands can immediately reverse the effects of sensory-driven saliency in complex visual stimuli. J. Vis. 2008;8:1–19. doi: 10.1167/8.2.2. - DOI - PubMed
    1. Bargary G, et al. Individual differences in human eye movements: an oculomotor signature? Vis. Res. 2017;141:157–169. doi: 10.1016/j.visres.2017.03.001. - DOI - PubMed

Publication types