. 2022 Dec 12;12(1):21463.
doi: 10.1038/s41598-022-25891-y.

Development and validation of a mathematical model of heart rate response to fluid perturbation

Affiliations

Development and validation of a mathematical model of heart rate response to fluid perturbation

Varun Kanal et al. Sci Rep. .

Abstract

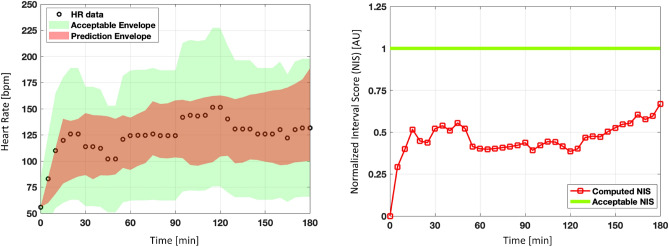
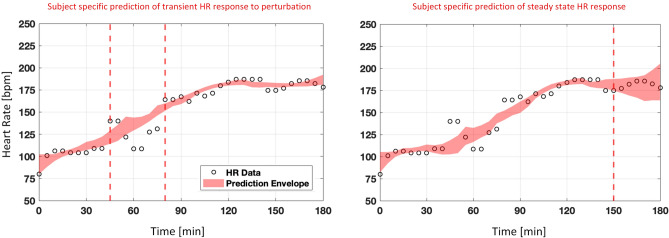
Physiological closed-loop controlled (PCLC) medical devices monitor and automatically adjust the patient's condition by using physiological variables as feedback, ideally with minimal human intervention to achieve the target levels set by a clinician. PCLC devices present a challenge when it comes to evaluating their performance, where conducting large clinical trials can be expensive. Virtual physiological patients simulated by validated mathematical models can be utilized to obtain pre-clinical evidence of safety and assess the performance of the PCLC medical device during normal and worst-case conditions that are unlikely to happen in a limited clinical trial. A physiological variable that plays a major role during fluid resuscitation is heart rate (HR). For in silico assessment of PCLC medical devices regarding fluid perturbation, there is currently no mathematical model of HR validated in terms of its predictive capability performance. This paper develops and validates a mathematical model of HR response using data collected from sheep subjects undergoing hemorrhage and fluid infusion. The model proved to be accurate in estimating the HR response to fluid perturbation, where averaged between 21 calibration datasets, the fitting performance showed a normalized root mean square error (NRMSE) of [Formula: see text]. The model was also evaluated in terms of model predictive capability performance via a leave-one-out procedure (21 subjects) and an independent validation dataset (6 subjects). Two different virtual cohort generation tools were used in each validation analysis. The generated envelope of virtual subjects robustly met the defined acceptance criteria, in which [Formula: see text] of the testing datasets presented simulated HR patterns that were within a deviation of 50% from the observed data. In addition, out of 16000 and 18522 simulated subjects for the leave-one-out and independent datasets, the model was able to generate at least one virtual subject that was close to the real subject within an error margin of [Formula: see text] and [Formula: see text] NRMSE, respectively. In conclusion, the model can generate valid virtual HR physiological responses to fluid perturbation and be incorporated into future non-clinical simulated testing setups for assessing PCLC devices intended for fluid resuscitation.


Conflict of interest statement

The authors declare no competing interests.

Figures

Figure 1
Figure 1
Model overview: (A) the model structure to map the hemorrhage and fluid infusion inputs to the heart rate response. The model consists of three parts. The first part maps the transient change in the heart rate due to hemorrhage, the second part maps the transient change in the heart rate due to fluid infusion, and the last part maps the long-term changes due to hemorrhage. (B) This illustrates how the model maps the transient changes in the heart rate due to hemorrhage and fluid infusion. (C) This shows the time-varying long-term target for the heart rate rise due to hemorrhage. (D), (E) This illustrates the control-oriented approach to modeling the long-term changes in the heart rate due to hemorrhage.
Figure 2
Figure 2
Sensitivity analysis using the Morris method for one representative subject. Analysis is done at 4 time points; 30 min, 80 min, 120 min, and 180 min. Mean and standard deviation of the Elementary Effect are plotted. A higher mean indicates that the parameter has a higher influence on the output of the model, while a higher standard deviation indicates higher interaction of the parameter with other parameters.
Figure 3
Figure 3
A representative assessment of predictive capability performance with acceptable NIS of 1. An acceptable NIS is defined that allows a maximum permissible deviation of the predicted heart rate value from the observed heart rate value (±50% in the left figure). An acceptable NIS threshold of 1 is shown in the right figure. The generated envelope is acceptable if the computed NIS is equal or less than the acceptable NIS threshold.
Figure 4
Figure 4
Compartment method of cohort generation: (A) the model parameters are divided into three compartments. These are (1) parameters that map the heart rate changes due to hemorrhage, (2) parameters that map the heart rate changes due to fluid infusion, and (3) parameters that define the controller. (B) The virtual subject is generated by (1) mixing the compartments from three different subjects and (2) by taking the average of the compartments from the three subjects.
Figure 5
Figure 5
Model calibration performance: This figure illustrates the model estimated heart rate to fluid perturbation in one representative subject. The graph on the left shows the hemorrhage (red) and infusion (blue) patterns. The graph on the right shows the subject’s observed heart rate (red) and the model’s estimated heart rate response (black).
Figure 6
Figure 6
Subject specific prediction assessment under two scenarios. (A) Left: prediction envelope for the transient response (45–80 min) by fitting the model to a sub-sample of heart rate measurement between 0–45 and 80–180 min. (B) Right: prediction envelope for the steady-state response (150–180 min) by fitting the model to a sub-sample of heart rate measurements between 0 and 150 min. Refer to Fig. 5 for the hemorrhage and fluid infusion profile.
Figure 7
Figure 7
Predictive capability assessment for a fully virtual subject. (A) The plots depict the performance using the leave-one-out approach with the uniform method (left) and the compartment method (right) of cohort generation. (B) The plots depict the performance using the independent dataset approach with the uniform method (left) and the compartment method (right) of cohort generation.

References

    1. Hemmerling TM. Automated anesthesia. Curr. Opin. Anesthesiol. 2009;22:757–763. doi: 10.1097/ACO.0b013e328332c9b4. - DOI - PubMed
    1. Doyle FJ, III, Huyett LM, Lee JB, Zisser HC, Dassau E. Closed-loop artificial pancreas systems: Engineering the algorithms. Diabetes Care. 2014;37:1191–1197. doi: 10.2337/dc13-2108. - DOI - PMC - PubMed
    1. Hosain MK, Kouzani A, Tye S. Closed loop deep brain stimulation: An evolving technology. Austral. Phys. Eng. Sci. Med. 2014;37:619–634. doi: 10.1007/s13246-014-0297-2. - DOI - PubMed
    1. Bighamian R, Kim C-S, Reisner AT, Hahn J-O. Closed-loop fluid resuscitation control via blood volume estimation. J. Dyn. Syst. Meas. Control. 2016;138:569. doi: 10.1115/1.4033833. - DOI
    1. Marques NR, et al. Automated closed-loop resuscitation of multiple hemorrhages: A comparison between fuzzy logic and decision table controllers in a sheep model. Disaster Military Med. 2017;3:1–10. doi: 10.1186/s40696-016-0029-0. - DOI - PMC - PubMed

Publication types