. 2023 Jan;55(1):112-122.
doi: 10.1038/s41588-022-01248-z. Epub 2022 Dec 12.

DNA methylation QTL mapping across diverse human tissues provides molecular links between genetic variation and complex traits

Affiliations

DNA methylation QTL mapping across diverse human tissues provides molecular links between genetic variation and complex traits

Meritxell Oliva et al. Nat Genet. 2023 Jan.

Abstract

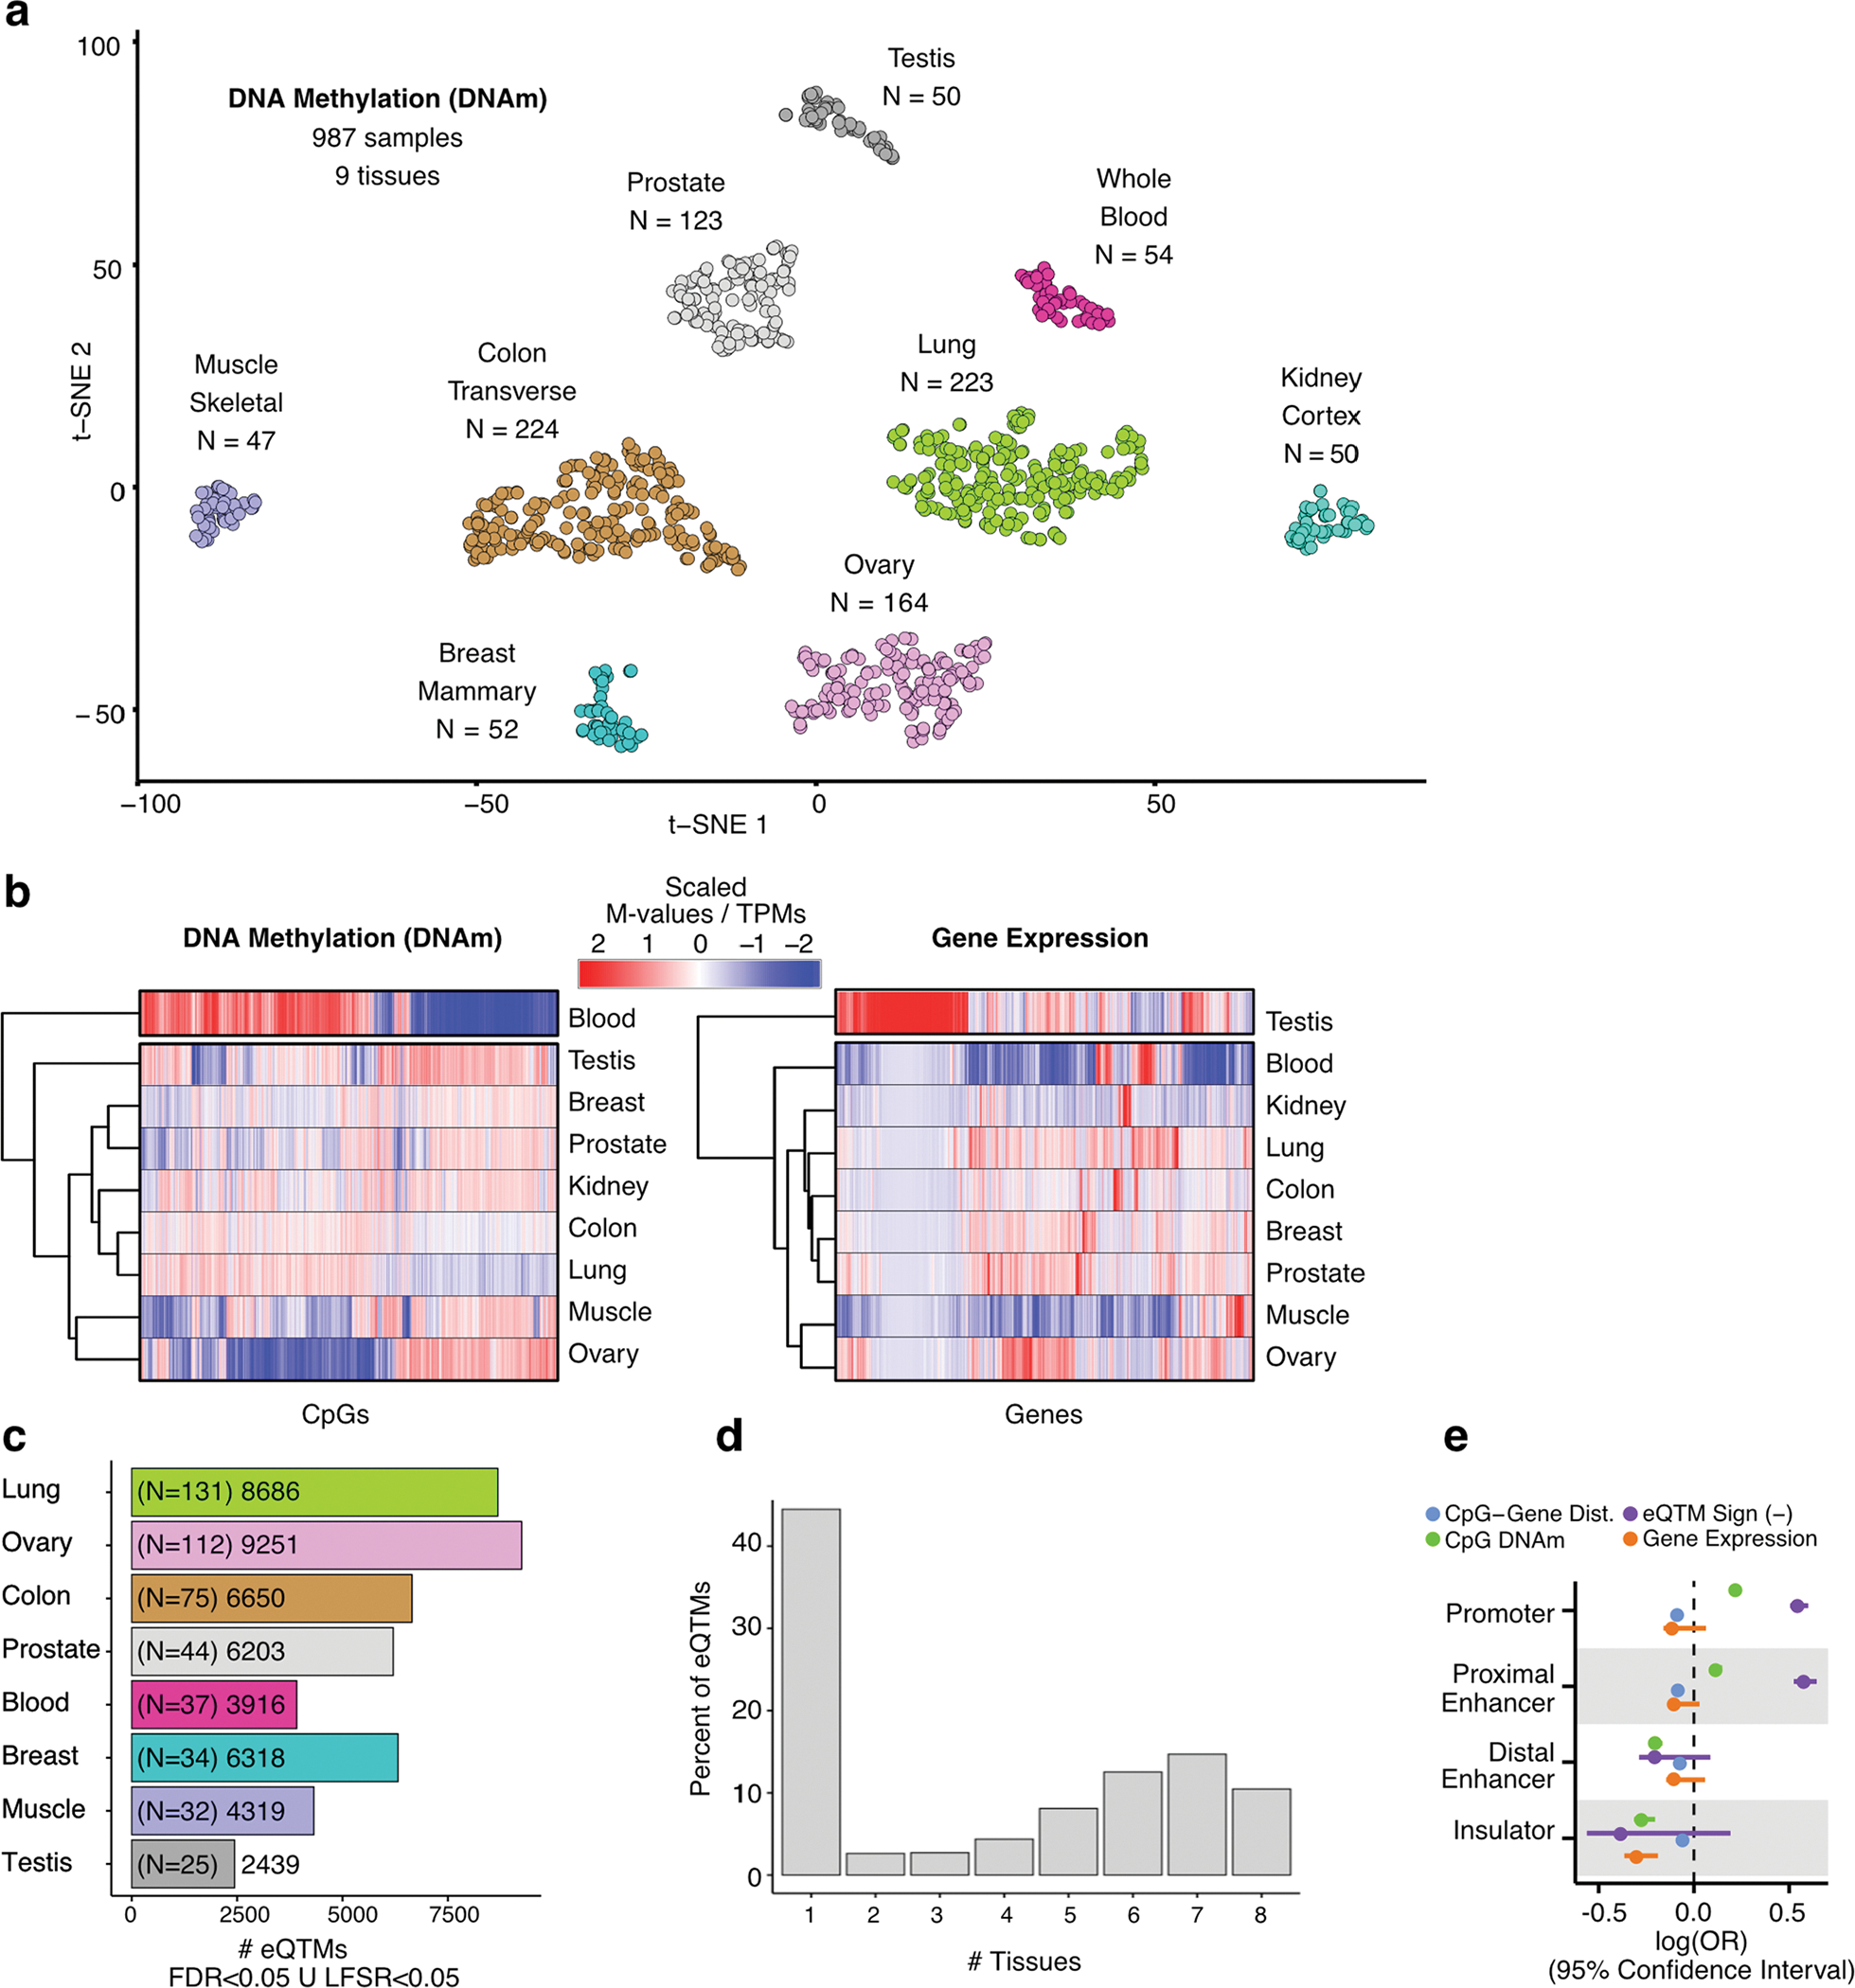
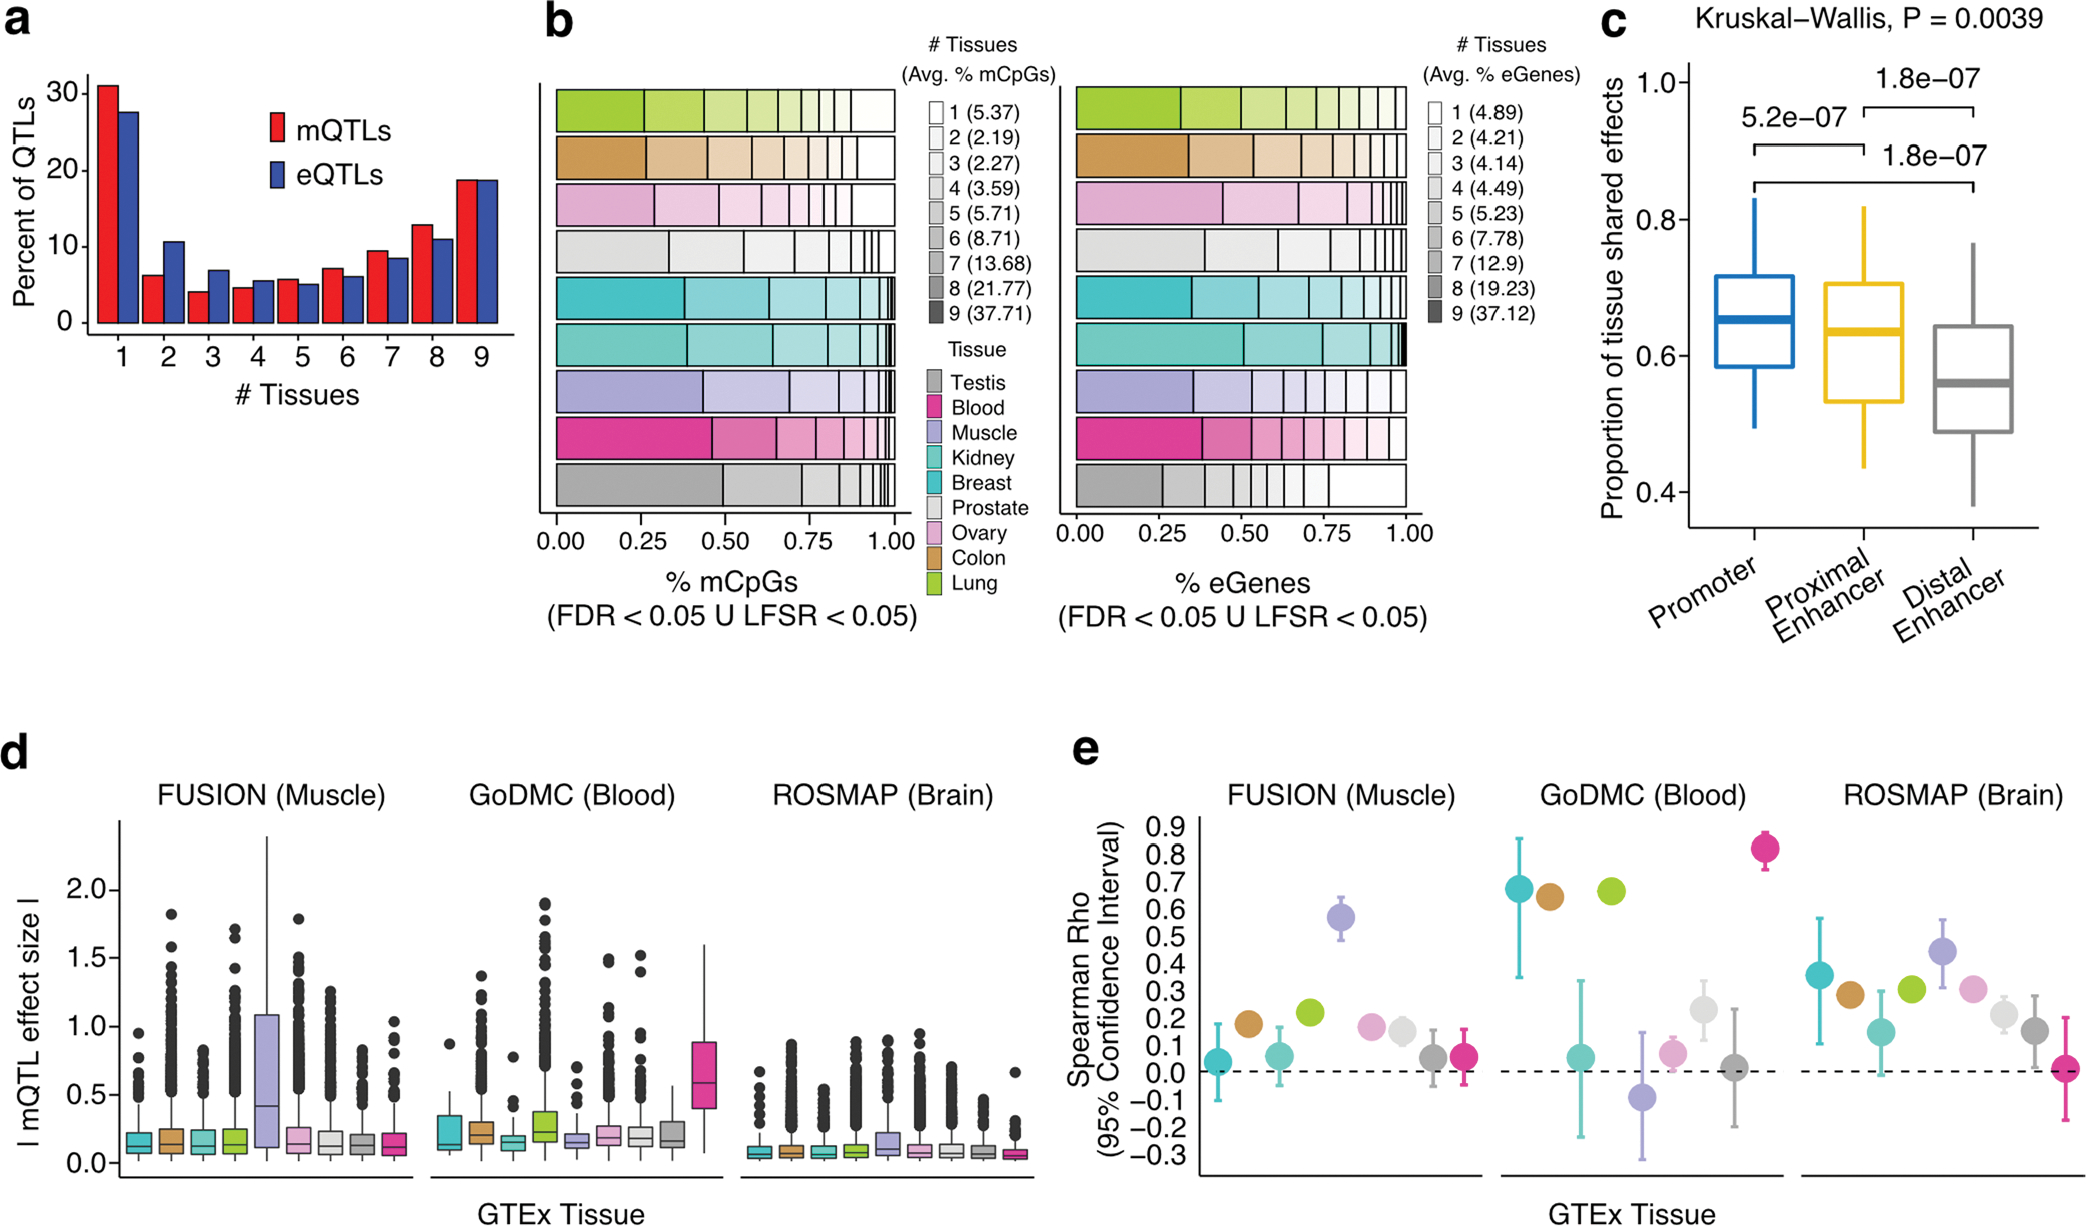
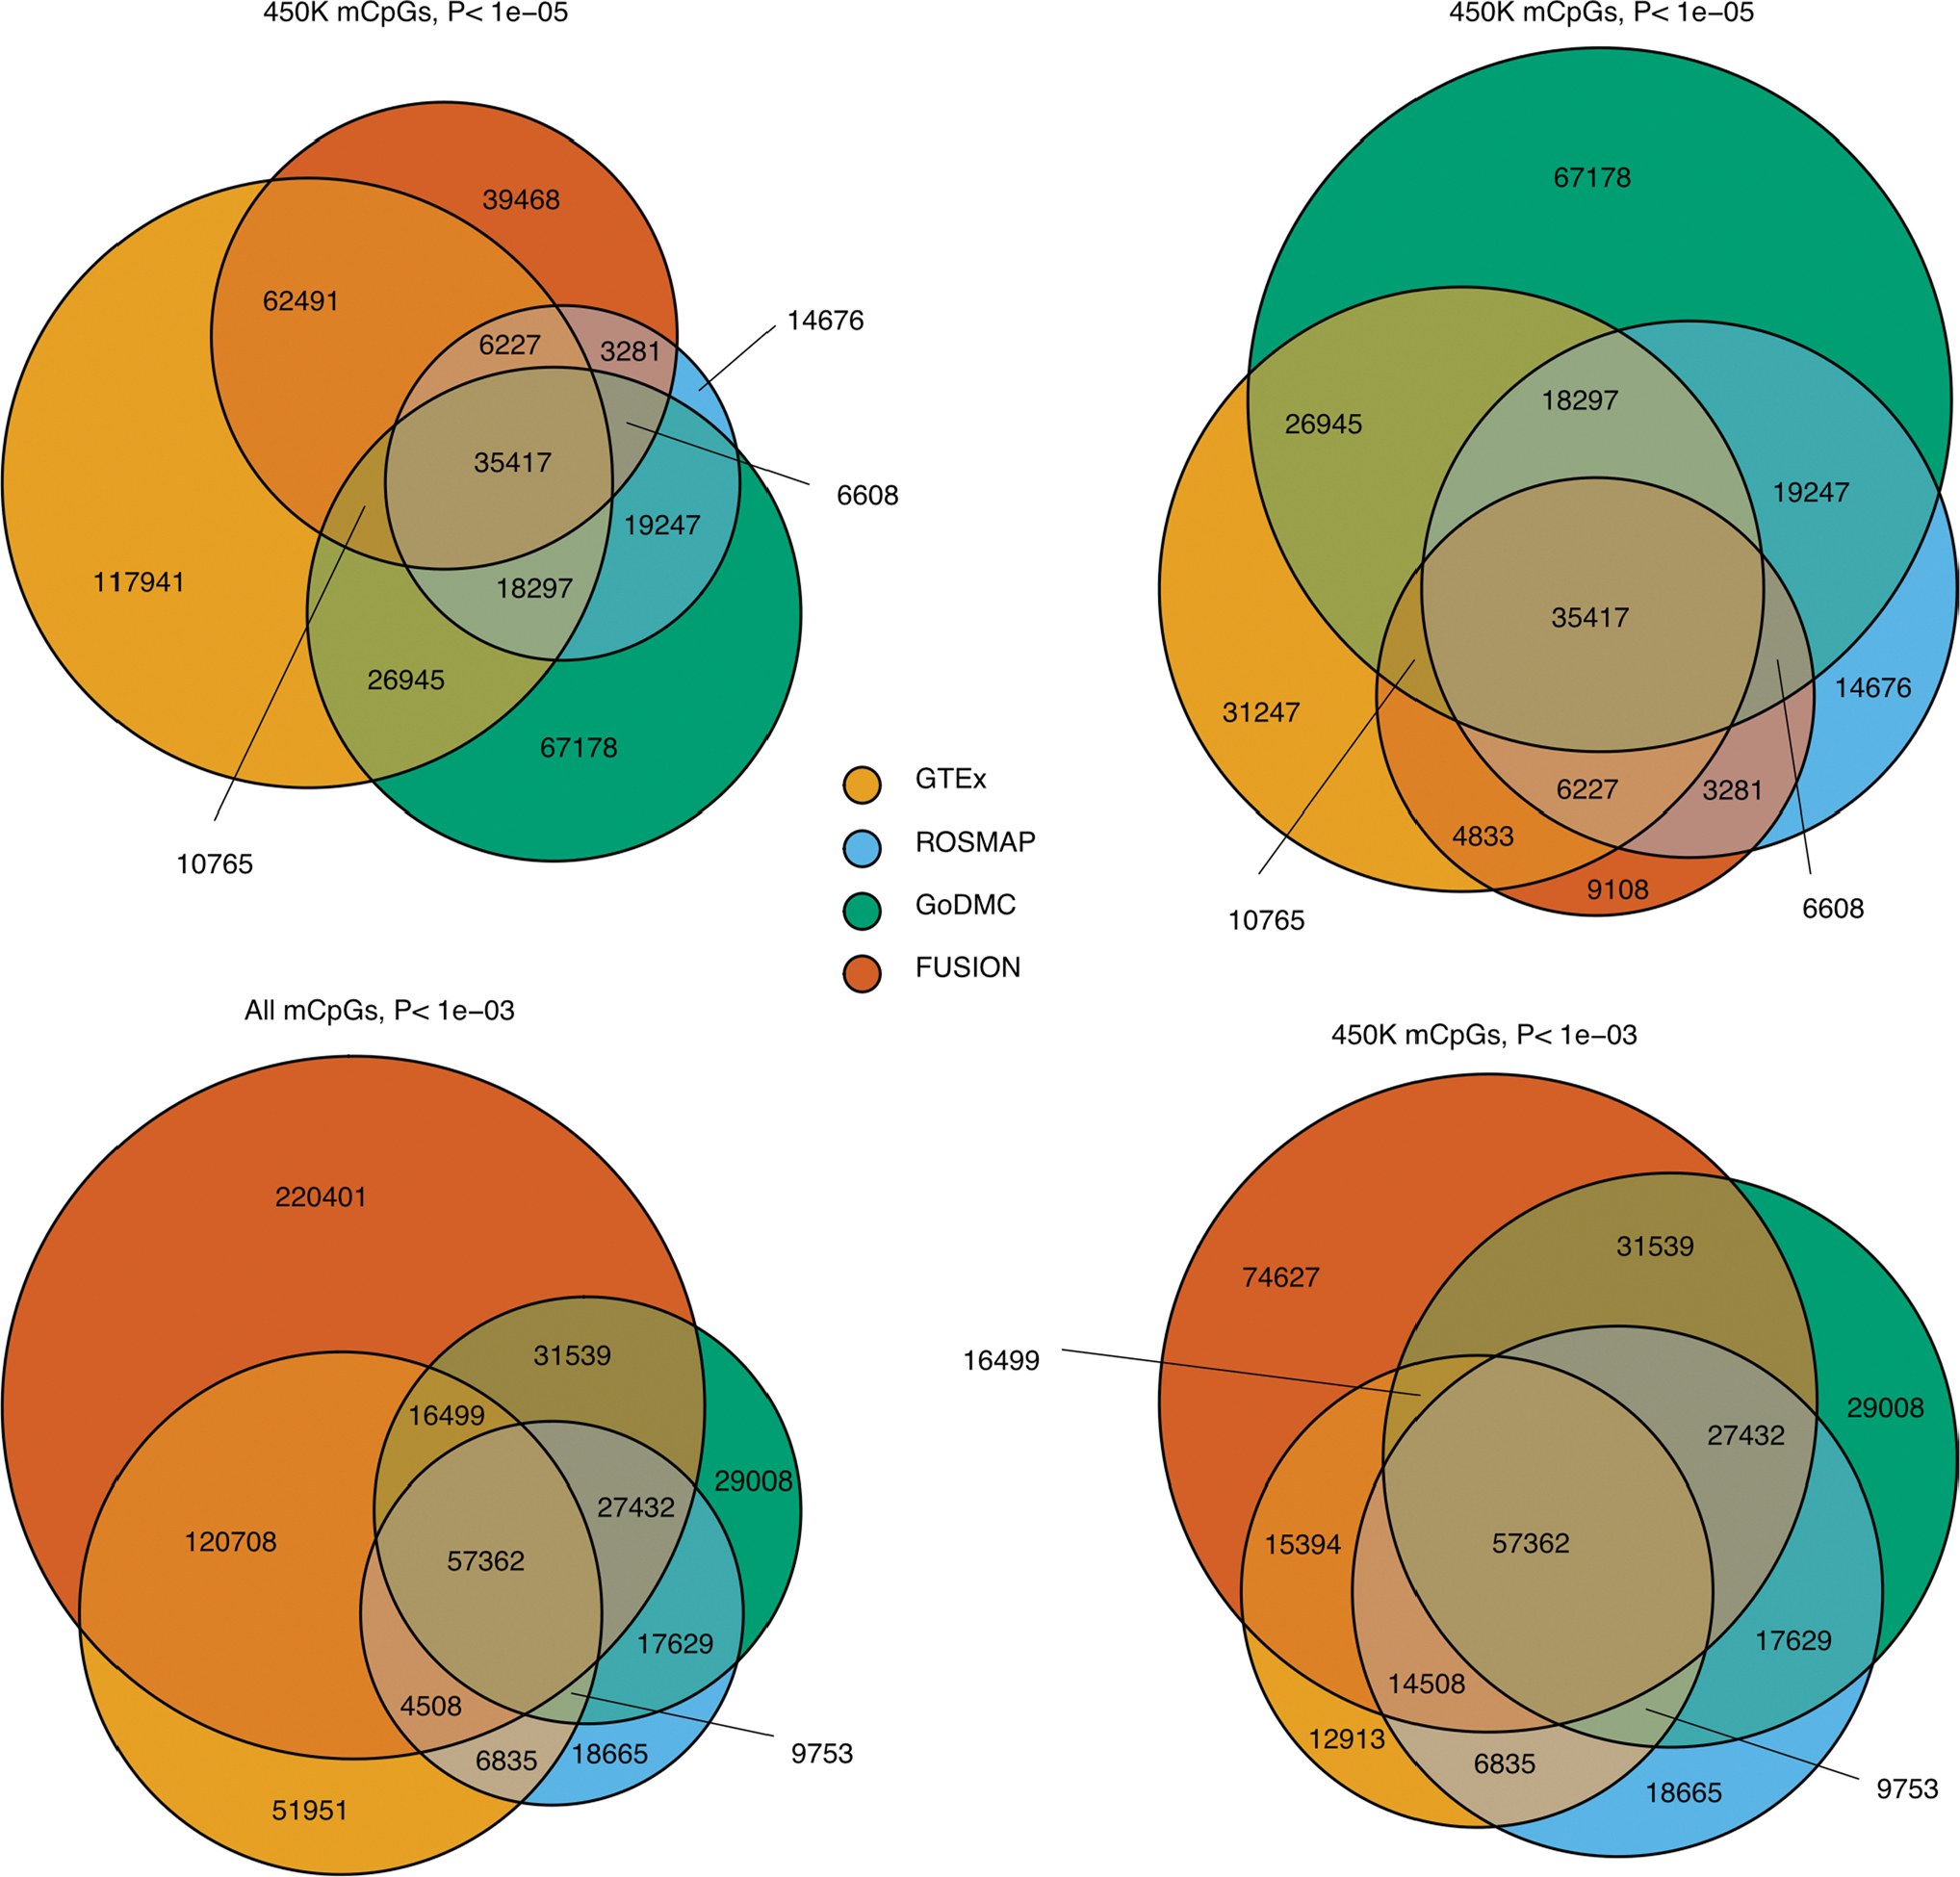
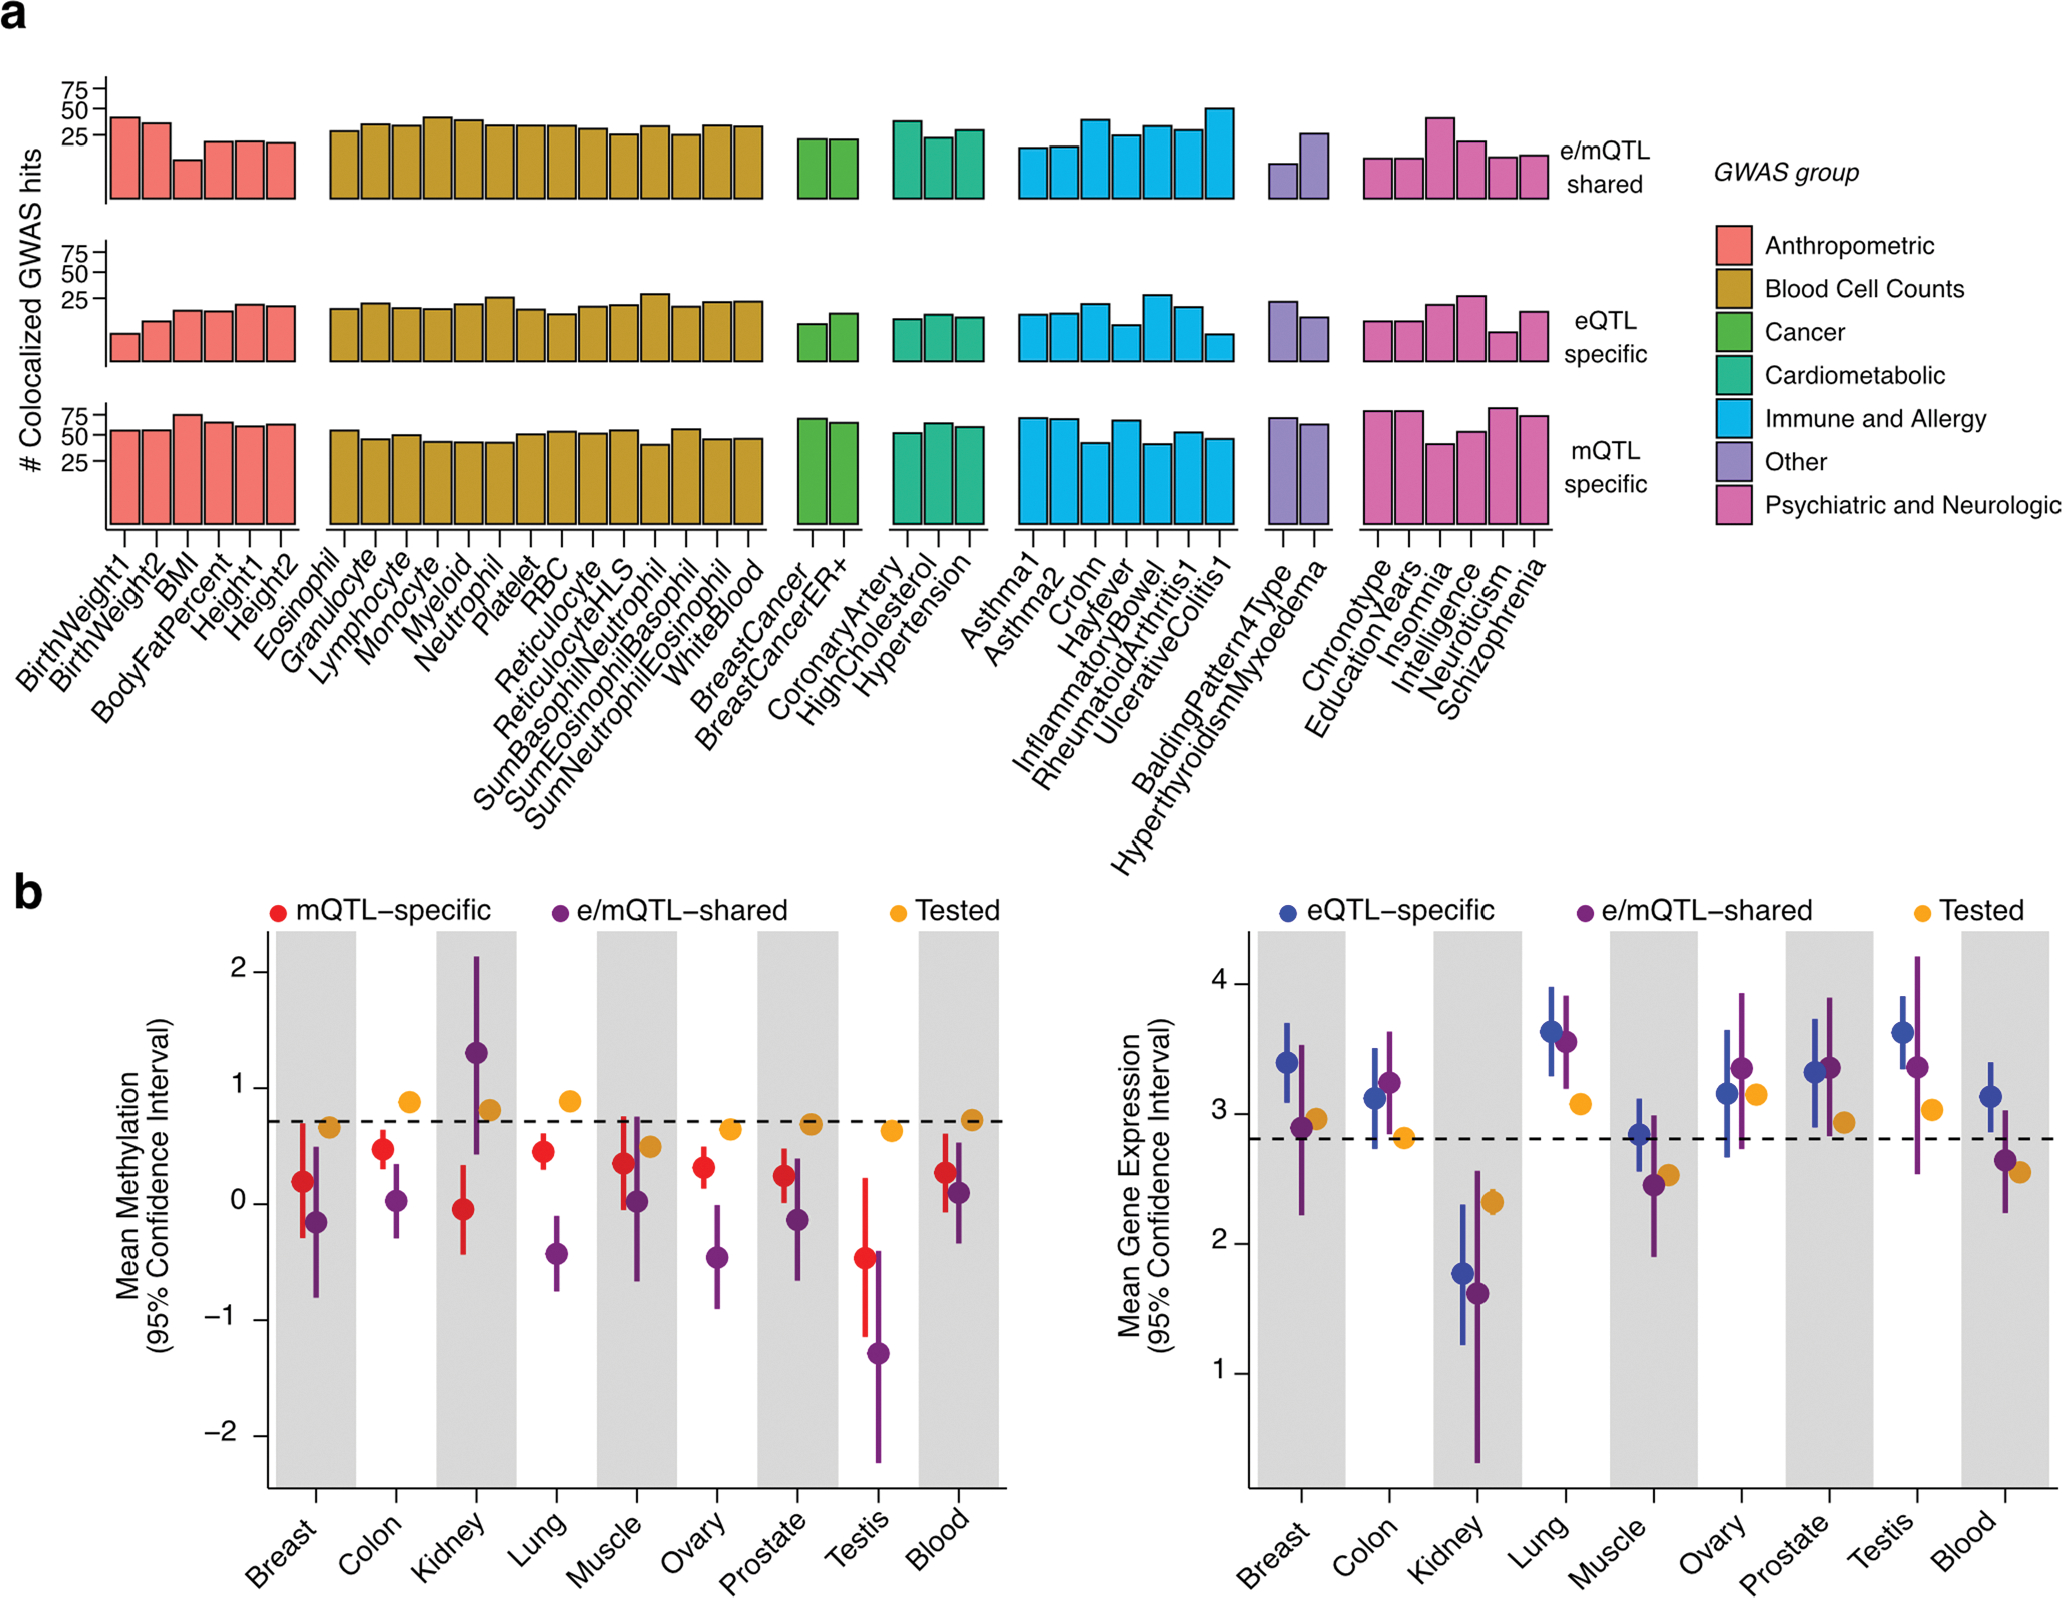
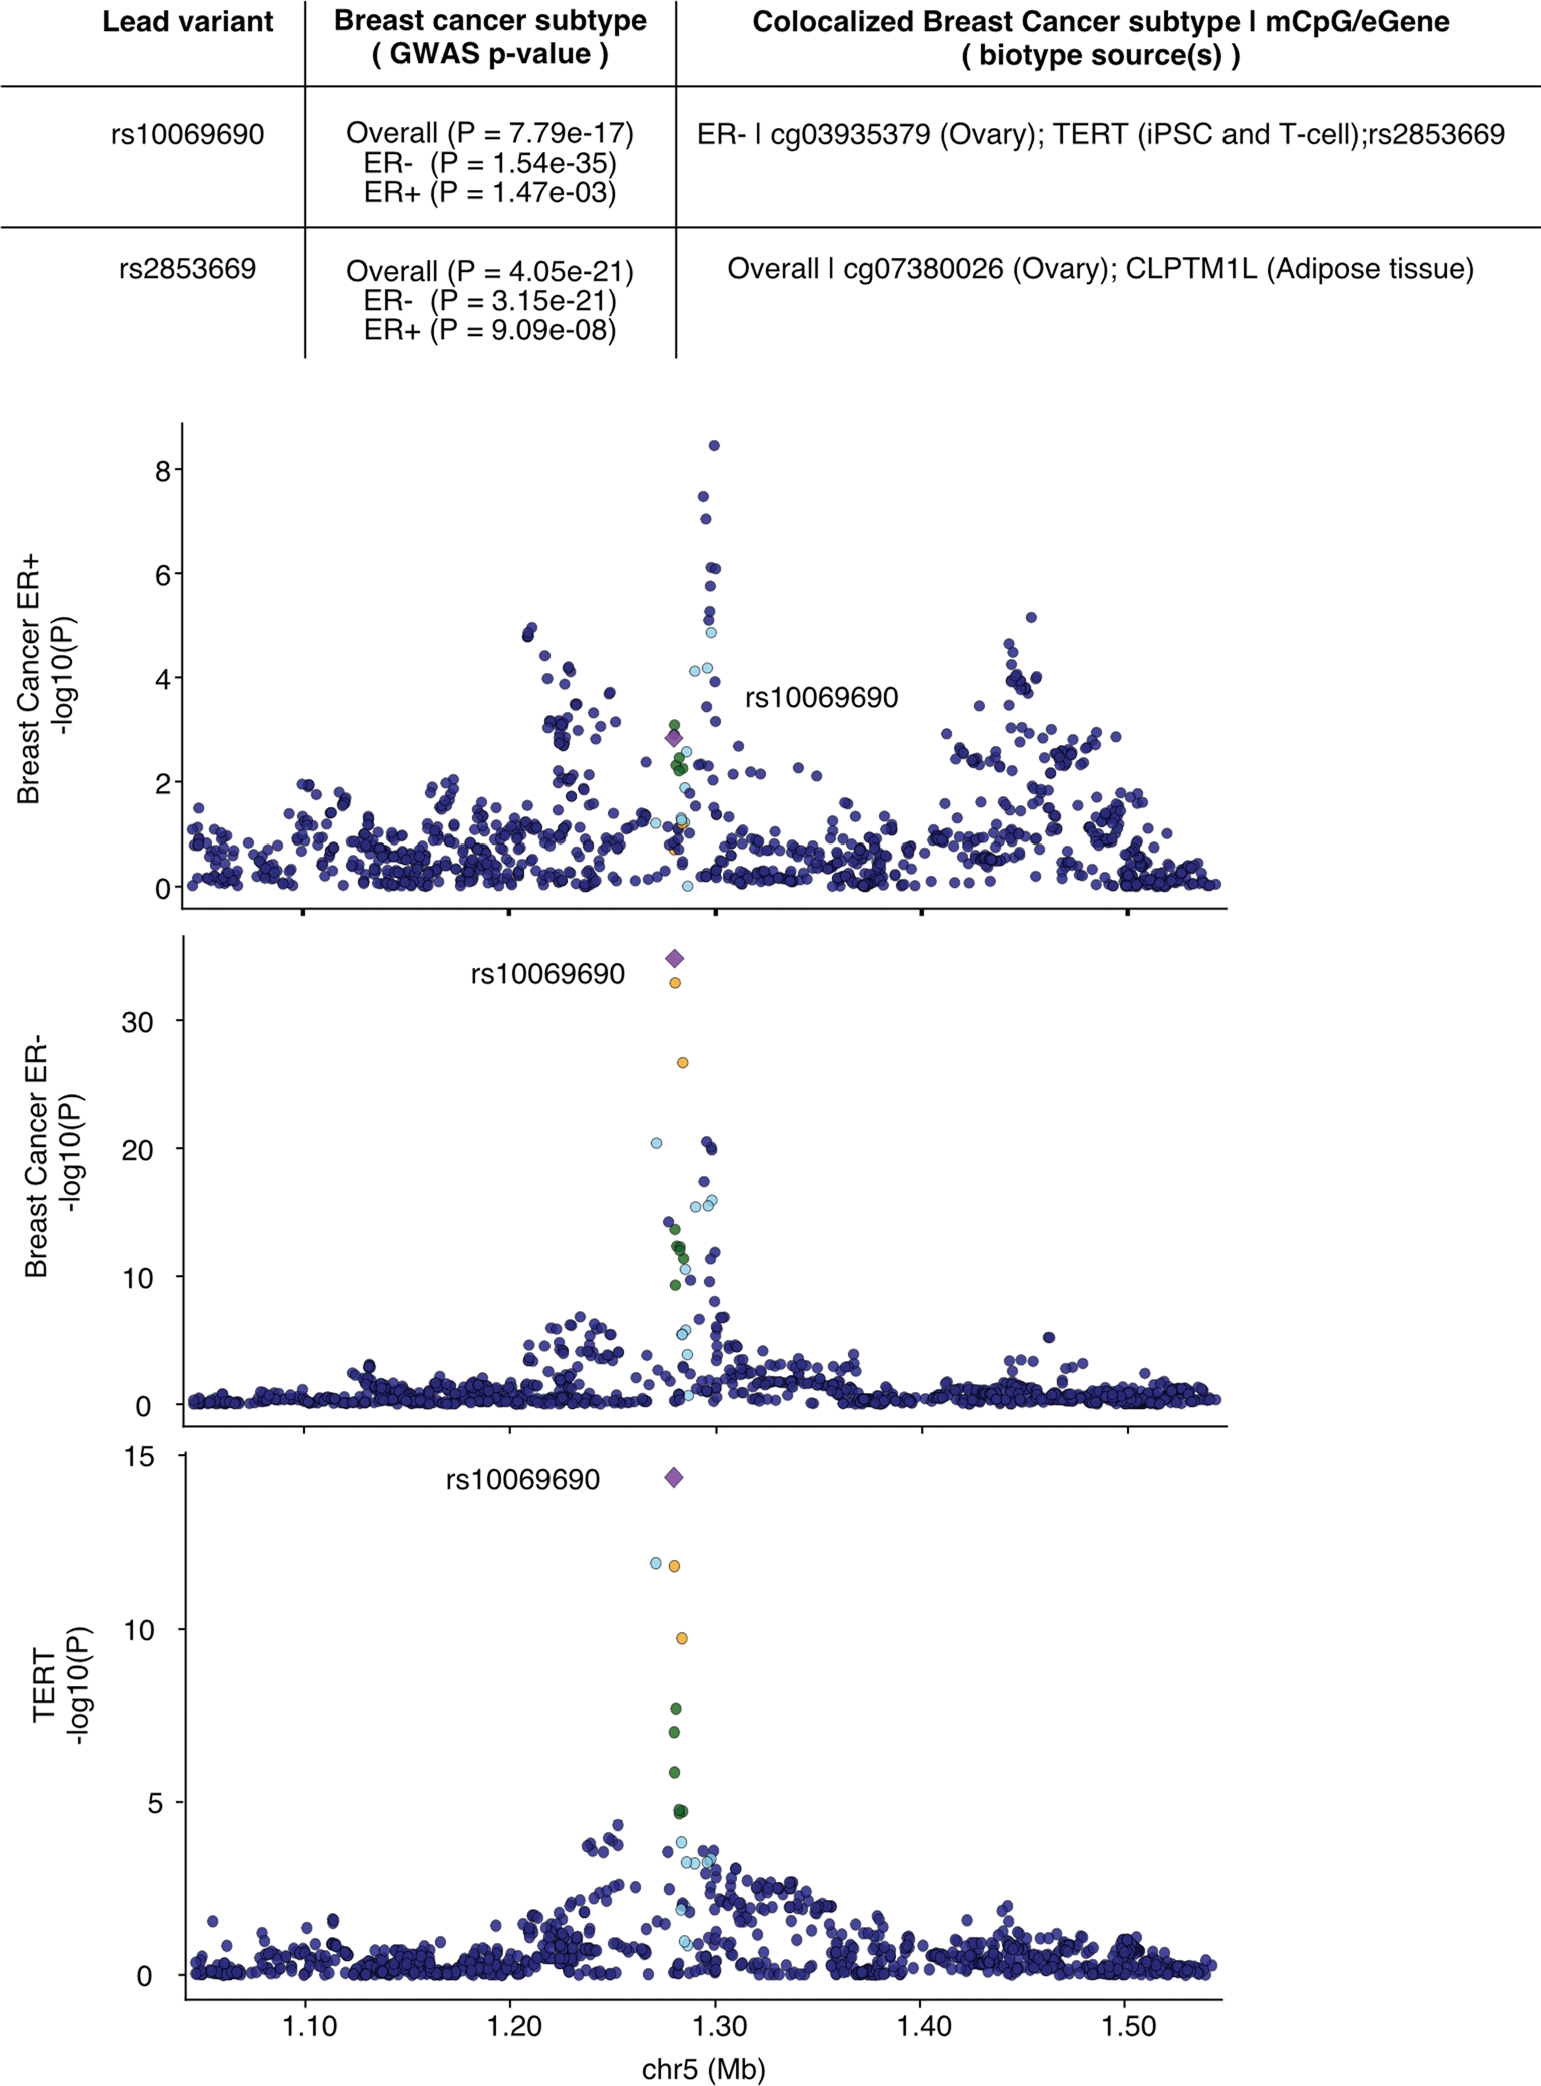
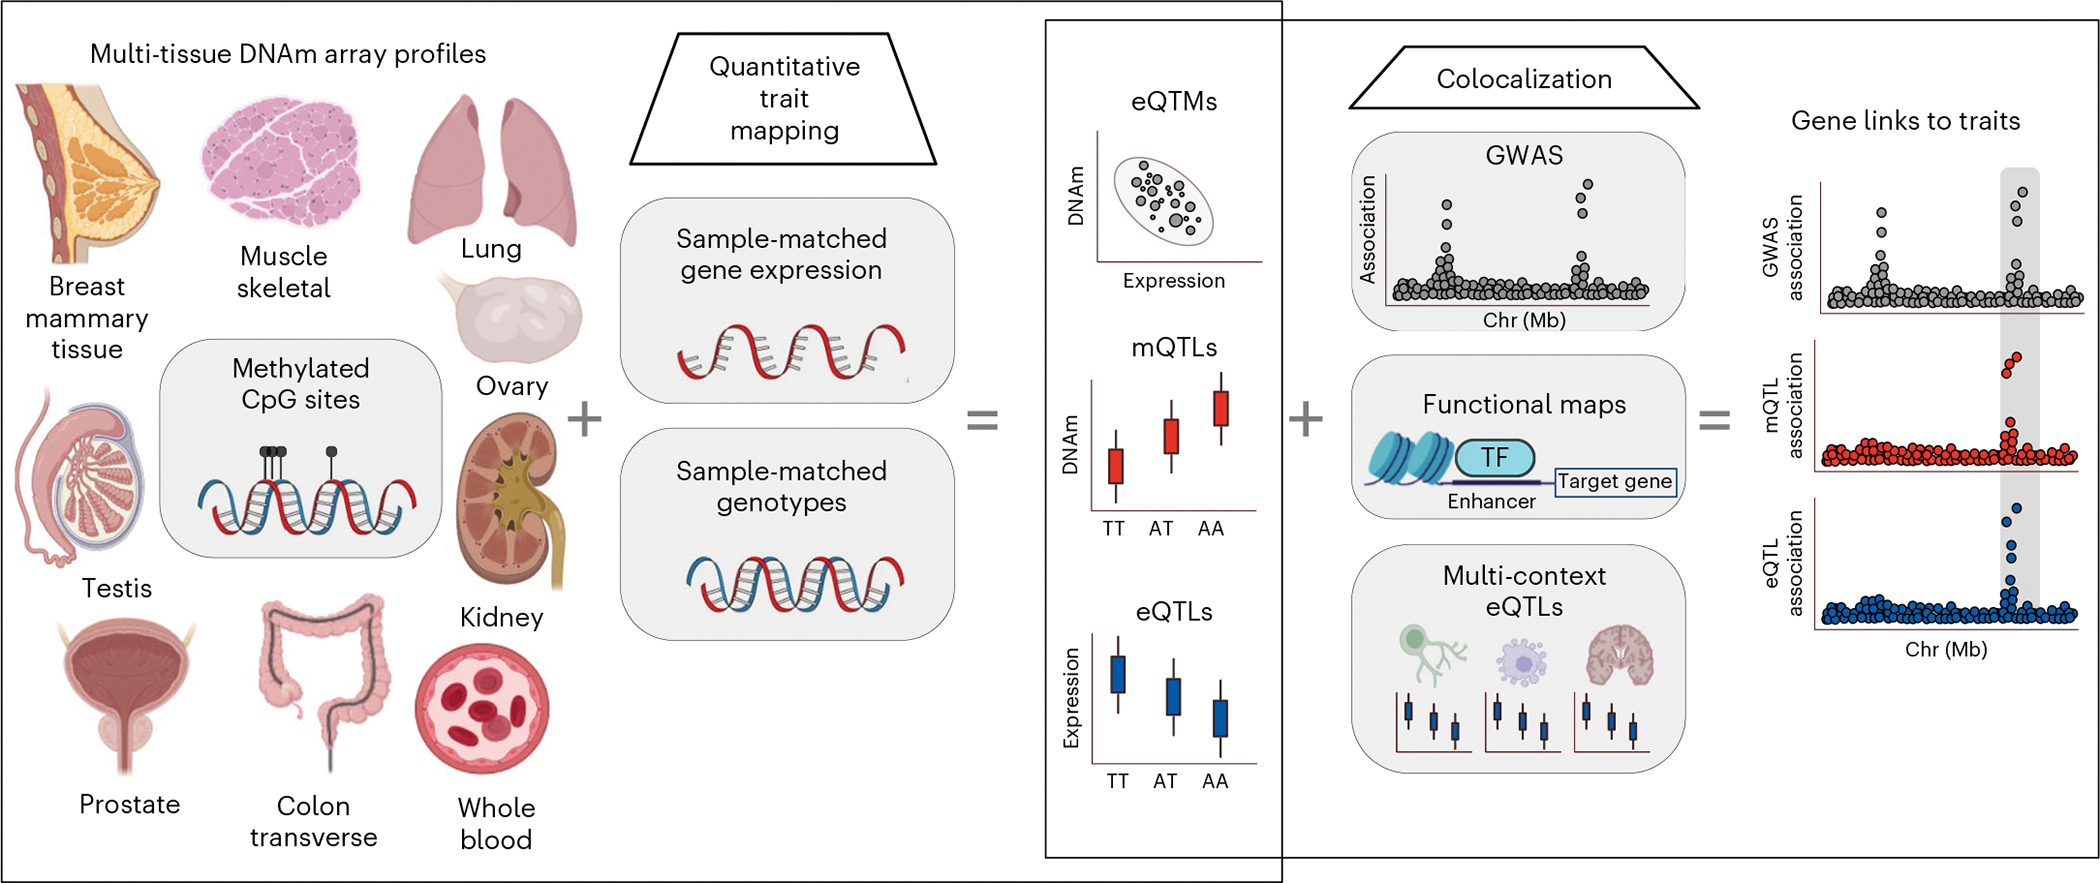
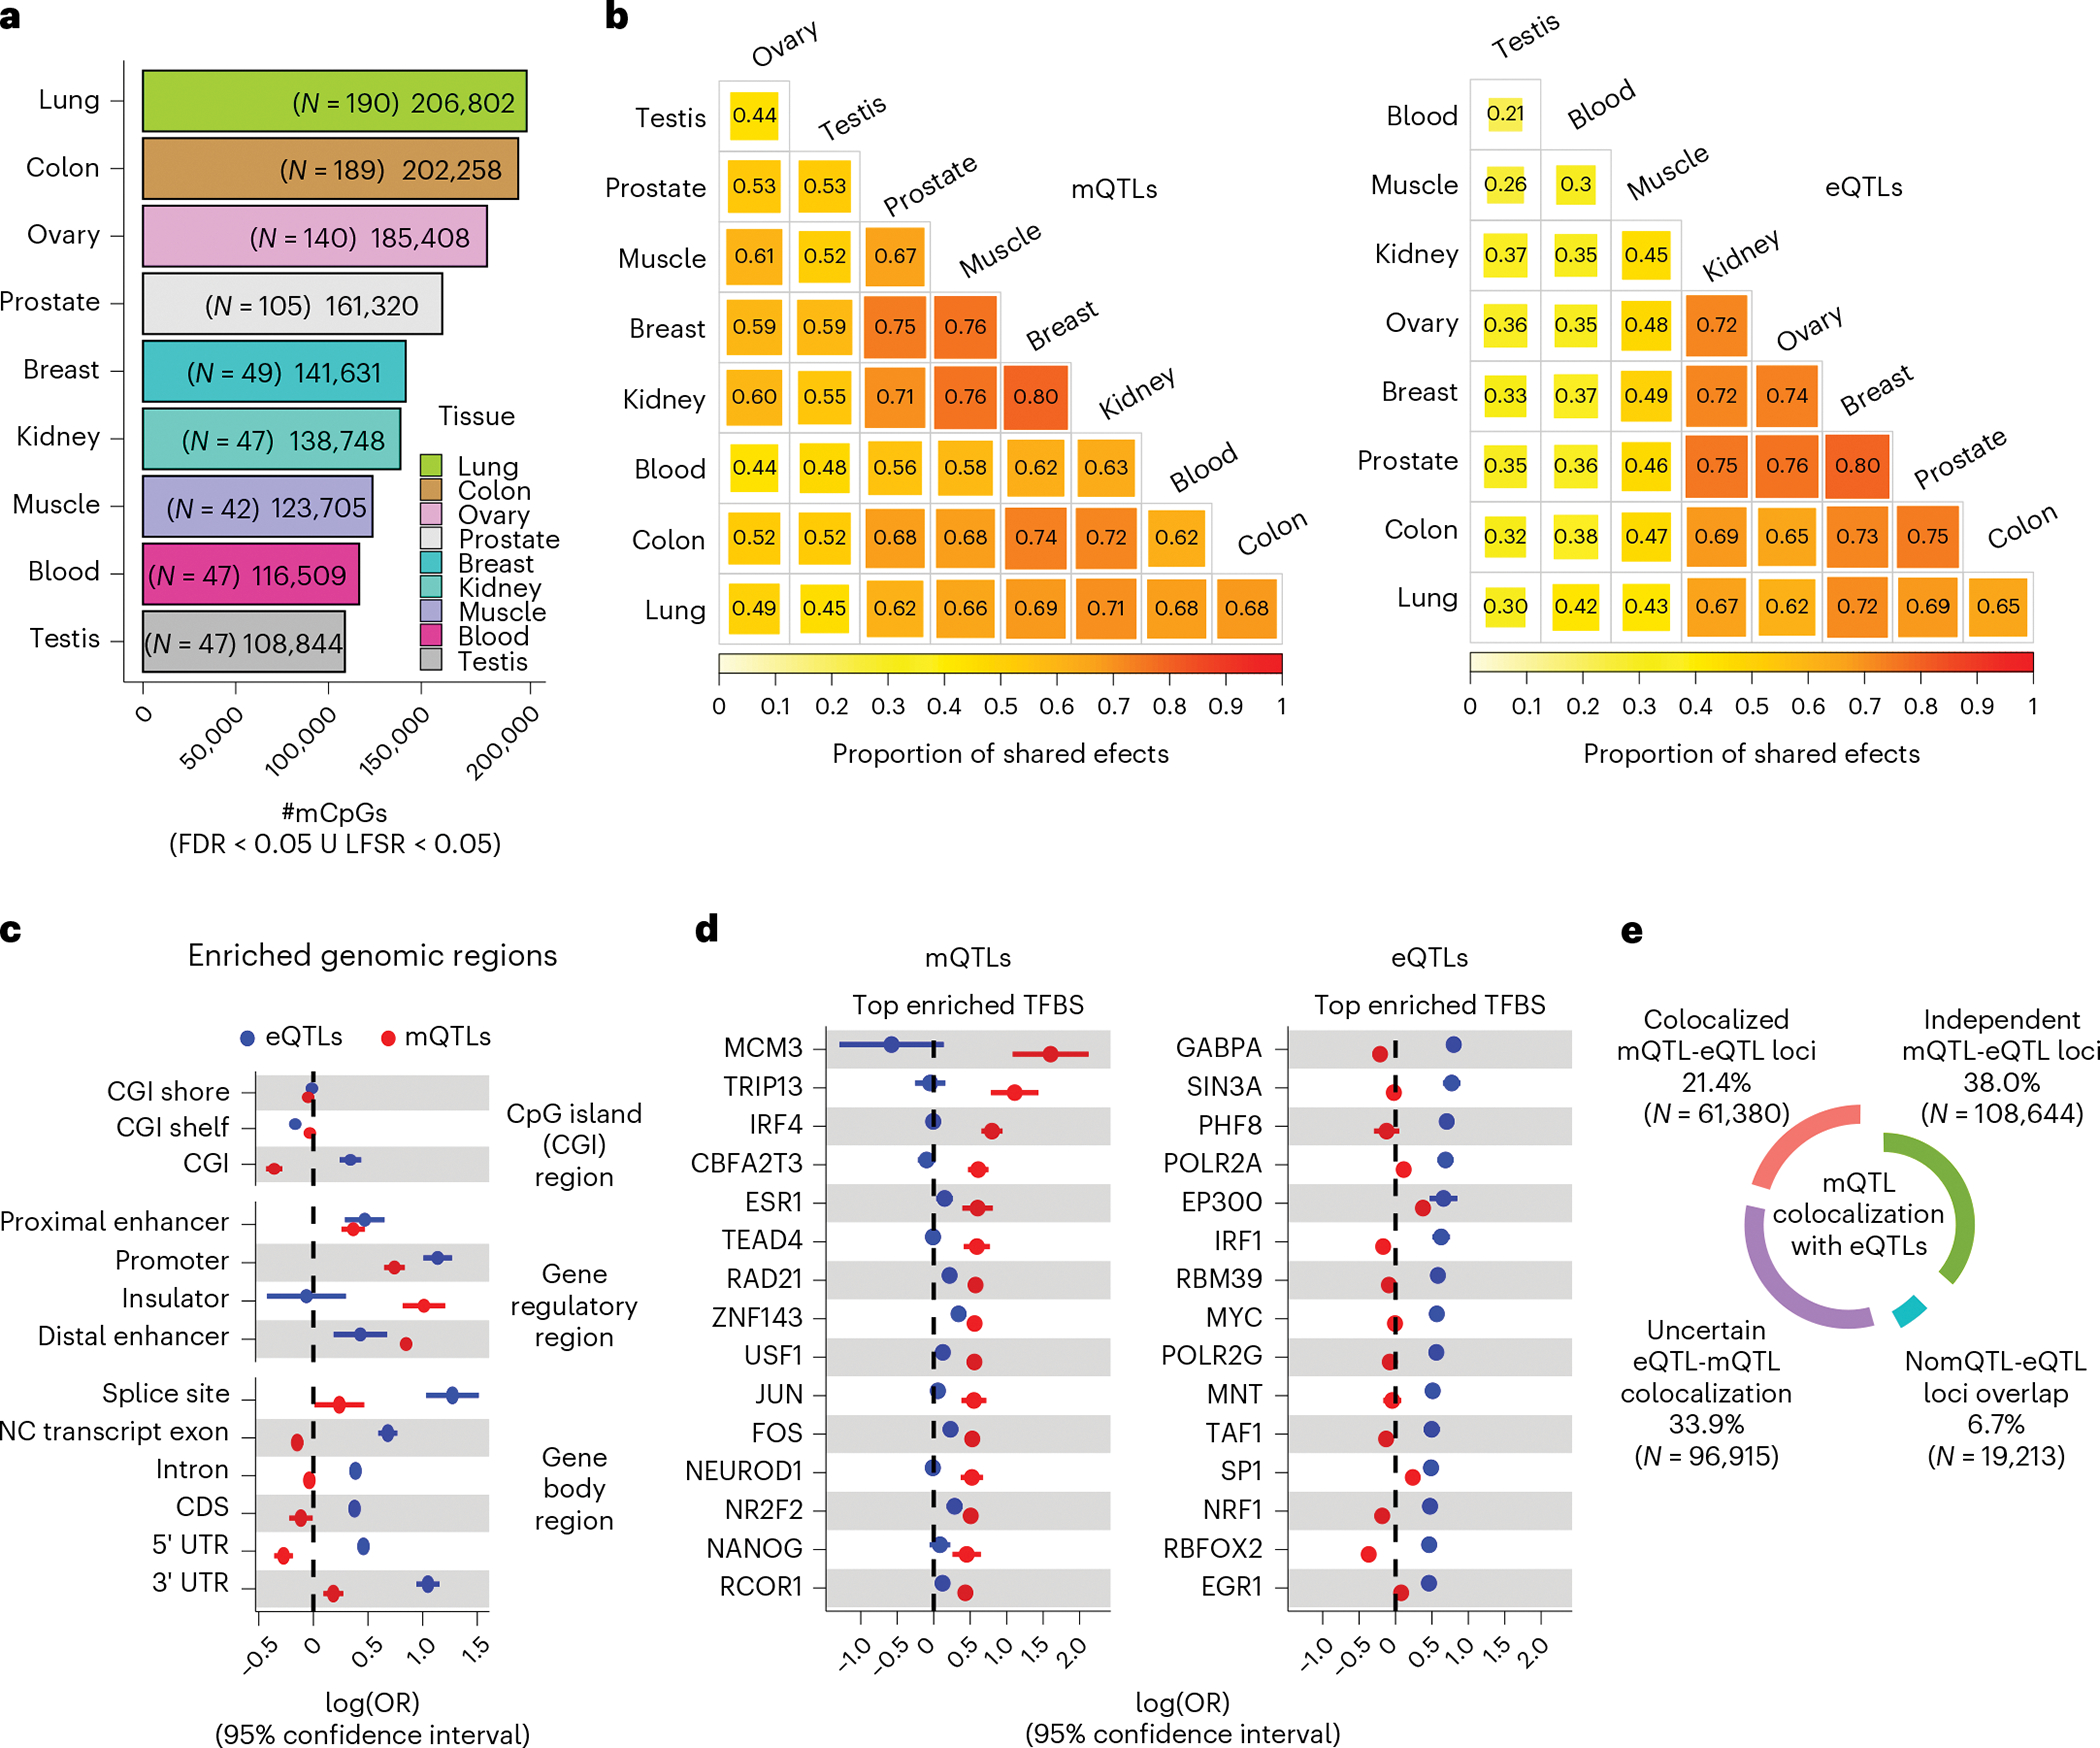
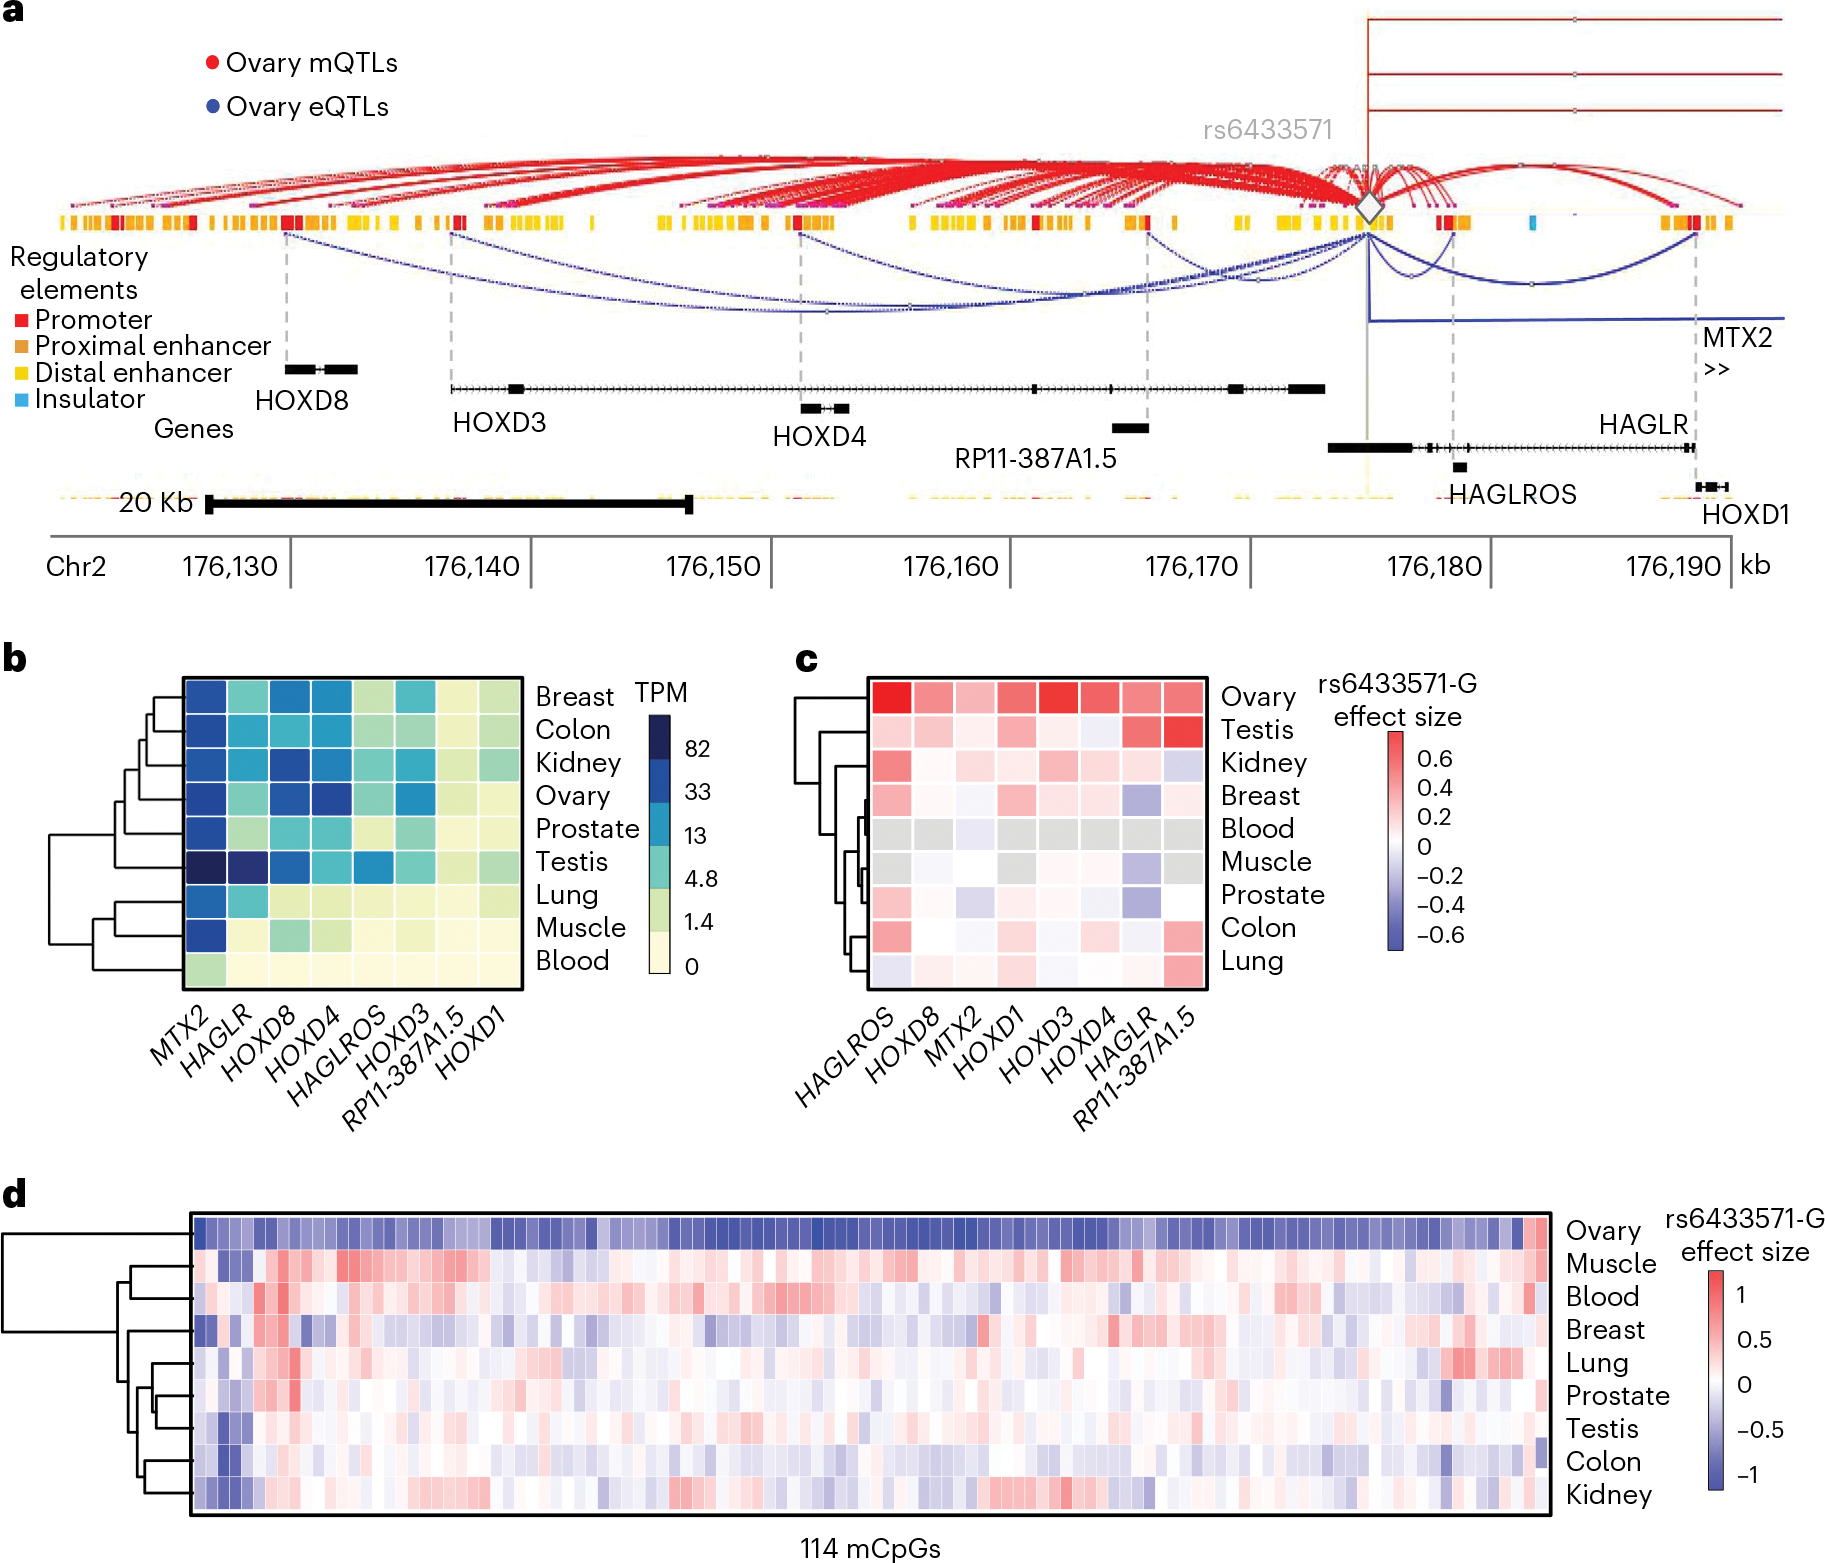
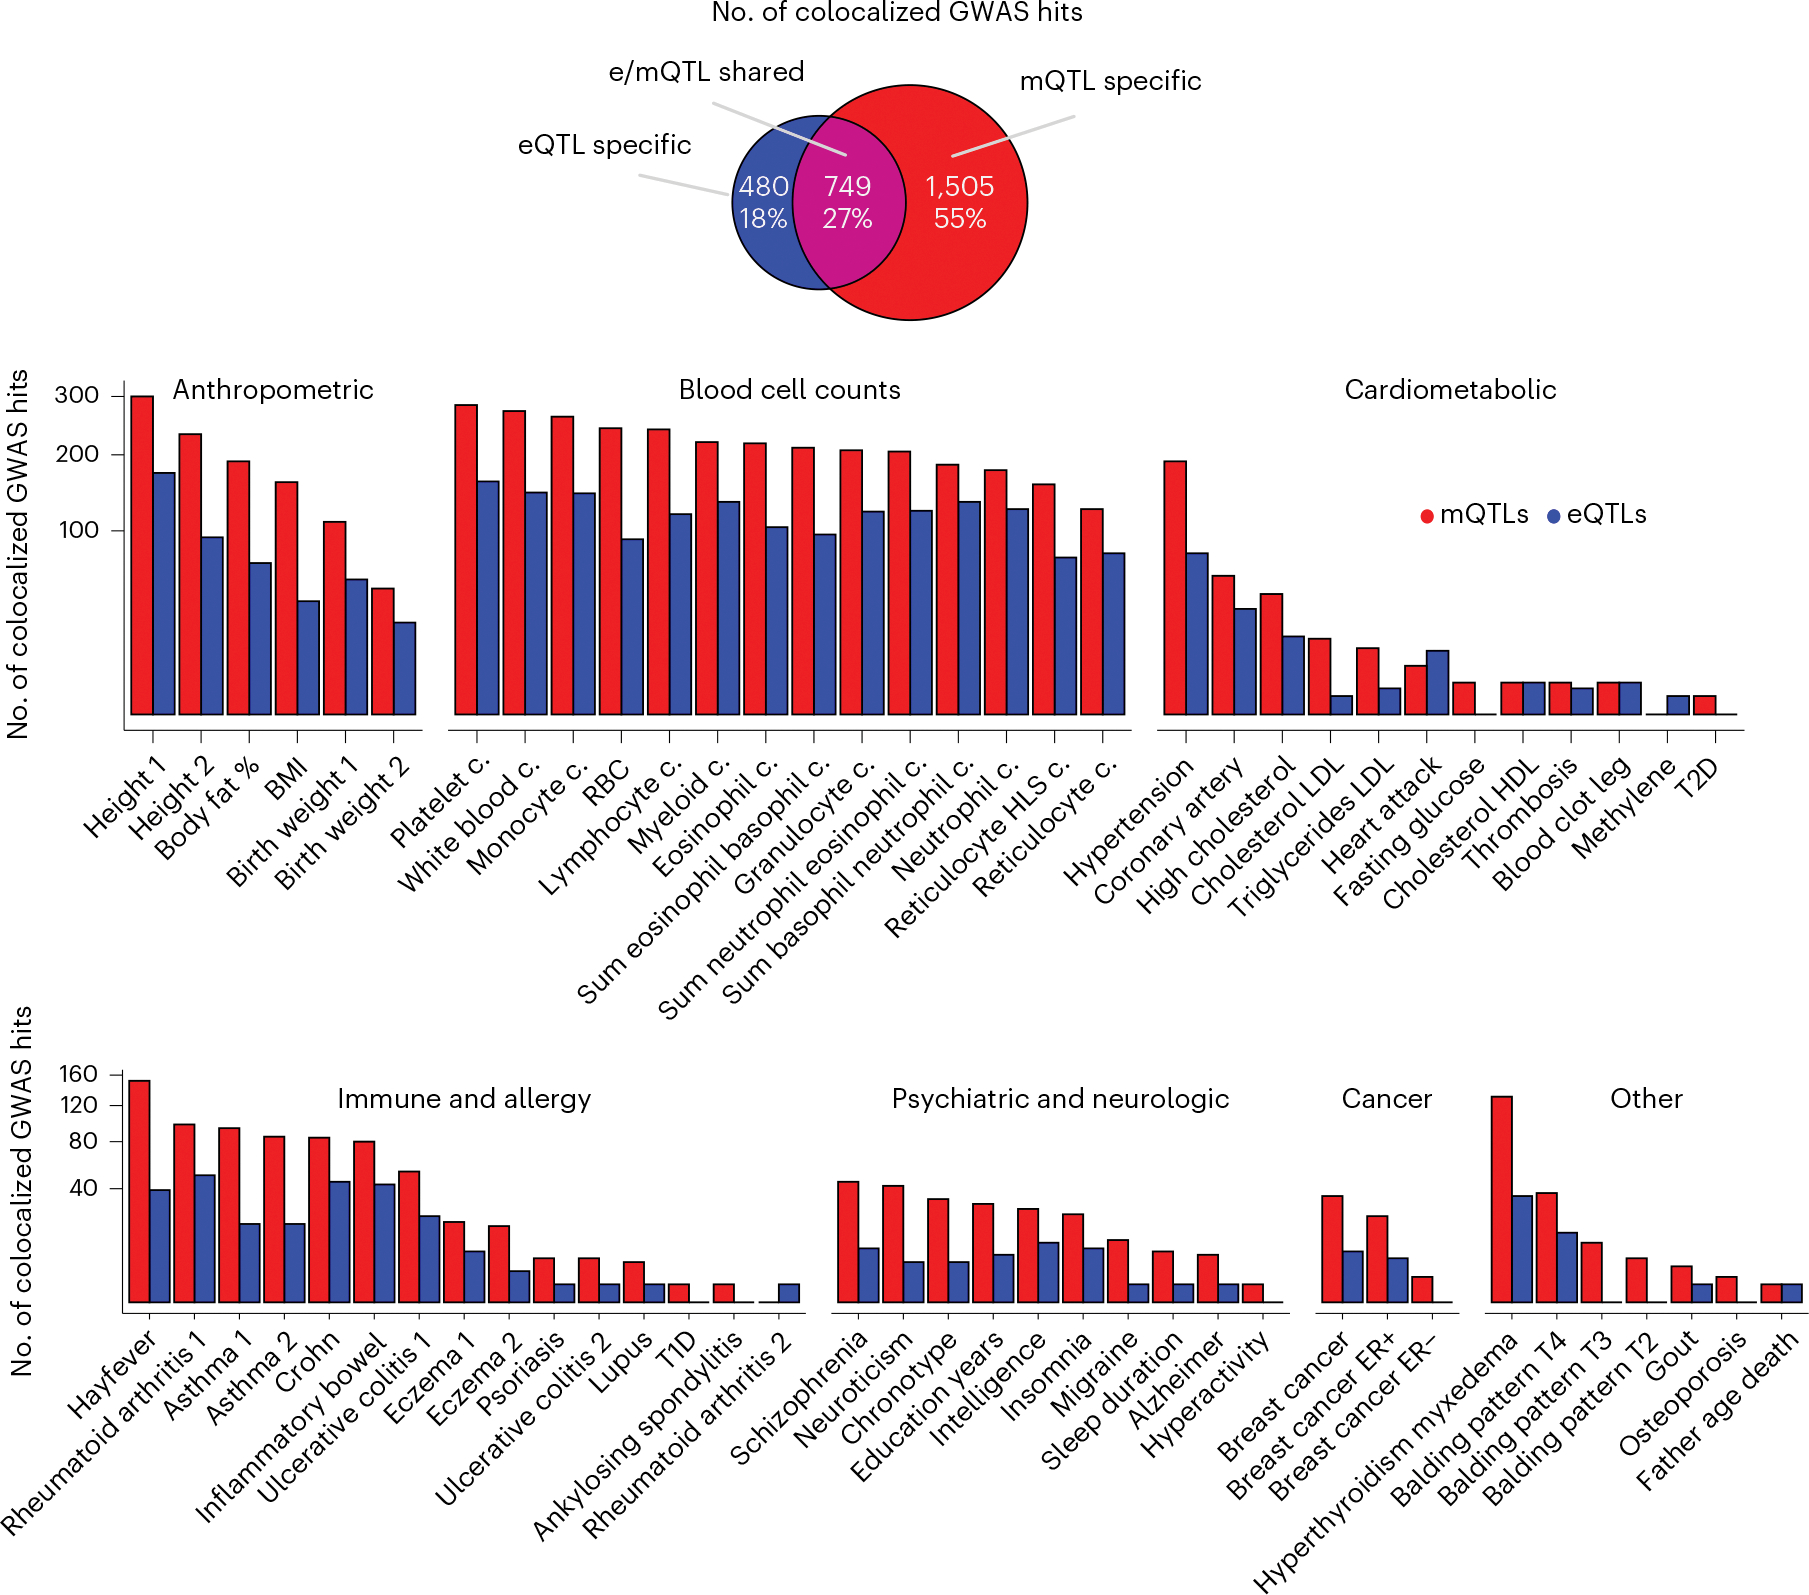
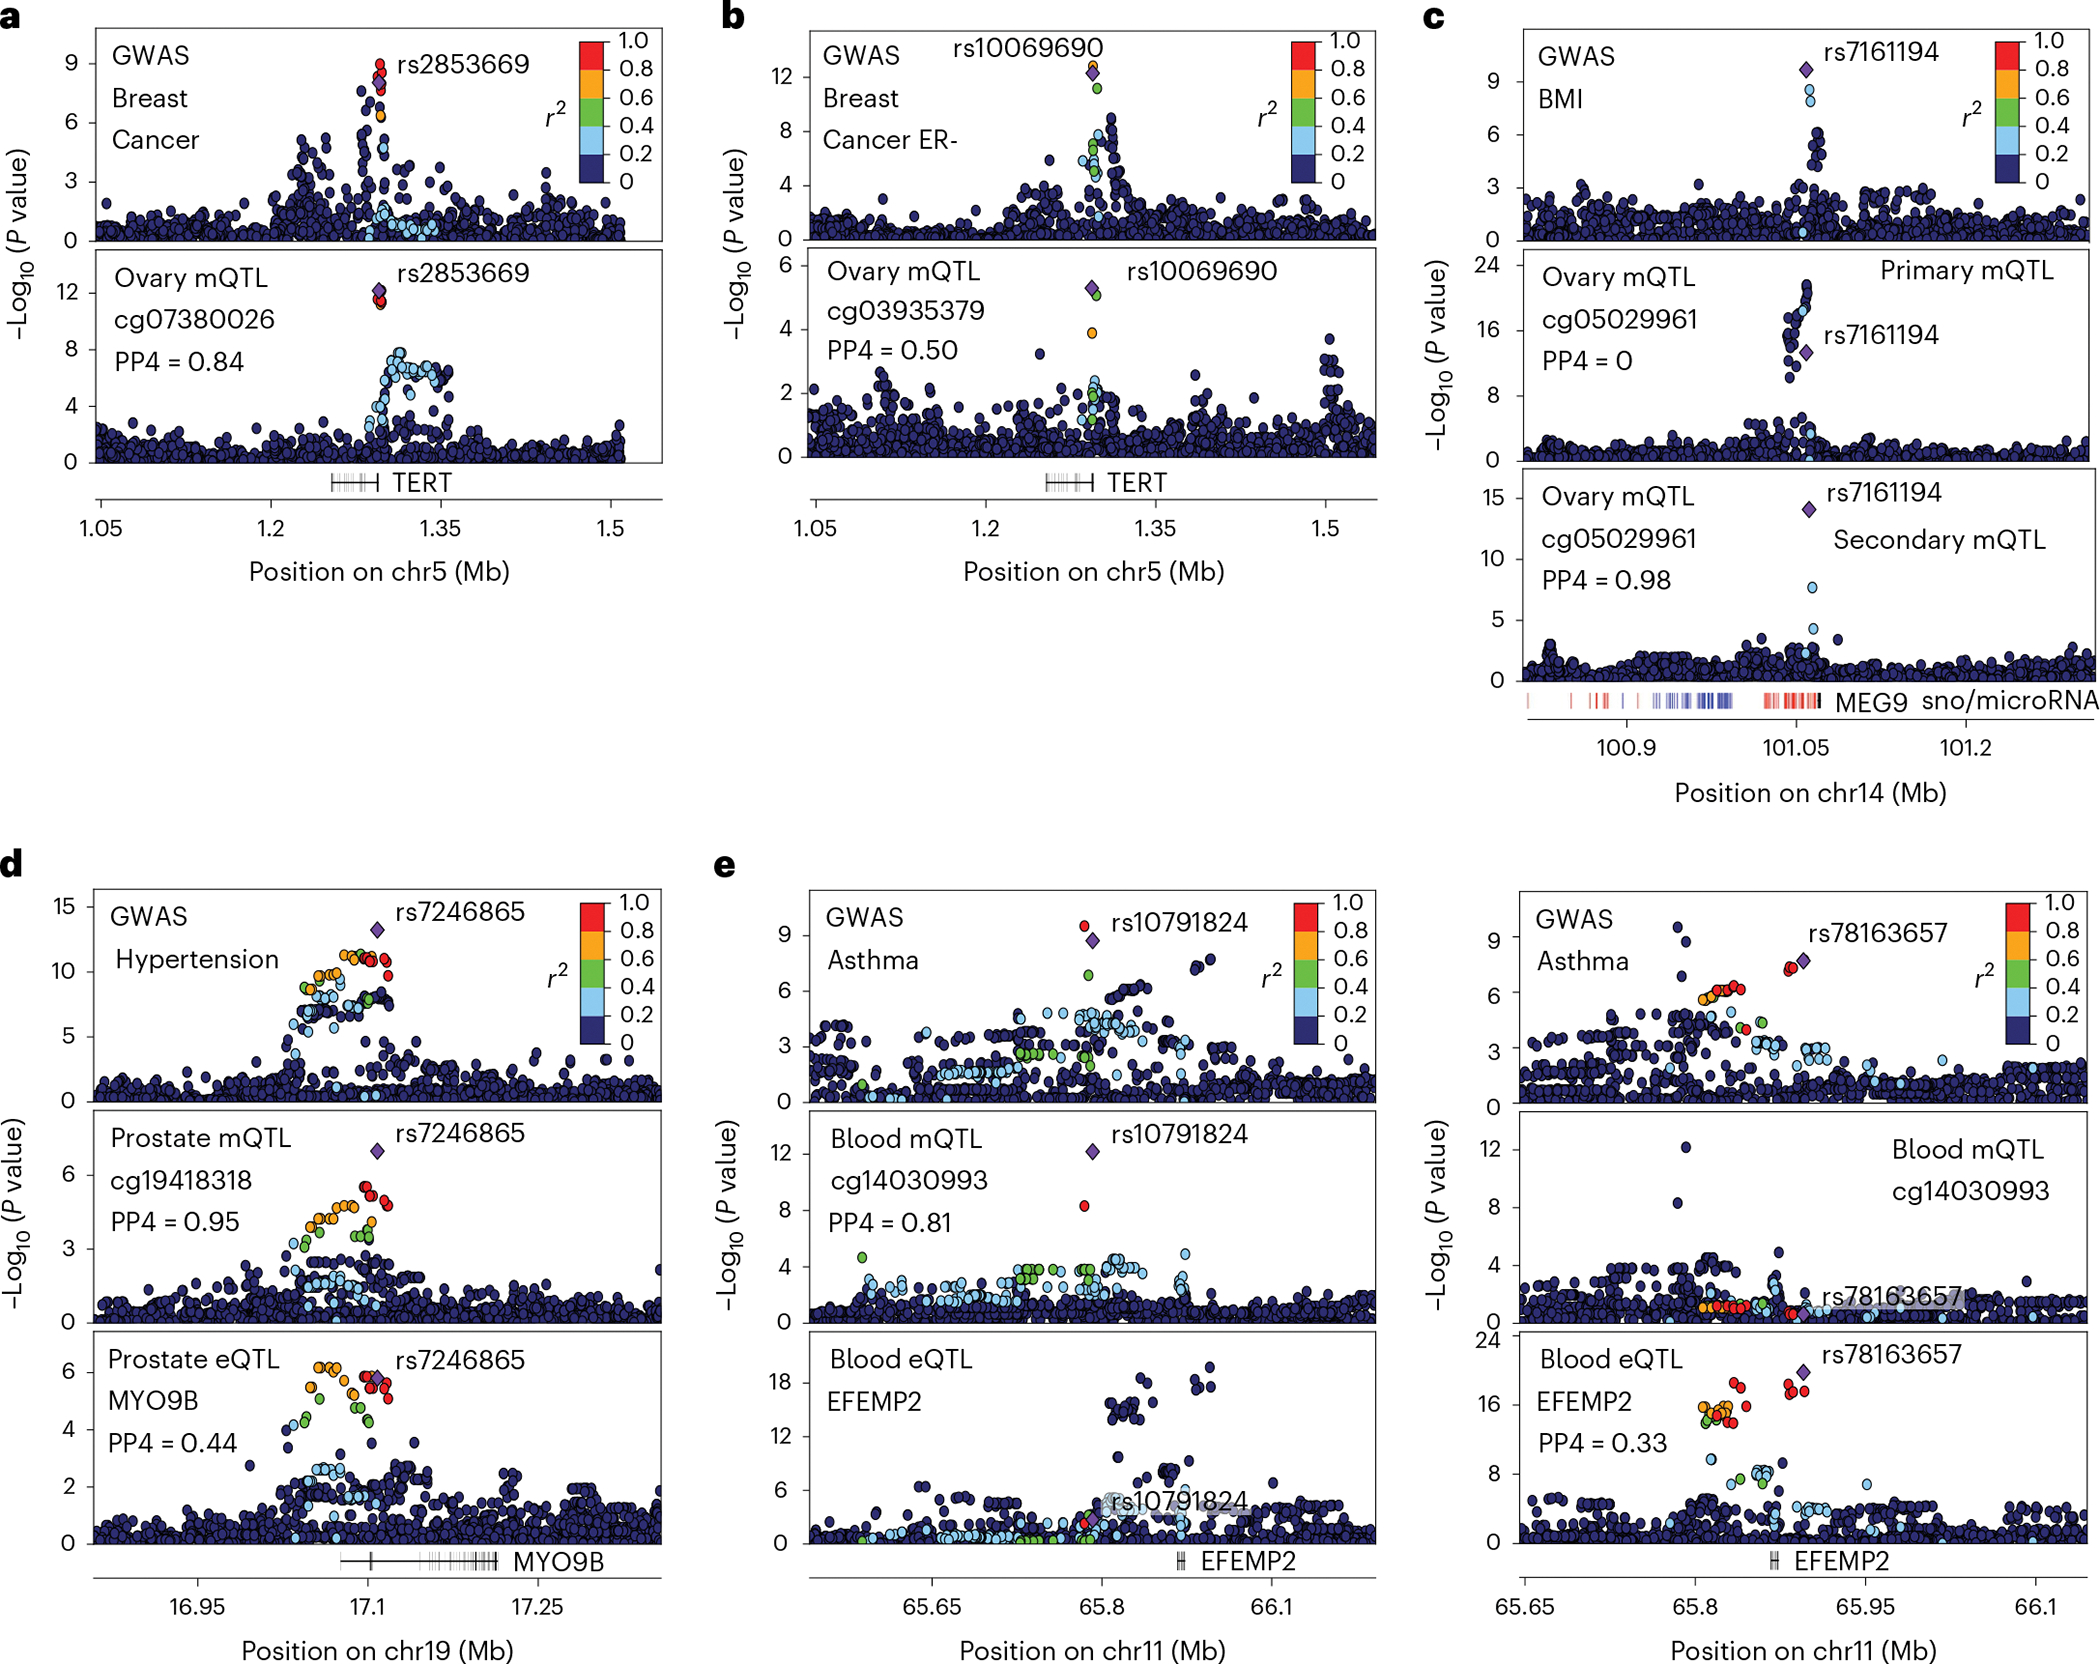
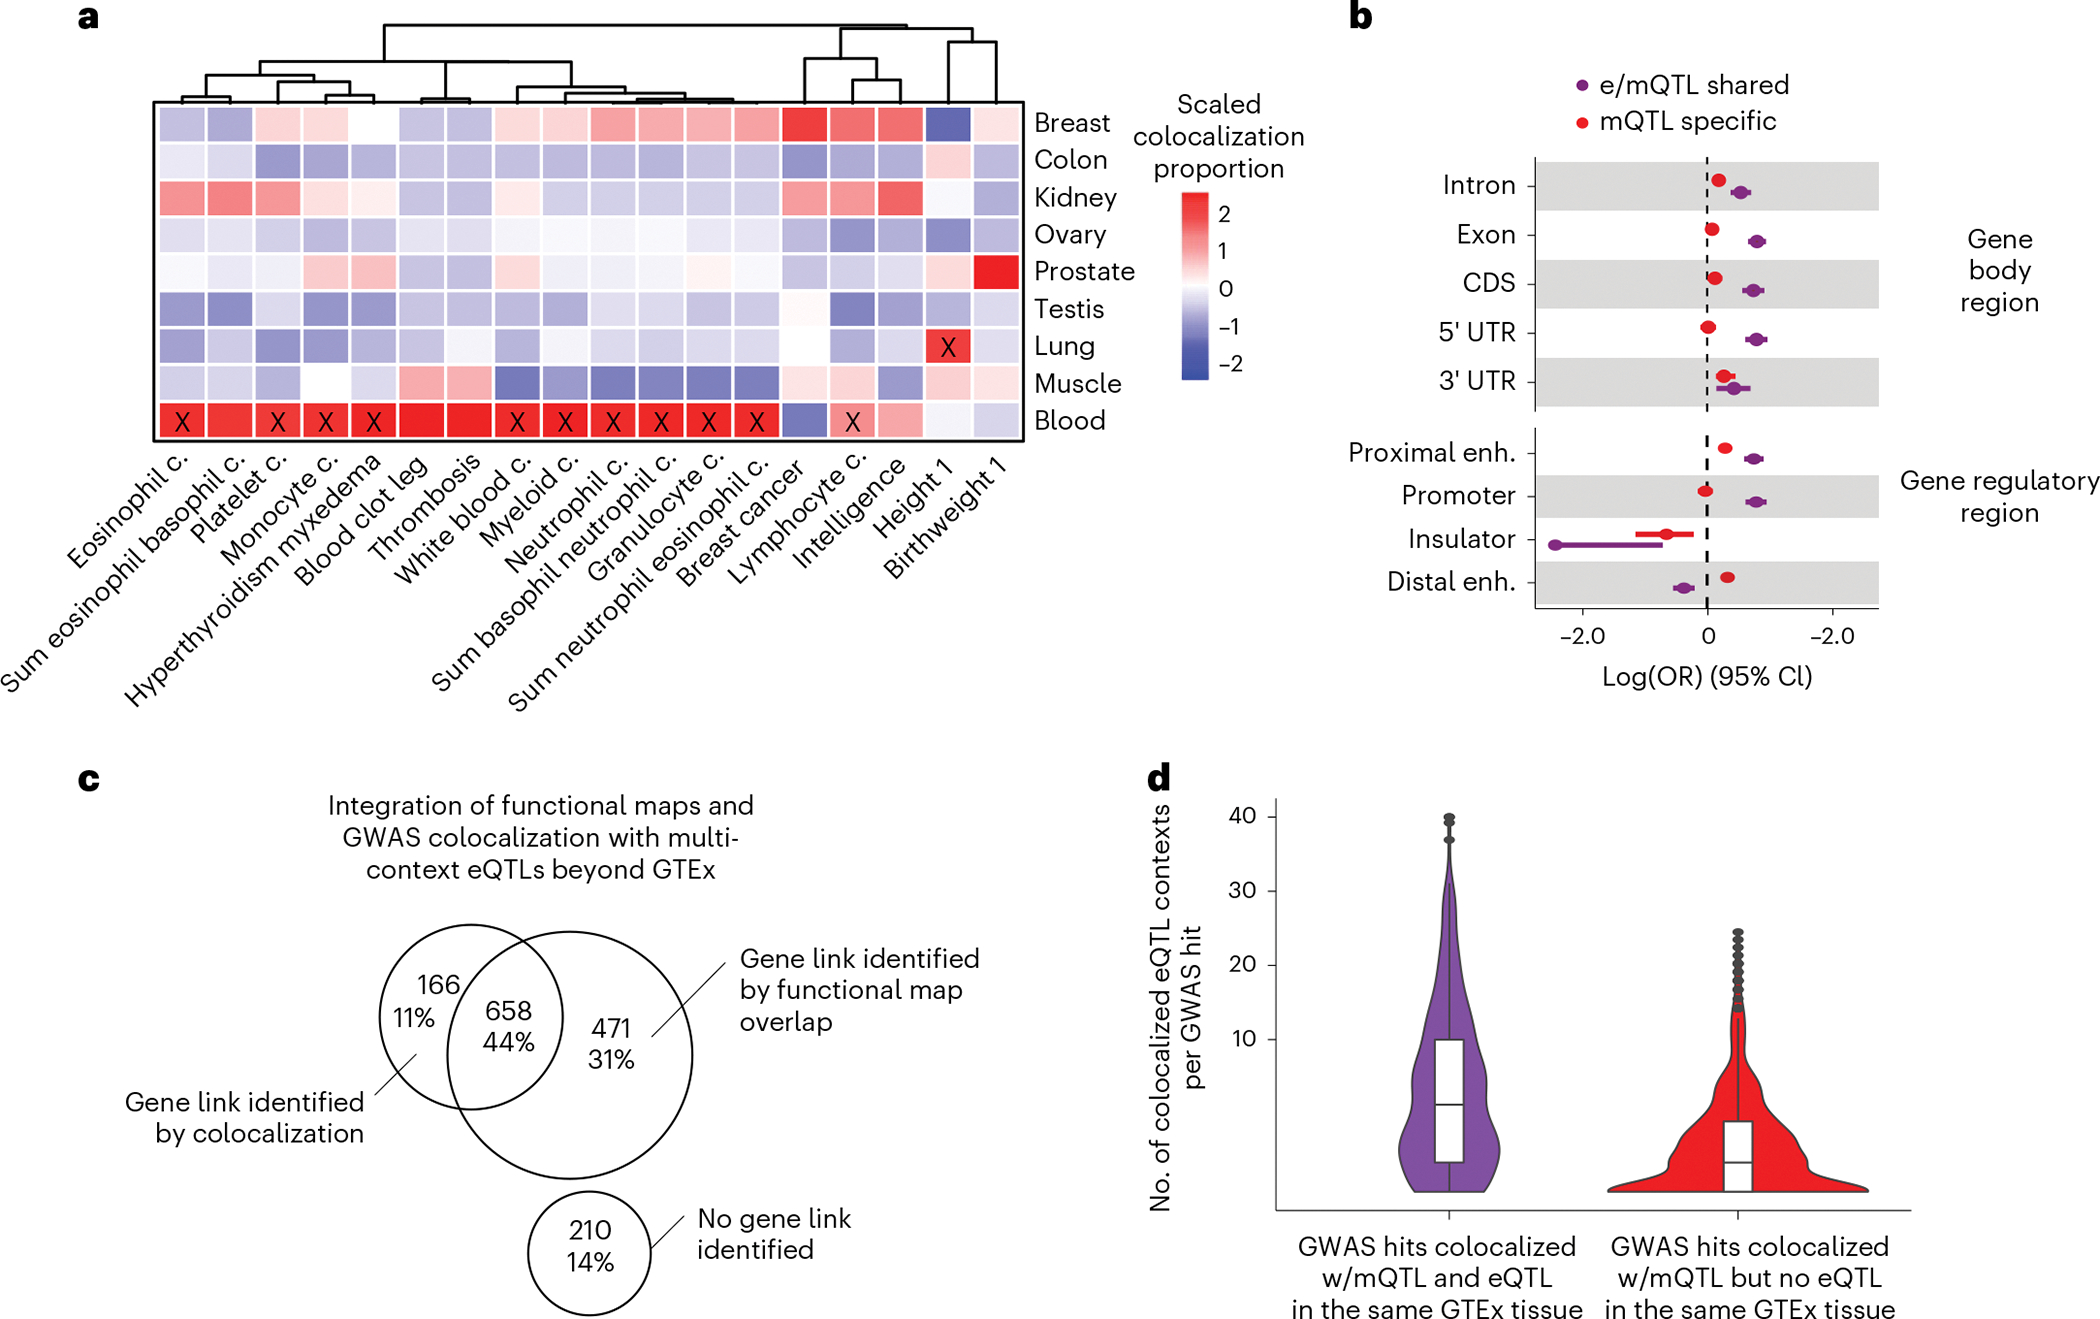
Studies of DNA methylation (DNAm) in solid human tissues are relatively scarce; tissue-specific characterization of DNAm is needed to understand its role in gene regulation and its relevance to complex traits. We generated array-based DNAm profiles for 987 human samples from the Genotype-Tissue Expression (GTEx) project, representing 9 tissue types and 424 subjects. We characterized methylome and transcriptome correlations (eQTMs), genetic regulation in cis (mQTLs and eQTLs) across tissues and e/mQTLs links to complex traits. We identified mQTLs for 286,152 CpG sites, many of which (>5%) show tissue specificity, and mQTL colocalizations with 2,254 distinct GWAS hits across 83 traits. For 91% of these loci, a candidate gene link was identified by integration of functional maps, including eQTMs, and/or eQTL colocalization, but only 33% of loci involved an eQTL and mQTL present in the same tissue type. With this DNAm-focused integrative analysis, we contribute to the understanding of molecular regulatory mechanisms in human tissues and their impact on complex traits.


Figures

Extended Data Fig. 1 |
Extended Data Fig. 1 |. Characterization of methylomes across tissues, eQTM discovery and tissue specificity patterns.
(a) Sample similarity based on DNAm profiles. Dimensionality reduction was performed with a t-Distributed Stochastic Neighbor Embedding approach (t-SNE). (b) Hierarchical tissue clustering based on complete methylomes (left panel) and transcriptomes (right panel) of nine tissues (x axis). The molecular phenotypes displayed (y axis) correspond to the top 20,000 most divergent CpG sites and genes across tissues. DNAm and gene expression values are column-wise scaled. (c) Number of eQTMs per tissue, defined at LFSR < 0.05 or FDR < 0.05, shown with per-tissue eQTM-mapping sample sizes in parentheses. FDR: False Discovery Rate. LFSR: Local False Sign Rate. (d) Tissue sharing profile of eQTMs. (e) Contribution (x axis, square-root transformed log(OR)) of selected factors to eQTM likelihood (presence) for different gene regulatory elements (y axis). Dist.: Distance. OR: Odds Ratio. Factor units: CpG–gene distance [Kb], eQTM Sign [‘1’ for negative correlation between methylation and expression, ‘0’ otherwise], CpG DNAm [M-value], gene expression [log2(TPM + 1)]. OR estimates were derived from across-tissue meta-analysis (nine tissues) of predictor coefficients of eQTM likelihood, fitted with a logistic regression model (Methods).
Extended Data Fig. 2 |
Extended Data Fig. 2 |. DNAm-derived PEER factors association with technical, clinical and epidemiological covariates.
Proportion of variance - mean adjusted R2 across top three PEERs (R2adj) - of the PEER factors explained in part by known donor and sample clinical and biological covariates. Each cell shows the proportion of variance explained by the covariate with respect to the three top PEERs in a specific tissue. Only covariates with R2adj ≥ 0.02 in any tissue are shown. Tissues and covariates are ordered based on hierarchical clustering with complete agglomeration with Euclidean distance. Gray cells indicate unavailable data. The cells at the bottom of the panel shows that the PEERs are capturing batch effects, as expected.
Extended Data Fig. 3 |
Extended Data Fig. 3 |. DNAm-derived PEER factors association with tissue cellular abundances.
Proportion of variance - mean adjusted R2 across top three PEERs (R2adj) - of the PEER factors explained in part by tissue cellular abundances. Each bar shows the proportion of variance explained by the cell abundance with respect to the three top PEERs in a specific tissue. (b) Fraction of cell abundance (y axis) estimated by DNAm cell-type deconvolution with EpiSCORE, stratified by cell type (x axis) in corresponding tissue. Breast cell abundances are stratified by sex to illustrate sex-differential cell abundances. Cell abundances were estimated for all available samples per tissue: NBreast,Males = 14, NBreast,Females = 38, NBlood,Pooled = 54, NColon,Pooled = 224. B: B cells, NK: Natural Killer cells, CD4T: CD4+ T-cells, CD8T: CD8+ T-cells, Mono: Monocytes, Neutro: Neutrophils, Eosino: Eosinophils, Basal: Basal Epithelial cells, EC: Endothelial cells, Fat: Adipocytes, Luminal: Luminal Epithelial cells, Lym: Lymphocytes, Macro: Macrophages, Epi: Epithelial cells, Mye: Myeloid cells, Stromal: Stromal cells.
Extended Data Fig. 4 |
Extended Data Fig. 4 |. Tissue specificity of QTLs.
(a) Tissue sharing profile of mQTLs and eQTLs. (b-c) Cross-tissue sharing of mCpGs and eGenes. Cross-tissue mean percent of mCpGs and eGenes per tissue-sharing category is shown in parentheses. Of note, testis is an outlier for eQTL tissue specificity, as 23.5% of eGenes were not detected in any other tissue. Avg.: average (mean). (c) Cross-tissue sharing of mQTL tissue-leveraged effect magnitudes (y axis) per gene regulatory region (x axis, 36 data points per box plot). P-values of paired two-sided Wilcoxon signed rank tests are shown for corresponding pairwise comparisons; p-value of Kruskal-Wallis rank sum test is shown for the three-way comparison. Enh.: Enhancer. (d, e) Validation of tissue-specific mQTLs in muscle, blood and brain mQTL external cohorts, see (b) for tissue color legend. In (d), for each cohort, the average of absolute mQTL effect sizes and corresponding standard error is displayed for each set of tissue-specific mQTLs identified in each GTEx tissue (x axis). In (e), Spearman correlation between external and GTEx mQTL effect sizes, and associated standard error, is shown. Fisher’s z transformation was applied to Spearman correlation coefficients; standard errors were calculated based on the transformed coefficients. In (d,e), the number of QTL associations (N) tested for each pairwise comparison is as follows: NFUSION,GTEx = 195|4142|336,4630,287,4643|1428|360|369, NGoDMC,GTEx = 22|1353|47|1478|70|1019|292|83|102 and NROSMAP,GTEx = 57|2428|156|2587|163|2673|791|214|109, where GTEx corresponds to Breast|Colon|Kidney|Lung|Muscle|Ovary|Prostate|Testis|Blood tissues, respectively.
Extended Data Fig. 5 |
Extended Data Fig. 5 |. Representativity of GTEx mCpGs in external cohorts.
Overlap of mCpGs identified in GTEx (FDR < 0.05) with mCpGs identified in external mQTL cohorts at different nominal p-value thresholds (P < 1e-03 and P < 1e-05). Results are represented for all mCpGs - detected in EPIC and/or 450 K Illumina array - and for 450 K Illumina array CpG sites exclusively. P-value thresholds correspond to external cohort nominal mQTL associations, derived from QTL mapping by multiple regression two-sided t-tests.
Extended Data Fig. 6 |
Extended Data Fig. 6 |. Enrichment of QTLs in chromatin states.
(a) QTL enrichment (x-axis) in tissue-matching open chromatin regions derived from ENCODE DNase-seq profiles per tissue (y-axis). Whole blood is excluded due to lack of a tissue-matching DNase-seq profile. Enrichment differences between tissues may be due in part to per-tissue DNase-seq data quality. (b) QTL enrichment (x-axis) in active chromatin states. OR: Odds Ratio. Enrichment values correspond to maximum-likelihood estimated log(ORs) for single-tissue in (a) and from across-tissue (nine tissues) meta-analysis in (b). In all panels, whiskers represent the 95% confidence interval of the enrichment value.
Extended Data Fig. 7 |
Extended Data Fig. 7 |. Characterization of mQTL pleiotropy.
(a) Scheme of possible scenarios of eQTL-mQTL colocalization regarding QTL variants’ pleiotropic effect on multiple mCpGs and eGenes. (b) Quantification of mQTL-eQTL pleiotropy per tier per tissue, in percent of mCpGs belonging to each tier. Tier details illustrated in (a). Avg.: average (mean). (c) Distribution of the number of eGenes per mCpG (left panel) and mCpGs per eGene (right panel) involved in mQTL-eQTL colocalization events, stratified by tissue. Avg.: average (mean).
Extended Data Fig. 8 |
Extended Data Fig. 8 |. Evaluation of mQTL-GWAS colocalization approach.
(a) Density plot of mQTL-GWAS colocalization scores based on coloc run with default (y axis) and fastenloc-derived priors (x axis) on UKB standing height GWAS; Spearman’s rho is shown. Each dot corresponds to a colocalization test for a particular GWAS hit, independent mQTL and tissue combination. (b) Density plot of mQTL-GWAS colocalization scores based on coloc (x axis) and fastenloc (y axis) approaches on all GWASs; Spearman’s rho is shown. Each dot corresponds to a colocalization test for a particular GWAS, GWAS hit, independent mQTL and tissue combination. Dots within the top-right quadrant correspond to significant (RCP > 0.3 and PP4 > 0.3) colocalizations. PP4: coloc-derived posterior probability where the two traits share a single causal variant. RCP: fastenloc-derived probability of a genomic region harboring a colocalized signal.
Extended Data Fig. 9 |
Extended Data Fig. 9 |. Signatures of QTL-GWAS colocalizations and trait-linked QTLs.
(a) Percent of QTL-colocalized GWAS hits (y axis) per GWAS trait (x axis) stratified by GWAS trait category and colocalization group (see Fig. 4). Only GWAS traits with > = 10 colocalized GWAS hits are displayed. (b) Mean DNAm - in M-values - of mCpGs (left panel) and gene expression - in log2(TPM + 1) - of eGenes (right panel) tested for colocalization, stratified by tissue and colocalization group (see Fig. 4). Mean DNAm and gene expression across tissues is indicated by a dashed line. Whiskers represent the 95% confidence interval of the mean, calculated based on 5,000 replications of bootstrapped samples (random sampling with replacement). The number of mCpGs/eGenes (N) tested per bootstrap is as follows: NMeanMethylation = (12472|51|124), (147806|306|1111), (17574|24|221), (157356|359|1234), (13623|45|162), (127008|147|1041), (65147|103|60), (13576|38|101), (20127|126|254) and NMeanGeneExpression = (10050|27|168), (10800|110|103), (1147|4|22), (13053|144|149), (12594|33|218), (5120|55|47), (6744|43|75), (17025|18|164), (11545|95|291) for QTL-GWAS tested, e/mQTL-shared and e/mQTL-specific eGenes/mCpGs in Breast|Col on|Kidney|Lung|Muscle|Ovary|Prostate|Testis|Blood tissues, respectively.
Extended Data Fig. 10 |
Extended Data Fig. 10 |. Breast cancer linked e/mQTLs in the TERT-CLPTM1L locus.
Colocalized molecular phenotypes for this locus, identified by breast cancer GWAS-QTL multivariate colocalization approach (Methods), are provided in the top summary table. The mQTLs colocalizing with these breast cancer GWAS signals (that is, mCpGs cg03935379 and cg07380026) are shown in Fig. 5a, b. Additional details are provided in Supplementary Table 8. Plots illustrate association p-values in the locus for breast cancer estrogen positive (ER+) GWAS (top panel), breast cancer estrogen negative (ER−) GWAS (middle panel) and TERT eQTL signal in induced pluripotent stem cells (iPSCs) (bottom panel). Genotype-phenotype association p-values correspond to rs10069690, lead signal for breast cancer ER- GWAS. Linkage disequilibrium between loci is quantified by squared Pearson coefficient of correlation (r2) in population from European origin. Breast GWAS p-values were obtained from Milne et al. 2017, and iPSC TERT eQTL p-values from Bonder et al 2021. Mb: mega base. P-values correspond to nominal GWAS or QTL associations, derived from multiple regression two-sided t-tests.
Fig. 1 |
Fig. 1 |. Scheme of data generation and analysis overview.
Multi-tissue DNAm Illumina EPIC-array-based profiles are integrated with GTEx project sample-matched gene expression to map DNAm-expression correlations (eQTMs). Sample-matched genotype data are integrated to map mQTLs and eQTLs. e/mQTL signal is colocalized with GWAS data and multi-context eQTLs, and integrated with eQTMs and functional maps, to link variants and genes to traits. This figure was created with adapted templates from http://biorender.com.
Fig. 2 |
Fig. 2 |. mQTL discovery and e/mQTL functional mechanism characterization.
a, Number of CpGs with a mQTL (mCpGs) per tissue defined at local false sign rate (LFSR) < 0.05 or FDR < 0.05, shown with per-tissue mQTL-mapping sample sizes (N) in parentheses. mCpGs, CpG sites with a significant mQTL association. ∪, union. b, Cross-tissue sharing of mQTL (left panel) and eQTL (right panel) tissue-leveraged mashr-derived effect magnitudes. Tissues ordered based on hierarchical clustering with complete agglomeration with Euclidean distance. c, QTL enrichment (x axis) in CpG islands (CGIs), gene body sites and candidate cis-regulatory elements. NC, non-coding; CDS, coding sequence; UTR, untranslated exon region.; OR, odds ratio. d, QTL enrichment (x axis) in transcription factor binding sites (TFBS). Top (largest OR value) 15 significant TFBS enrichments for mQTLs (left panel) and eQTLs (right panel) are shown. For panels c and d, enrichment values correspond to maximum-likelihood estimated log(ORs) derived from across-tissue (nine tissues) meta-analysis (Methods), and whiskers represent the 95% confidence interval of the enrichment value. e, Percentage and number (in parentheses) of mQTL loci (FDR < 0.05) relative to eQTL-colocalization (PP4 > 0.5) category.
Fig. 3 |
Fig. 3 |. Characterization of HOXD-locus e/mQTL pleiotropy in the ovary.
a, Ovary-tissue mQTL and eQTL landscape for HOXD locus. Variant rs6433571 (diamond) impacts multiple mCpGs (red lines) and eGenes (blue lines). Rectangular lines indicate distal eGenes not shown. Regulatory element annotations correspond to ENCODE candidate cis-regulatory elements (cCREs); promoters are shown in red, proximal and distal enhancers in orange and yellow, respectively, and CTCF-only regions (putative insulators) in blue. Dashed and solid gray lines correspond to gene transcription start sites and variant rs6433571 location, respectively. b, Cross-tissue expression levels, in transcripts per million (TPM), of eGenes in the HOXD locus identified in ovary tissue. c,d, QTL effect size of variant rs6433571 minor allele G on HOXD-locus eGenes (c) and mCpGs (d) per tissue. Gray cells in panel c correspond to genes below the expressed threshold in a particular tissue, hence not tested for eQTL signal. For panels b–d, complete-linkage hierarchical clustering based on Euclidean distance was performed for tissues and molecular phenotypes.
Fig. 4 |
Fig. 4 |. Colocalization of mQTLs and eQTLs with GWAS traits.
Venn Diagram represents the overlap between colocalized GWAS hits per QTL type. Bar plot represents the number of colocalized GWAS hits (y axis, square-root transformed) per GWAS trait (x axis), trait class and QTL type. BMI, body mass index; c., cell count; LDL, low-density lipoprotein; HDL, high-density lipoprotein; RBC, red blood cell; T1D, type 1 diabetes; T2D, type 2 diabetes; ER, estrogen receptor.
Fig. 5 |
Fig. 5 |. Examples of trait-linked e/mQTLs.
a,b, Genotype-phenotype association P values in the TERT locus for breast cancer GWASs (top panel) and mQTL signal in ovary (bottom panel). c, Genotype-phenotype association P values of the MEG9 locus. Panels illustrate GWAS signal for body mass index (top), cg05029961 primary (middle) and secondary (bottom) mQTL signal in ovary tissue. Secondary mQTL association was obtained adjusting for the top significant variant of primary mQTL signal. Small nucleolar RNA loci (snoRNAs) and microRNA loci are depicted in blue and red, respectively. d, Genotype-phenotype association P values of the MYO9B locus. Panels illustrate GWAS signal for hypertension (top), cg19418318 mQTL signal (middle) and MYO9B eQTL signal (bottom) in prostate. e, Genotype-phenotype association P values of the EFEMP2 locus. Top panels illustrate primary (left) and secondary (right) GWAS signals for asthma. Middle and bottom panels illustrate cg14030993 mQTL and EFEMP2 eQTL signal respectively. For all panels, top GWAS-colocalized e/mQTL is typed in bold, linkage disequilibrium between loci is quantified by squared Pearson coefficient of correlation (r2), and colocalization probability (PP4) of mQTL with GWAS signal is shown. In panels a, c and d, the diamond-shaped point represents the top significant mQTL variant; in panel b, it represents the top significant secondary QTL variant; in panel e, it represents either the top significant mQTL (left) or eQTL (right) variant. P values correspond to nominal GWAS or QTL associations, derived from multiple regression two-sided t-tests.
Fig. 6 |
Fig. 6 |. Characteristics of trait-linked mQTLs.
a, Proportion of colocalized mQTLs with GWAS hits per tissue (y axis) and GWAS trait (x axis) scaled by GWAS trait. GWAS traits are clustered by trait-wise scaled colocalization proportion values. Significant (Fisher’s two-sided exact test Bonferroni-corrected P < 0.01) tissue-trait enrichments are labeled with a black cross. b, Trait-linked mCpG enrichment (x axis) in gene body regions and candidate cis-regulatory elements, stratified by QTL-GWAS colocalization group (Fig. 4). Enrichment values correspond to maximum-likelihood estimates of the OR, derived from N = 270,783 trait-association tested mCpGs, and whiskers represent the 95% confidence interval of the enrichment value. enh., enhancer. c, Venn diagram represents overlap between GWAS hits with absence or presence of identified gene links by integrative approach. Analyzed GWAS hits were derived from the previous pairwise colocalization approach, considering mQTL-specific loci, that is mQTL-GWAS colocalizations in absence of eQTL-GWAS colocalization in the same GTEx tissue source (Fig. 4). d, Number of eQTL contexts/catalogs per eQTL-mQTL-GWAS-colocalized cluster (y axis, square-root transformed) derived from the multivariate colocalization approach considering 61 eQTL contexts/catalogs beyond GTEx (Methods). Observations are stratified by QTL-GWAS colocalization group derived from the previous pairwise colocalization approach, that is mQTL-GWAS colocalizations in presence (e/mQTL shared) or absence (mQTL specific) of eQTL-GWAS colocalization in the same GTEx tissue source (Fig. 4).

Comment in

References

    1. Nicolae DL et al. Trait-associated SNPs are more likely to be eQTLs: annotation to enhance discovery from GWAS. PLoS Genet. 6, e1000888 (2010). - PMC - PubMed
    1. Cano-Gamez E & Trynka G From GWAS to function: Using functional genomics to identify the mechanisms underlying complex diseases. Front. Genet. 11, 424 (2020). - PMC - PubMed
    1. GTEx Consortium et al. Genetic effects on gene expression across human tissues. Nature 550, 204–213 (2017). - PMC - PubMed
    1. GTEx Consortium. The GTEx Consortium atlas of genetic regulatory effects across human tissues. Science 369, 1318–1330 (2020). - PMC - PubMed
    1. Barbeira AN et al. Exploiting the GTEx resources to decipher the mechanisms at GWAS loci. Genome Biol. 22, 49 (2021). - PMC - PubMed

Publication types