. 2023 Jan;26(1):64-78.
doi: 10.1038/s41593-022-01214-2. Epub 2022 Dec 12.

Intracellular chloride regulation mediates local sleep pressure in the cortex

Affiliations

Intracellular chloride regulation mediates local sleep pressure in the cortex

Hannah Alfonsa et al. Nat Neurosci. 2023 Jan.

Abstract

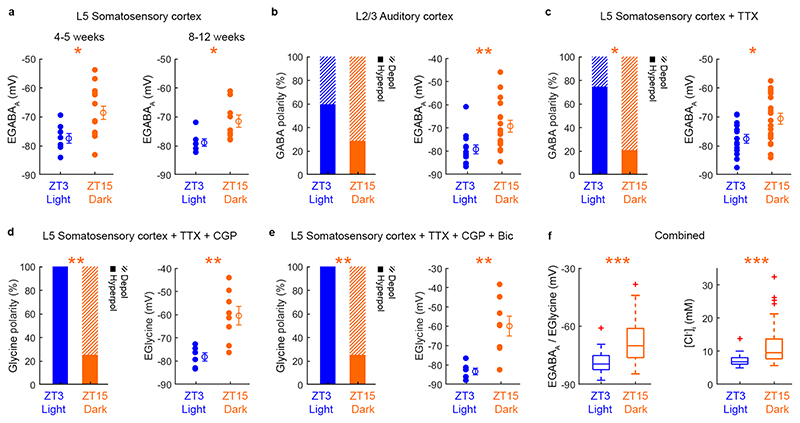
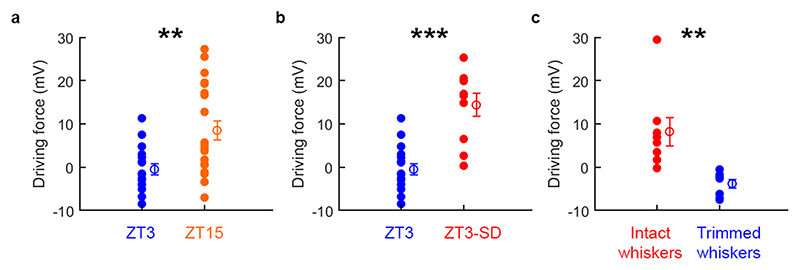
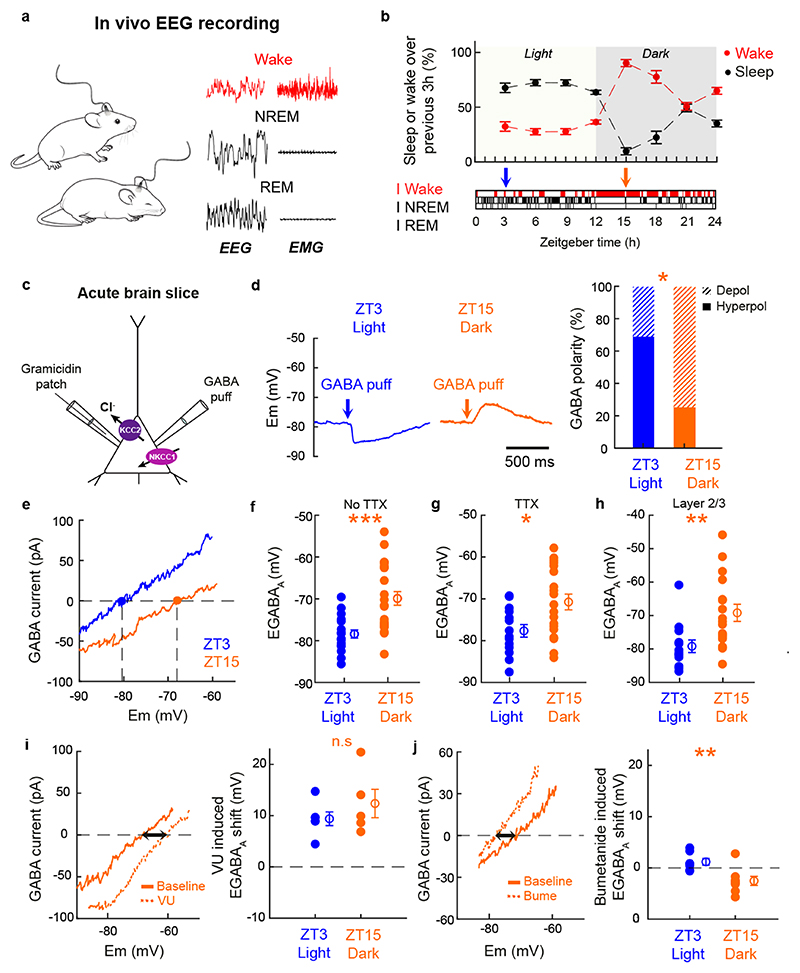
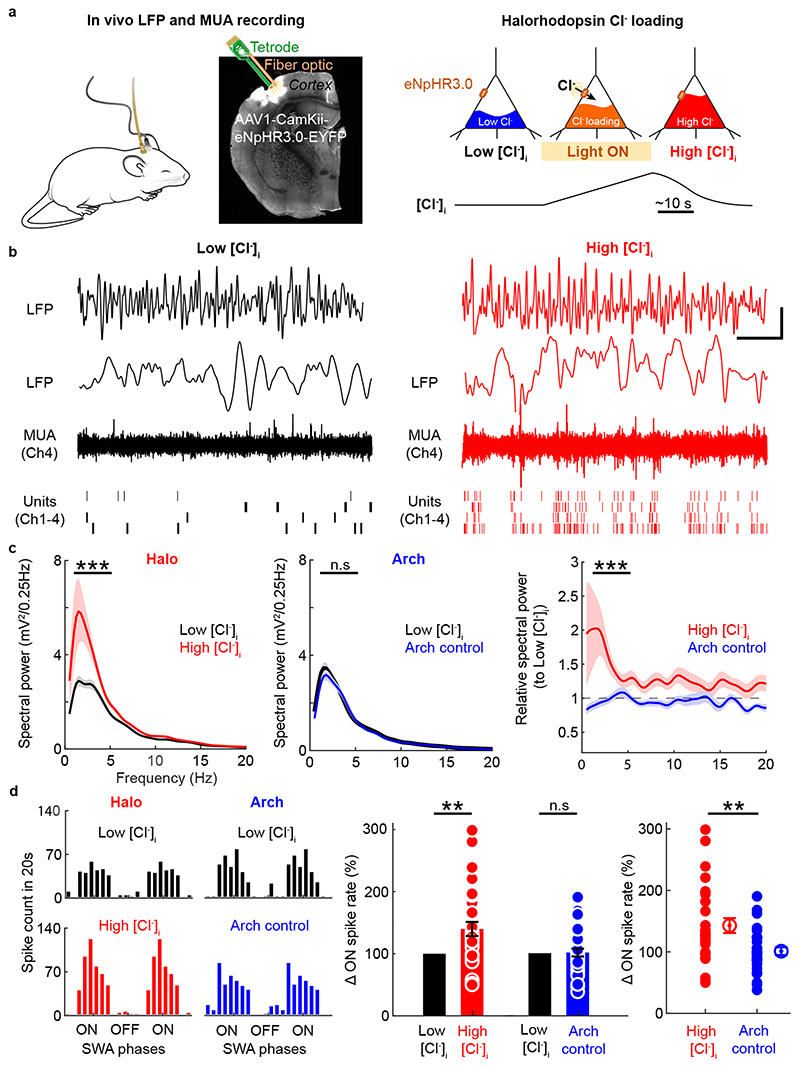
Extended wakefulness is associated with reduced performance and the build-up of sleep pressure. In the cortex, this manifests as changes in network activity. These changes show local variation depending on the waking experience, and their underlying mechanisms represent targets for overcoming the effects of tiredness. Here, we reveal a central role for intracellular chloride regulation, which sets the strength of postsynaptic inhibition via GABAA receptors in cortical pyramidal neurons. Wakefulness results in depolarizing shifts in the equilibrium potential for GABAA receptors, reflecting local activity-dependent processes during waking and involving changes in chloride cotransporter activity. These changes underlie electrophysiological and behavioral markers of local sleep pressure within the cortex, including the levels of slow-wave activity during non-rapid eye movement sleep and low-frequency oscillatory activity and reduced performance levels in the sleep-deprived awake state. These findings identify chloride regulation as a crucial link between sleep-wake history, cortical activity and behavior.


Conflict of interest statement

Competing interests statement

The authors declare no competing interests.

Figures

Extended Data Fig. 1
Cortical pyramidal neurons exhibit diurnal variations in EGABAA. Activating Cl--permeable receptors in current clamp, and estimating the equilibrium potential of GABAARs (EGABAA) or glycine receptors (EGlycine) under different recording conditions, supports the conclusion that cortical pyramidal neurons exhibit diurnal variations in intracellular chloride regulation. a. EGABAA shows diurnal variation in both juvenile and adult somatosensory cortex. EGABAA was more depolarized at ZT15 than at ZT3 in L5 pyramidal neurons from mice aged 4-5 weeks (left; *p=0.015, unpaired t-test; t=2.66; df=21; d=1.16; blue: 8 neurons, 8 slices, 2 animals; orange: 15 neurons, 15 slices, 3 animals) and in mice aged 8-12 weeks (right; *p=0.016, unpaired t-test; t=2.74; df=14; d=1.38; blue: 7 neurons, 7 slices, 5 animals; orange: 9 neurons, 9 slices, 5 animals; Multi group comparison: p=0.0008 for ZT time effect, p=0.27 for age effect, p=0.75 for interaction between ZT time and age effect; 2-way Anova). b. The proportion of L2/3 pyramidal neurons in brain slices from auditory cortex that exhibited a depolarizing GABAAR response at ZT3 and ZT15 (left; p=0.3, Fisher’s exact test; blue: 10 neurons, 10 slices, 7 animals; orange: 7 neurons, 7 slices, 4 animals). EGABAA in L2/3 pyramidal neurons of auditory cortex was more depolarized at ZT15 than at ZT3 (right; **p=0.006, unpaired t-test; t=2.97; df=28; d=1.09; blue: 13 neurons, 13 slices, 7 animals; orange: 17 neurons, 17 slices, 7 animals). EGABAA data from Fig. 1. c. The same pattern was observed when action potential activity was blocked by applying TTX throughout the recordings. A higher proportion of L5 pyramidal neurons exhibited a depolarizing GABAAR response at ZT15, compared to ZT3 (left; *p=0.026, Fisher’s exact test; blue: 8 neurons, 8 slices, 4 animals; orange: 14 neurons, 14 slices, 5 animals). EGABAA was more depolarized at ZT15 than at ZT3 when action potential activity was blocked throughout the recordings (*p=0.0109, unpaired t-test; t=2.708; df=31; d=0.95; blue: 14 neurons, 14 slices, 7 animals; orange: 19 neurons, 19 slices, 7 animals). EGABAA data from Fig. 1. d. Activating Cl--permeable glycine receptors, in the presence of TTX and the GABAB receptor blocker CGP55845 (CGP), revealed the same pattern. A higher proportion of L5 pyramidal neurons exhibited a depolarizing glycine response at ZT15 than at ZT3 (left; **p=0.0097, Fisher’s exact test; blue: 6 neurons, 6 slices, 3 animals). EGlycine was more depolarized at ZT15 than at ZT3 (right; **p=0.0033, unpaired t-test; t=3.663; df=12; d=1.98; blue: 6 neurons, 6 slices, 3 animals; orange: 8 neurons, 8 slices, 4 animals). e. The same pattern was observed when GABAA receptors, GABAB receptors and action potential activity were all blocked. A higher proportion of L5 pyramidal neurons exhibited a depolarizing glycine response at ZT15 than at ZT3 (left; **p=0.0097, Fisher’s exact test; blue: 6 neurons, 6 slices, 3 animals; orange: 8 neurons, 8 slices, 4 animals). EGlycine was more depolarized at ZT15 than at ZT3 (right; **p=0.0026, unpaired t-test; t=4.313; df=8; d=2.04; blue: 6 neurons, 3 animals; orange: 8 neurons, 4 animals). Data represent mean ± sem. f. Across all recordings conditions (a total of n=57 neurons from 57 slices, 28 animals at ZT3 and 75 neurons from 75 slices, 30 animals at ZT15), the estimated difference in EGABAA/EGlycine between ZT3 and ZT15 was 11.1 mV (left; ***p<0.0001, unpaired t-test with Welch correction; t=7.98; df=115; d=1.29). Using the Nernst equation and treating EGABAA/EGlycine as an estimate of the equilibrium potential for Cl-, this would indicate a shift in [Cl-]i of approximately 4.4 mM, (right; ***p<0.0001, Mann-Whitney Test; d=1.08). Center line: median, box limits: 25th and 75th percentile, whiskers: non-outlier min and max, outlier: 1.5 x interquartile range away from the bottom or top of the box. Data represent mean ± sem. All tests are two sided.
Extended Data Fig. 2
Extended Data Fig. 2. Diurnal and sleep-wake dependent variations in EGABAA alter the GABAAR driving force.
a. The GABAAR driving force was calculated as the difference between EGABAA and the neuron’s resting membrane potential. The GABAAR driving force was significantly more depolarizing at ZT15 than at ZT3 in L5 pyramidal neurons (left; **p=0.003, Mann-Whitney test; d=1.08; blue: 17 neurons, 17 slices, 8 animals; orange: 21 neurons, 21 slices, 8 animals). b. The GABAAR driving force was more depolarizing at ZT3-SD when sleep pressure was high, than at ZT3 when sleep pressure was low (***p<0.0001, unpaired t-test; t=5.57; df=25; d=2.22; red: 10 neurons, 10 slices, 4 animals; blue: same data as ‘a’). c. Mice had their whiskers trimmed unilaterally at ZT3, when EGABAA is normally hyperpolarized, and were then subjected to 3 hours of SD (as in Figure 2i). The GABAAR driving force was more depolarizing in the hemisphere contralateral to the intact whisker input, compared to the hemisphere contralateral to the trimmed whisker input (**p=0.0078, Wilcoxon matched-pairs signed-ranks test; d=1.38; 8 neuronal pairs, 8 slices, 3 animals). Data represent mean ± sem. All tests are two sided.
Extended Data Fig. 3
Extended Data Fig. 3. Levels of NREM SWA reflect recent sleep-wake history and indicate sleep pressure.
a. At ZT15, when mice have mainly been awake during the preceding 3 hours, spectral power shows higher levels of NREM SWA. At ZT3, when mice have mainly been asleep during the preceding 3 hours, lower levels of NREM SWA are observed (*p=0.0137, Wilcoxon matched-pairs signed-ranks test; d=1.49; blue: 10 days, 6 animals; orange: 10 days, 6 animals). SWA was monitored by frontal EEG and spectral power recorded over a two-hour period was normalized to the mean 12 hours light period. b. In a similar manner, mice at ZT0 that have mainly been awake during the preceding 3 hours show higher levels of NREM SWA compared to mice at ZT3, which have mainly been asleep during the preceding 3 hours (*p=0.0241, unpaired t-test with Welch’s correction; t=2.996; df=6; d=1.73; black: 6 days, 6 animals; grey: 6 days, 6 animals). SWA was monitored by LFP via a tungsten wire targeted to L5 of primary somatosensory cortex (S1) and spectral power recorded over a two-hour period was normalized to the mean 12 hours light period. Data represent mean ± sem. All tests are two sided.
Extended Data Fig. 4
Extended Data Fig. 4. Sleep-wake history affects phospho-NKCC1 levels in layer 5 pyramidal neurons.
a. Confocal microscope images of immunofluorescence detected using a rabbit polyclonal antibody raised against a linear diphosphopeptide corresponding to Thr212 and Thr217 of NKCC1 (‘pNKCC1’; right) in L5 neurons that underwent in vivo shRNA knockdown of NKCC1 (‘shRNA-NKCC1’; bottom) or received control shRNA (‘shRNA-control’; top). Co-expression of TdTomato (‘TdTom’; left) was used to identify neurons transfected m b. Compared to surrounding non-transfectedμwith shRNA. Scale bar: 10 cells, the pNKCC1 signal was significantly reduced in shRNA-NKCC1 L5 neurons (light blue: p<0.0001, Wilcoxon signed rank test; d=1.27; 60 neurons, 4 slices, 4 animals), but not in shRNA-control neurons (grey: p=0.21, one sample t-test; t=1.27; df=59; d=0.16; 60 neurons, 3 slices, 3 animals), and the two groups were significantly different (p<0.0001, Mann-Whitney test; d=1.27). This supports the conclusion that the pNKCC1 antibody signal reflects NKCC1 levels. Central line: mean; error bar: sem. c. Immunofluorescence signals for a neuron-specific marker (‘NeuN; left) and NKCC1 (right) in layer 5 somatosensory cortex from mice 3 hours after light onset under control conditions (top; ‘ZT3’) or after a 3-hour sleep deprivation protocol (bottom; ‘ZT3-SD’). Scale bar: m. d. Cumulative frequency plots of fluorescence (in arbitraryμ10 units) show higher pNKCC1 signal in the ZT3-SD condition compared to ZT3 (right; ***p<0.0001, Kolmogorov-Smirnov test; blue: 480 neurons, 6 slices, 3 animals; red: 480 neurons, 6 slices, 3 animals). This was not the case for the NeuN signal in the same population of neurons (left; p=0.11, Kolmogorov-Smirnov test). All tests are two sided.
Extended Data Fig. 5
Extended Data Fig. 5. Spectral power during different vigilance states following bumetanide or VU infusion.
a-b. [Cl-]i was manipulated at different time points by locally infusing blockers of NKCC1 (bumetanide) or KCC2 (VU) into S1. Spectral power from REM (‘a’) and wake (‘b’) LFP following infusion of vehicle or bumetanide during the early light period (left), vehicle or bumetanide during the late light period (middle), and vehicle or VU during the late light period (right). No differences were observed in theta frequency (5-10 Hz) during REM sleep following early bumetanide infusion (left; p=0.615, paired t-test; t=0.54; df=5; d=0.22; black and blue: 6 trials, 5 animals), late bumetanide infusion (middle; p=0.234, paired t-test; t=11.35; df=5; d=0.55; black and blue: 6 trials, 5 animals), or late VU infusion (right; p=0.356, paired t-test; t=1.02; df=5; d=0.41; black and red: 6 trials, 4 animals). Data represent mean ± sem. All tests are two sided.
Extended Data Fig. 6
Local NREM SWA and vigilance state distribution following bumetanide or VU infusion. [Cl-]i was manipulated at different time points by locally infusing blockers of NKCC1 (bumetanide) or KCC2 (VU) into S1. a. Population data showing NREM SWA derived from the S1 LFP (i.e. local) following infusion in mice that received vehicle or bumetanide during the early light period (left; black and blue: 6 trials, 5 animals), vehicle or bumetanide during the late light period (middle; black and blue: 6 trials, 5 animals), and vehicle or VU during the late light period (right; black and red: 6 trials, 4 animals). b-d. Population data on vigilance states (i.e. global state) showing the proportion of time spent in NREM sleep (‘b’), REM sleep (‘c’), and wake (‘d’) following local infusion of vehicle or bumetanide during the early light period (b, black and blue: 5 trials, 5 animals), vehicle or bumetanide during the late light period (c, black and blue: 5 trials, 5 animals), and vehicle or VU during the late light period (d, black and red: 5 trials, 4 animals). Data are plotted in 1-hour intervals. Data represent mean ± sem.
Extended Data Fig. 7
Extended Data Fig. 7. The effects of optical Cl- loading on NREM SWA and neuronal recruitment during ON and OFF periods.
a. Multi-unit activity from an animal expressing halorhodopsin in pyramidal neurons of S1, during which a 10 s period of light was delivered during NREM sleep (left). Opsin activation was confirmed by decreased spike rate during light activation (right; ***p<0.0001, one sample t-test; t=7.88; df=36; d=1.26; 40 trials, 12 days, 5 animals). b. Multi-unit activity from an animal expressing archaerhodopsin (‘Arch’; ***p<0.0001, Wilcoxon signed rank test; d=1.42; 32 trials, 8 days, 5 animals). c. Normalized SWA before (low [Cl-]i) and after (high [Cl-]i) halorhodopsin activation (5 s time bins) shows recovery kinetics following Cl- loading (39 trials, 14 days, 5 animals). d. Normalized spike rate before and after halorhodopsin activation (5 s time bins) shows recovery kinetics following Cl- loading (26 trials, 11 days, 5 animals). e. Normalized SWA before (low [Cl-]i) and after (‘Arch control’) archaerhodopsin activation (34 trials, 10 days, 5 animals). f. Normalized spike rate before and after archaerhodopsin activation (26 trials, 8 days, 5 animals). g. Representative LFP trace (0.5-12 Hz band pass filtered) during NREM sleep, recorded before (low [Cl-]i; top) and after (high [Cl-]i; bottom) halorhodopsin activation. Spikes are marked with dots. h. Spikes plotted on the Hilbert-transform of the filtered LFP signal. The OFF period was defined as the upward phase (30-150° angle) of high-amplitude SWA waveforms (>30% of baseline). i. Spike rate during the OFF phase of SWA was reduced after halorhodopsin activation (*p=0.0178, one sample t-test; t=2.538; df=25; d=0.5; 26 trials, 13 days, 5 animals). j. No change in spike rate after the Arch control (p=0.6238, one sample t-test; t=0.496; df=29; d=0.09; 30 trials, 8 days, 5 animals). k. Normalized spike rate (ON/OFF) during SWA was higher after halorhodopsin activation (***p<0.0001, Wilcoxon matched-pairs signed rank test; d=0.6; 25 trials, 11 days, 5 animals). l. No change in normalized spike rate (ON/OFF) during SWA recorded after the Arch control (p=0.948, Wilcoxon matched-pairs signed-ranks test; d=0.01; 29 trials, 8 days, 5 animals). Data represent mean ± sem. All tests are two sided.
Extended Data Fig. 8
[Cl-]i regulation underlies local low-frequency cortical oscillations in the sleep-deprived awake state. Data from Fig. 6 is replotted by normalizing the LFP and EEG spectral power in the 3rd hour of the sleep-deprived awake state, to the preceding 12h baseline. Continuous awake LFP and EEG recordings were used to monitor local and global spectral power, respectively. Mice experienced a 3-hour SD protocol at the beginning of the light period (ZT0 to ZT3), during which [Cl-]i was manipulated by locally infusing blockers of NKCC1 or KCC2 into S1. a. The awake LFP normalized to 12h baseline (left) revealed an increase in low-frequency cortical oscillations (2-6Hz; black: 15 animals). The level of low-frequency oscillations was reduced by local infusion of bumetanide (blue versus black, *p=0.0116, paired t-test; t=3.582; df=6; d=1.35; blue: 7 animals, black: 7 animals) and increased by VU (red versus black, **p=0.0078, Wilcoxon matched-pairs signed-ranks test; d=0.89; red: 8 animals, black: 8 animals,). These manipulations did not affect the frontal EEG (right; blue versus black, p=0.5122, paired t-test; t=0.6965; df=6; d=0.26; blue: 7 animals, black: 7 animals; red versus black, p=0.4467, paired t-test; t=0.8255; df=5; d=0.34; red: 6 animals, black: 6 animals). b. To test the relationship of the low-frequency oscillations to activity-dependent processes during SD, whiskers were trimmed unilaterally just before the animal experienced the 3-hour SD protocol. Either vehicle control (Veh) or VU was infused unilaterally during SD. The awake LFP normalized to 12h baseline (left) revealed that whisker trimming prevented the increase in local low-frequency cortical oscillations (blue versus black, ***p=0.0007, paired t-test; t=6.452; df=6; d=2.44; blue: 7 animals, black: 7 animals). This effect could be rescued by VU infusion into S1 (red versus blue, *p=0.0122, unpaired t-test with Welch correction; t=3.541; df=6; d=1.4; red: 7 animals). Neither whisker trimming nor S1 infusion affected the increase in low-frequency oscillations detected in the frontal EEG (right; blue versus black, p=0.0873, paired t-test; t=2.041; df=6; d=0.77; red versus blue p=0.6495, unpaired t-test; t=0.47; df=12; d=0.9). Data represent mean ± sem. All tests are two sided.
Extended Data Fig. 9
Spectral power during different vigilance states after SD, time course of local NREM SWA after SD, and time course of vigilance state distribution after SD. Mice experienced a 3-hour SD protocol at the beginning of the light period (ZT0 to ZT3), during which [Cl-]i was manipulated by locally infusing blockers of NKCC1 or KCC2 into S1. a-b. LFP spectral power during REM sleep (‘a’) and wake (‘b’) after SD. No differences were observed in theta frequency (5-10 Hz) during REM sleep with either bumetanide (left; p=0.985, paired t-test; t=0.02; df=5; d=0.01; black and blue: 6 trials, 5 animals) or VU (right; p=0.5625, Wilcoxon matched-pairs signed-ranks test; d=0.4; black and red: 6 trials, 4 animals). In addition, when we compared ZT3 and ZT3-SD vehicle control animals, there was also no difference in theta frequency during REM (p=0.233, unpaired t-test; t=1.23; df=18; d=0.55). c. Time course of NREM SWA after SD, as derived from the S1 LFP (black: 12 trials, 9 animals; blue: 6 trials, 5 animals; red: 6 trials, 4 animals). d. Time course of vigilance states (i.e. global state) showing the proportion of time spent in NREM sleep (top), REM sleep (middle), and wake (bottom) after SD (black: 10 trials, 9 animals; blue: 5 trials, 5 animals, red: 5 trials, 4 animals). Data represent mean ± sem. All tests are two sided.
Extended Data Fig. 10
Extended Data Fig. 10. Activity-dependent regulation of cortical [Cl-]i determines the high levels of local NREM SWA associated with sleep deprivation.
a. Whiskers were trimmed unilaterally at ZT3, when [Cl-]i is normally low, and mice were then subjected to 3 hours of SD (left). NREM SWA was then analysed during the first 2 hours of sleep following SD. Example LFP signals (middle) show SWA recorded from S1 contralateral to intact whiskers (‘intact’; black) and S1 contralateral to the trimmed whiskers (‘trimmed’; blue). Data was collected from the same animal, with an interval of at least 2 days. The S1 contralateral to trimmed whiskers showed reduced SWA during NREM sleep (right; ***p=0.0004, one sample t-test; t=8.506; df=5; d=3.47; 6 animals). b. Using the same paradigm, [Cl-]i was raised in S1 contralateral to the trimmed whiskers by local infusion of the KCC2 blocker, VU (horizontal bar indicates period of infusion). Other conventions as in ‘a’. Pharmacologically raising [Cl-]i reversed the reduction in SWA associated with whisker trimming (right; **p=0.0025, one sample t-test; t=5.583; df=5; d=2.28; 6 animals). Data represent mean ± sem. All tests are two sided.
Fig. 1
Fig. 1. Cortical pyramidal neurons exhibit diurnal variations in EGABAA.
a. Continuous EEG and EMG recordings were performed in freely moving mice (left) and are shown during wake, NREM sleep and REM sleep (right). b. Time spent asleep or awake over 3-hour intervals (top; 10 x 24h recordings from 6 animals). Hypnogram shows typical distribution of vigilance states and arrows indicate when brain slices were prepared (bottom). c. Gramicidin perforated patch recordings examined GABAAR signalling in L5 pyramidal neurons of S1. d. Current clamp recordings show GABAAR responses in a slice prepared at ZT3 or at ZT15 (left). Proportion of depolarizing GABAAR responses (right) was greater at ZT15 compared to ZT3 (*p=0.01, Fisher’s exact test; blue: 19 neurons, 19 slices, 8 animals; orange: 20 neurons, 20 slices, 8 animals). e. GABAAR IV curves from a neuron at ZT3 or ZT15. EGABAA is the membrane potential at which the GABAAR current equals zero. f. EGABAA was more depolarized at ZT15 compared to ZT3 (***p=0.0003, Mann-Whitney test; d=1.29; blue: 18 neurons, 18 slices, 8 animals; orange: 24 neurons, 8 animals). g. A similar EGABAA difference was observed when action potential activity was blocked during recordings (*p=0.0109, unpaired t-test; t=2.708; df=31; d=0.95; blue: 14 neurons, 14 slices, 7 animals; orange: 19 neurons, 19 slices, 7 animals). h. A similar EGABAA difference was observed in L2/3 of auditory cortex (**p=0.006, unpaired t-test; t=2.97; df=28; d=1.09; blue: 13 neurons, 13 slices, 7 animals; orange: 17 neurons, 17 slices, 7 animals). i. The KCC2 cotransporter antagonist, VU0463271 (‘VU’), induced a positive EGABAA shift at ZT15 (left). No significant difference was observed in the VU-induced EGABAA shift at ZT3 and ZT15 (right; p=0.332, unpaired t-test; t=1.025; df=9; d=0.62; blue: 6 neurons, 6 slices, 2 animals; orange: 5 neurons, 5 slices, 2 animals). j. The NKCC1 cotransporter antagonist, bumetanide (‘Bume’), induced a negative EGABAA shift at ZT15 (left). Bumetanide induced larger EGABAA shifts at ZT15 than ZT3 (right; **p=0.0033, unpaired t-test; t=3.538; df=14; d=1.77; blue: 8 neurons, 8 slices, 5 animals; orange: 8 neurons, 8 slices, 4 animals). Data represent mean ± sem. All tests are two sided.
Fig. 2
Fig. 2. Preceding sleep-wake history determines EGABAA in cortical pyramidal neurons.
a. Time spent asleep or awake under normal conditions and following a 3-hour sleep deprivation (SD) protocol performed at light onset (top; 5 days, 5 animals). Representative hypnogram (bottom), conventions as in Fig. 1. b. EEG SWA (left) recorded under normal conditions when sleep pressure (SP) was low (ZT3) or following the SD protocol when sleep pressure was high (ZT3-SD). Relative spectral power confirms high levels of NREM SWA in ZT3-SD (right; ***p<0001, paired t-test; t=11.642; df=9; d=3.68; 10 days, 6 animals; data from boxed EEG regions). c. Gramicidin current clamp recordings show the effect of GABAAR activation upon a L5 pyramidal neuron from the ZT3 or ZT3-SD condition (left). Proportion of depolarizing GABAAR responses (right) was greater in ZT3-SD (***p<0.0001, Fisher’s exact test; red: 10 neurons, 10 slices, 4 animals; blue: data from Fig. 1d). d. GABAAR IV curves from a neuron in the ZT3 or ZT3-SD condition (left). EGABAA (right) was more depolarized in ZT3-SD when sleep pressure was high (***p<0.0001, unpaired t-test; t=8.376; df=26; d=3.3; red: 10 neurons, 10 slices, 4 animals; blue: data from Fig. 1f). e. Gramicidin perforated patch recordings were performed in awake head-fixed mice expressing channelrhodopsin-2 (ChR2) in interneurons. f. Gramicidin current clamp recordings show effect of synaptic GABAAR activation upon a L2/3 pyramidal neuron in the ZT3 or ZT3-SD condition (left). Blue vertical lines indicate ChR2 activation. Proportion of depolarizing GABAAR responses (middle) was greater in the ZT3-SD condition (middle, **p=0.0065, Fisher’s exact test; blue: 10 neurons, 7 animals; red: 8 neurons, 8 animals). No significant difference was observed in the resting membrane potential (right, p=0.65, unpaired t-test; t=0.46; df=16; d=0.25; blue: 10 neurons, 7 animals; red: 8 neurons, 8 animals). g. In vitro gramicidin recordings showed that bumetanide (‘Bume’) induced larger EGABAA shifts in the ZT3-SD condition than in the ZT3 condition (***p<0.0001, unpaired t-test; t=6.033; df=14; d=3.02; red: 8 neurons, 8 slices, 3 animals; blue: data from Fig. 1j). h. Western blot (left) comparing total NKCC1 levels in somatosensory cortex from a mouse in the ZT3 or ZT3-SD condition. Normalized NKCC1 levels (right) were increased in the ZT3-SD condition (*p=0.0193, unpaired t-test; t=2.668; df=13; d=1.38; blue: 7 animals; red: 8 animals). i. Whiskers were trimmed unilaterally at ZT3, when EGABAA is normally hyperpolarized, and mice were subjected to 3 hours of SD. j. Example gramicidin current clamp recordings (left) show the effect of GABAAR activation upon a L5 pyramidal neuron contralateral to the intact whiskers or contralateral to the trimmed whiskers, from the same animal. A higher proportion of hyperpolarizing GABAAR responses were observed contralateral to the trimmed whiskers (right; ***p<0.0005, Fisher’s exact test; 8 pairs, 8 slices, 3 animals). k. EGABAA was more hyperpolarized in the hemisphere contralateral to the trimmed whiskers (**p=0.0078, Wilcoxon matched-pairs signed-ranks test; d=1.55; 8 pairs, 8 slices, 3 animals). Data represent mean ± sem. All tests are two sided.
Fig. 3
Fig. 3. Cortical [Cl-]i regulation determines the level of local SWA during NREM sleep.
a. An LFP electrode coupled to an infusion cannula was targeted to L5 of left S1 and frontal EEG screws were positioned over the right hemisphere. Continuous LFP and EEG recordings were used to monitor local and global spectral power, respectively. b. SWA (black triangle) is most intense at sleep onset (coincident with light onset), when sleep pressure is high, and lessens over the course of sleep. [Cl-]i was manipulated at different points during NREM sleep by locally infusing blockers of NKCC1 or KCC2. c. LFP in a mouse that received vehicle (top) or bumetanide (bottom) during early NREM sleep, on different days. Expanded traces (right) are from the boxed regions. d. Bumetanide infusion during early NREM sleep reduced local spectral power in the SWA range (left; **p=0.0027, paired t-test; t=5.508; df=5; d=2.25; 6 trials, 5 animals), without affecting frontal EEG (right; p=0.3989, paired t-test; t=0.9219; df=5; d=0.38; 6 trials, 5 animals). e. LFP in a mouse that received either vehicle (top) or bumetanide (bottom) during later NREM sleep, when levels of SWA have reduced. f. Bumetanide infusion during later NREM sleep did not affect local spectral power in the SWA range (left; p=0.8006, paired t-test; t=0.2663; df=5; d=0.11; 6 trials, 5 animals), or frontal EEG (right; p=0.972, paired t-test; t=0.0368; df=5; d=0.01; 6 trials, 5 animals). g. LFP in a mouse that received infusion of vehicle (top) or VU (bottom) during later NREM sleep. h. VU infusion during later NREM sleep increased local spectral power in the SWA range (left; **p=0.0073, paired t-test; t=4.366; df=5; d=1.78; 6 trials, 4 animals), without affecting frontal EEG (right; p=0.355, paired t-test; t=1.019; df=5; d=0.42; 6 trials, 4 animals). Data represent mean ± sem. All tests are two sided.
Fig. 4
Fig. 4. Sleep-wake dependent EGABAA determines how easily a cortical neuron is recruited to spike.
a. Cell-attached recordings were used to measure the spiking probability of S1 L5 pyramidal neurons in response to the stimulation of two independent L2/3 input pathways, across different inter-stimulus delays. b. Spiking activity for different inter-stimulus delays in a neuron from the ZT3 low sleep pressure condition, the ZT15 higher sleep pressure condition, ZT3 in the presence of VU, or ZT15 in the presence of bumetanide. Downward vertical arrows indicate the time of the second stimulus and individual spikes are highlighted with shading. c. Normalized spike probability for different inter-stimulus delays and conditions (grey: 8 neurons, 8 slices, 3 animals; black: 10 neurons, 10 slices, 3 animals; red: 8 neurons, 8 slices, 2 animals; blue: 6 neurons, 6 slices, 2 animals) Color-coding as in ‘b’. d. The synaptic integration window for spiking (defined as the time constant of spike probability data in ‘c’) for each of the experimental conditions. Color-coding as in ‘b’. Integration windows are shorter at ZT3 compared to ZT15 (grey versus black; ***p<0.001, Tukey-Kramer post-test; q=6.575; d=2.22), are decreased following NKCC1 blockade at ZT15 (blue versus black; ***p<0.001, Tukey-Kramer post-test; q=6.145; d=2.07), and increased following VU at ZT3 (red versus grey; *p<0.05, Tukey-Kramer post-test; q=4.26; d=1.66). Multiple groups comparison p<0.0001, one-way ANOVA. e. Simple network model to compare neuronal recruitment as a function of [Cl-]i and therefore EGABAA. The model comprised 400 glutamatergic neurons and 100 GABAergic neurons, each receiving synchronous oscillatory input to simulate ON and OFF periods. f. Raster plots of excitatory neuron spiking activity in response to a 1 Hz input, for three different EGABAA values. g. Depolarized EGABAA values are associated with greater neuronal recruitment during ON periods (spike rate normalized to OFF periods). h. EGABAA values affect neuronal recruitment for lower frequencies of oscillatory input. Data represent mean ± sem. All tests are two sided.
Fig. 5
Fig. 5. Depolarized EGABAA boosts NREM SWA by enhancing cortical neuronal recruitment in vivo.
a. Halorhodopsin (‘Halo’, eNpHR3.0) was expressed in S1 excitatory cortical neurons and a combined tetrode and fibre optic implant were targeted to L5 in vivo (left). Optogenetic experiments were performed during periods of NREM sleep at ZT3, when sleep pressure is typically reduced and EGABAA is normally hyperpolarizing. The recordings compared 20 s epochs before light activation, when [Cl-]i would be ‘low’, with 20 s epochs immediately after a period of Halo activation, when the opsin’s effect on the membrane potential is over, but [Cl-]i would still be ‘high’ (right). b. LFP (top), expanded LFP (middle), and multi-unit spiking activity (bottom) under low [Cl-]i (left) and high [Cl-]i (right) conditions. Scale bar, x-axis is 2 s (LFP) and 230 ms (enlarged LFP, MUA and individual units) and y-axis is 0.5 mV (LFP and enlarged LFP) or 40 μV (MUA). Positivity is denoted as positive deflections of the signals. c. LFP spectral power in the SWA range increased after Halo activation (left; ***p<0.0001, Wilcoxon matched-pairs signed-ranks test; d=0.91; 38 trials, 14 days, 5 animals), but not after activation of archaerhodopsin (‘Arch’), which served as a control for membrane hyperpolarization (middle; p=0.094, Wilcoxon matched-pairs signed-ranks test; d=0.3; 34 trials, 10 days, 5 animals; right; ***p<0.0001, Mann-Whitney test; d=1.25). d. Representative phase-plots (left) of multi-unit spiking relative to SWA before (top) and after (bottom) activation of Halo or Arch. Halo-mediated Cl- loading increased spike rate during ON periods of SWA (middle; red: **p=0.0022, Wilcoxon signed-ranks test; d=0.64, 30 trials, 13 days, 5 animals; blue: p=0.867, one sample t-test; t=0.169; df=29; d=0.03, 30 trials, 8 days, 5 animals; right; **p=0.0051, Mann-Whitney test; d=0.77). Data represent mean ± sem. All tests are two sided.
Fig. 6
Fig. 6. [Cl-]i regulation underlies local low-frequency cortical oscillations in the sleep-deprived awake state.
a. An LFP electrode and infusion cannula were targeted to L5 of left S1 and frontal EEG screws were positioned over the right hemisphere (left). Continuous awake LFP and EEG recordings were used to monitor local and global spectral power, respectively. Mice experienced a 3-hour SD protocol at the beginning of the light period (ZT0 to ZT3), during which [Cl-]i was manipulated by locally infusing blockers of NKCC1 or KCC2 into S1 (right; horizontal bar). b. Awake LFP traces from a control mouse show increase in low-frequency oscillations between the 1st hour (top) and 3rd hour (bottom) of SD. c. Awake LFP (left) revealed an increase in the level of low-frequency oscillations (2-6Hz; black: 15 animals), which was reduced by bumetanide (blue versus black, ***p<0.0001, paired t-test; t=10.636; df=6; d=4.02; blue: 7 animals, black: 7 animals) and increased by VU (red versus black, ***p=0.0078, Wilcoxon matched-pairs signed-ranks test; d=1.54; red: 8 animals, black: 8 animals). These manipulations did not affect the frontal EEG (right; blue versus black, p=0.9375, Wilcoxon matched-pairs signed-ranks test; d=0.12; red versus black, p=0.9304, paired t-test; t=0.0918; df=5; d=0.04). d. To test the relationship of the low-frequency oscillations to activity-dependent processes during SD, whiskers were trimmed unilaterally just before the animal experienced a 3-hour SD protocol. Vehicle control (veh) or VU was infused unilaterally during SD (horizontal bar indicates period of infusion). e. The awake LFP (left) revealed that whisker trimming prevented the increase in local low-frequency oscillations (blue versus black, *p=0.0167, paired t-test; t=3.284; df=6; d=1.24; blue: 7 animals, black: 7 animals). This effect could be rescued by VU infusion into S1 (red versus blue, **p=0.0032, unpaired t-test; t=3.679; df=12; d=1.97; red: 7 animals). Neither whisker trimming nor S1 infusion affected the increase in low-frequency oscillations detected in the frontal EEG (right; black versus blue, p=0.135, paired t-test; t=1.72; df=6; d=0.65; blue versus red, p=0.3592, unpaired t-test; t=0.9505; df=13; d=0.49). Data represent mean ± sem. All tests are two sided.
Fig. 7
Fig. 7. [Cl-]i regulation affects the levels of local NREM SWA observed with sleep deprivation.
a. Continuous S1 LFP and EEG recordings were used to monitor local and global spectral power, respectively, as mice entered NREM sleep following a 3-hour SD protocol at the beginning of the light period (ZT0 to ZT3). [Cl-]i was manipulated by locally infusing blockers of NKCC1 or KCC2 into S1 (horizontal bar indicates period of infusion). b. LFP traces recorded during the 1st hour of NREM sleep immediately after SD, in a mouse receiving vehicle (top), bumetanide (middle) or VU (bottom) infusion. c. Bumetanide infusion reduced local spectral power in the SWA range during NREM sleep (left; blue versus black, ***p=0.0001, paired t-test; t=10.47; df=5; d=4.27; blue: 6 trials, 5 animals, black: 6 trials, 5 animals), while VU infusion increased local spectral power in the SWA range (red versus black, ***p=0.0007, paired t-test; t=7.5; df=5; d=3.06; red: 6 trials, 5 animals, black: 6 trials, 5 animals). There was no effect upon frontal EEG (right; blue versus black, p=0.611, paired t-test; t=0.54; df=5; d=0.22; red versus black, p=0.177, paired t-test; t=1.57; df=5; d=0.64). Data represent mean ± sem. All tests are two sided.
Fig. 8
Fig. 8. Cortical [Cl-]i regulation underlies performance levels in the sleep-deprived awake state.
a. Behavioral performance was tested at ZT3 in either ‘rested’ mice that had been allowed to sleep, or sleep-deprived (‘SD’) mice that had experienced a 3-hour SD protocol at the beginning of the light period. Blockers of NKCC1 or KCC2 were locally infused via a cannula targeted to left S1 (horizontal bars indicate period of infusion, arrows indicate time of behavioral task). b. A recognition memory paradigm tested novelty preference in the somatosensory modality (‘tactile task’), as shown. In addition, an odor-based task (‘odor task’) served as a control for sensory modality that was remote from the infusion site (see Methods). Each behavioral trial began with a ‘Sample’ period, in which exploration time was yoked for total stimulus investigation time (60 s for the tactile task, 30 s for the odor task). The animal was then returned to its home cage for a 3 minute interval, after which the animal began the ‘Test’ period. c. SD mice showed lower novelty preference on the tactile task (***p<0.0001, unpaired t-test; t=5.779; df=46; d=1.67; 24 trials, 12 animals). d. Bumetanide infusion into S1 increased tactile task novelty preference in SD mice (***p=0.0003, unpaired t-test; t=4.647; df=16; d=2.19; 9 trials, 9 animals). e. VU infusion into S1 decreased tactile task novelty preference in rested mice (**p=0.0021, unpaired t-test; t=3.76; df=14; d=1.88; 8 trials, 8 animals). f. SD mice showed lower novelty preference on the odor task (***p<0.0001, unpaired t-test; t=6.625; df=30; d=2.34; 16 trials, 8 animals). g. Bumetanide infusion into S1 did not affect odor task novelty preference in SD mice (p=0.6489, unpaired t-test; t=0.46; df=14; d=0.23; 8 trials, 8 animals). h. VU infusion into S1 did not affect odor task novelty preference in rested mice (p=0.4866, unpaired t-test; t=0.7146; df=14; d=0.36; 8 trials, 8 animals). Data represent mean ± sem. All tests are two sided.

References

    1. Vyazovskiy VV, et al. Local sleep in awake rats. Nature. 2011;472:443–447. - PMC - PubMed
    1. Huber R, Ghilardi MF, Massimini M, Tononi G. Local sleep and learning. Nature. 2004;430:78–81. - PubMed
    1. Nir Y, et al. Selective neuronal lapses precede human cognitive lapses following sleep deprivation. Nat Med. 2017;23:1474–1480. - PMC - PubMed
    1. Tobler I, Borbély AA. Sleep EEG in the rat as a function of prior waking. Electroencephalogr Clin Neurophysiol. 1986;64:74–76. - PubMed
    1. Wang Z, et al. Quantitative phosphoproteomic analysis of the molecular substrates of sleep need. Nature. 2018;558:435–439. - PMC - PubMed

Publication types

MeSH terms