

Characteristics of hospitalized patients with COVID-19 during the first to fifth waves of infection: a report from the Japan COVID-19 Task Force
- PMID: 36510172
- PMCID: PMC9744033
- DOI: 10.1186/s12879-022-07927-w
Characteristics of hospitalized patients with COVID-19 during the first to fifth waves of infection: a report from the Japan COVID-19 Task Force
Abstract
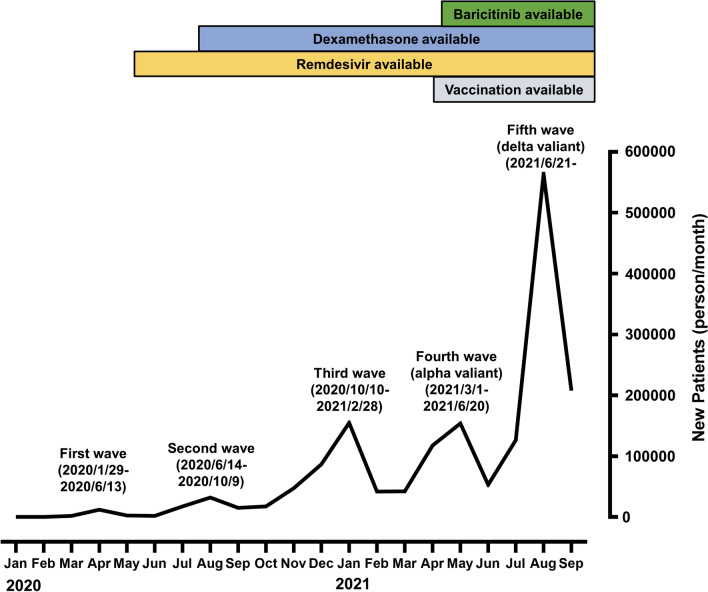
Background: We aimed to elucidate differences in the characteristics of patients with coronavirus disease 2019 (COVID-19) requiring hospitalization in Japan, by COVID-19 waves, from conventional strains to the Delta variant.
Methods: We used secondary data from a database and performed a retrospective cohort study that included 3261 patients aged ≥ 18 years enrolled from 78 hospitals that participated in the Japan COVID-19 Task Force between February 2020 and September 2021.
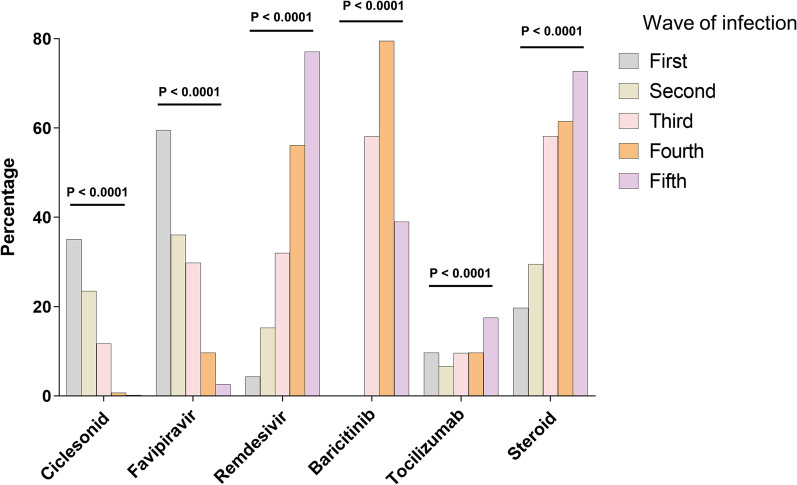
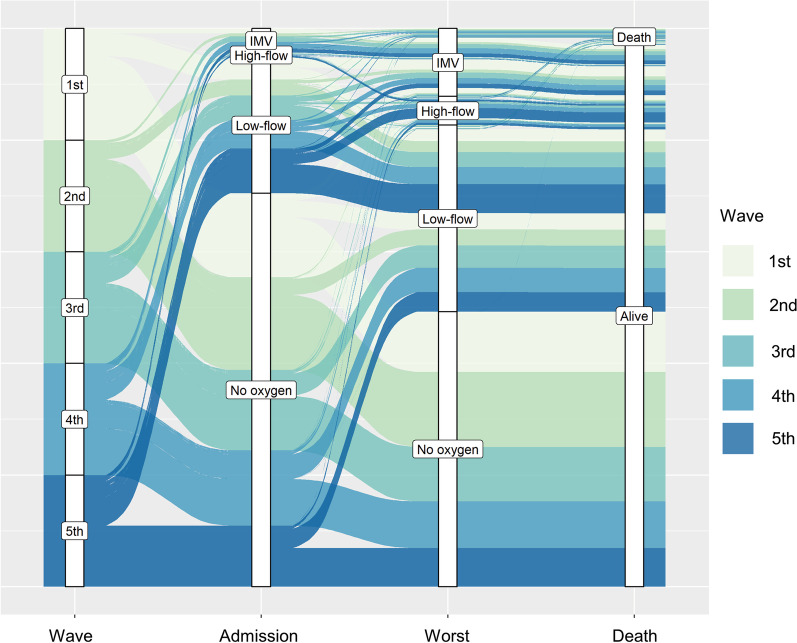
Results: Patients hospitalized during the second (mean age, 53.2 years [standard deviation {SD}, ± 18.9]) and fifth (mean age, 50.7 years [SD ± 13.9]) COVID-19 waves had a lower mean age than those hospitalized during the other COVID-19 waves. Patients hospitalized during the first COVID-19 wave had a longer hospital stay (mean, 30.3 days [SD ± 21.5], p < 0.0001), and post-hospitalization complications, such as bacterial infections (21.3%, p < 0.0001), were also noticeable. In addition, there was an increase in the use of drugs such as remdesivir/baricitinib/tocilizumab/steroids during the latter COVID-19 waves. In the fifth COVID-19 wave, patients exhibited a greater number of presenting symptoms, and a higher percentage of patients required oxygen therapy at the time of admission. However, the percentage of patients requiring invasive mechanical ventilation was the highest in the first COVID-19 wave and the mortality rate was the highest in the third COVID-19 wave.
Conclusions: We identified differences in clinical characteristics of hospitalized patients with COVID-19 in each COVID-19 wave up to the fifth COVID-19 wave in Japan. The fifth COVID-19 wave was associated with greater disease severity on admission, the third COVID-19 wave had the highest mortality rate, and the first COVID-19 wave had the highest percentage of patients requiring mechanical ventilation.
Keywords: COVID-19; Hospitalization; Respiratory infection; Wave of infection.
© 2022. The Author(s).
Conflict of interest statement
The authors declare that they have no competing interests.
Figures


Similar articles
-
Characteristics, outcome, duration of hospitalization, and cycle threshold of patients with COVID-19 referred to four hospitals in Babol City: a multicenter retrospective observational study on the fourth, fifth, and sixth waves.BMC Infect Dis. 2024 Jan 6;24(1):55. doi: 10.1186/s12879-023-08939-w. BMC Infect Dis. 2024. PMID: 38184533 Free PMC article.
-
Demographics, clinical characteristics, and outcomes in hospitalized patients during six waves of COVID‑19 in Northern Iran: a large cohort study.Sci Rep. 2023 Dec 18;13(1):22527. doi: 10.1038/s41598-023-50139-8. Sci Rep. 2023. PMID: 38110656 Free PMC article.
-
Safety and Efficacy of Imatinib for Hospitalized Adults with COVID-19: A structured summary of a study protocol for a randomised controlled trial.Trials. 2020 Oct 28;21(1):897. doi: 10.1186/s13063-020-04819-9. Trials. 2020. PMID: 33115543 Free PMC article.
-
[Characteristics and courses of COVID-19 in patients from the first through fifth waves of the disease: Focused on a single public health center in Tokyo, Japan].Nihon Koshu Eisei Zasshi. 2024 Feb 20;71(2):117-123. doi: 10.11236/jph.23-077. Epub 2023 Nov 27. Nihon Koshu Eisei Zasshi. 2024. PMID: 38008459 Japanese.
-
Clinical Characteristics and Morbidity Associated With Coronavirus Disease 2019 in a Series of Patients in Metropolitan Detroit.JAMA Netw Open. 2020 Jun 1;3(6):e2012270. doi: 10.1001/jamanetworkopen.2020.12270. JAMA Netw Open. 2020. PMID: 32543702 Free PMC article. Review.
Cited by
-
Prognostic significance of hypertension history and blood pressure on admission in Japanese patients with coronavirus disease 2019: integrative analysis from the Japan COVID-19 Task Force.Hypertens Res. 2024 Mar;47(3):639-648. doi: 10.1038/s41440-023-01490-w. Epub 2023 Nov 2. Hypertens Res. 2024. PMID: 37919428
-
Propensity-Score Matched Analysis of the Effectiveness of Baricitinib in Patients With Coronavirus Disease 2019 (COVID-19) Using Nationwide Real-World Data: An Observational Matched Cohort Study From the Japan COVID-19 Task Force.Open Forum Infect Dis. 2023 Jun 8;10(7):ofad311. doi: 10.1093/ofid/ofad311. eCollection 2023 Jul. Open Forum Infect Dis. 2023. PMID: 37441355 Free PMC article.
-
Erector Spinae Muscle to Epicardial Visceral Fat Ratio on Chest CT Predicts the Severity of Coronavirus Disease 2019.J Cachexia Sarcopenia Muscle. 2025 Feb;16(1):e13721. doi: 10.1002/jcsm.13721. J Cachexia Sarcopenia Muscle. 2025. PMID: 39868664 Free PMC article.
-
Effects of an increase in emergency cases with difficulties in transport to hospital during the COVID-19 pandemic on postoperative short-term outcomes of colorectal perforation: A study based on the National Clinical Database.Ann Gastroenterol Surg. 2024 Nov 27;9(3):505-517. doi: 10.1002/ags3.12887. eCollection 2025 May. Ann Gastroenterol Surg. 2024. PMID: 40385336 Free PMC article.
-
Characteristics of patients with COVID-19 who have deteriorating chest X-ray findings within 48 h: a retrospective cohort study.Sci Rep. 2023 Dec 12;13(1):22054. doi: 10.1038/s41598-023-49340-6. Sci Rep. 2023. PMID: 38086863 Free PMC article.
References
-
- Ministry of Health. Labour and Welfare, new coronavirus infection.https://www.mhlw.go.jp/stf/covid-19/kokunainohasseijoukyou.html. Accessed 1 October 2022.
-
- Rampal L, Liew BS. Malaysia’s third COVID-19 wave—a paradigm shift required. Med J Malaysia. 2021;76:1–4. - PubMed
-
- Twohig KA, Nyberg T, Zaidi A, Thelwall S, Sinnathamby MA, Aliabadi S, et al. Hospital admission and emergency care attendance risk for SARS-CoV-2 delta (B.1.617.2) compared with alpha (B.1.1.7) variants of concern: a cohort study. Lancet Infect Dis. 2022;22:35–42. doi: 10.1016/S1473-3099(21)00475-8. - DOI - PMC - PubMed
MeSH terms
Supplementary concepts
Grants and funding
LinkOut - more resources
Full Text Sources
Medical
