Meta-Analysis
. 2022 Dec 12;14(1):140.
doi: 10.1186/s13073-022-01140-9.

Mendelian randomization and genetic colocalization infer the effects of the multi-tissue proteome on 211 complex disease-related phenotypes

Affiliations
Meta-Analysis

Mendelian randomization and genetic colocalization infer the effects of the multi-tissue proteome on 211 complex disease-related phenotypes

Chengran Yang et al. Genome Med. .

Abstract

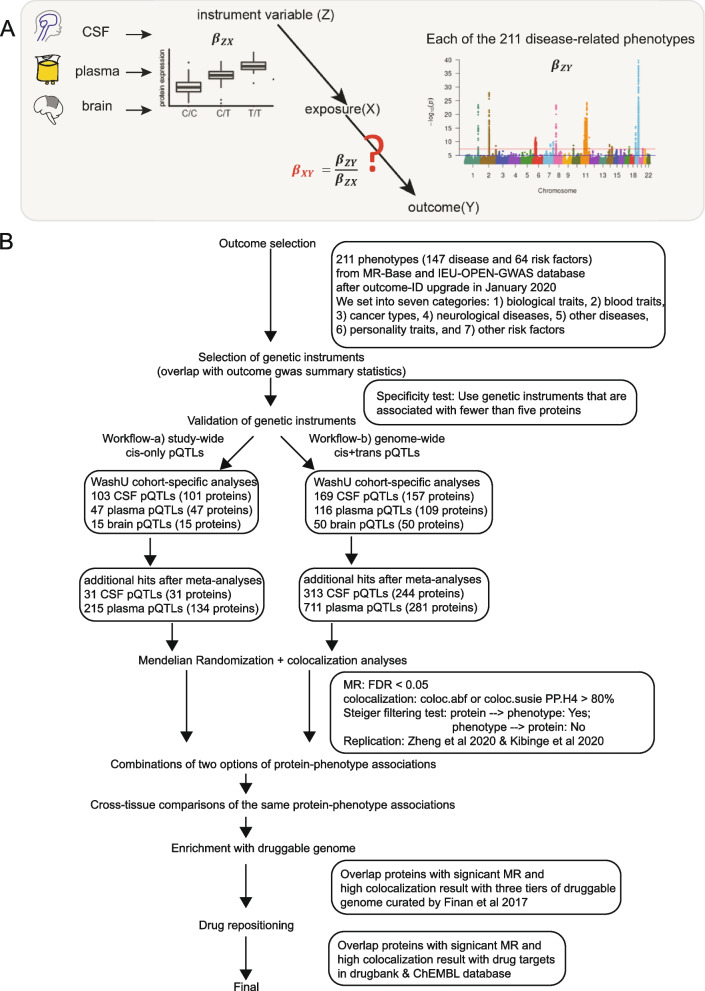
Background: Human proteins are widely used as drug targets. Integration of large-scale protein-level genome-wide association studies (GWAS) and disease-related GWAS has thus connected genetic variation to disease mechanisms via protein. Previous proteome-by-phenome-wide Mendelian randomization (MR) studies have been mainly focused on plasma proteomes. Previous MR studies using the brain proteome only reported protein effects on a set of pre-selected tissue-specific diseases. No studies, however, have used high-throughput proteomics from multiple tissues to perform MR on hundreds of phenotypes.

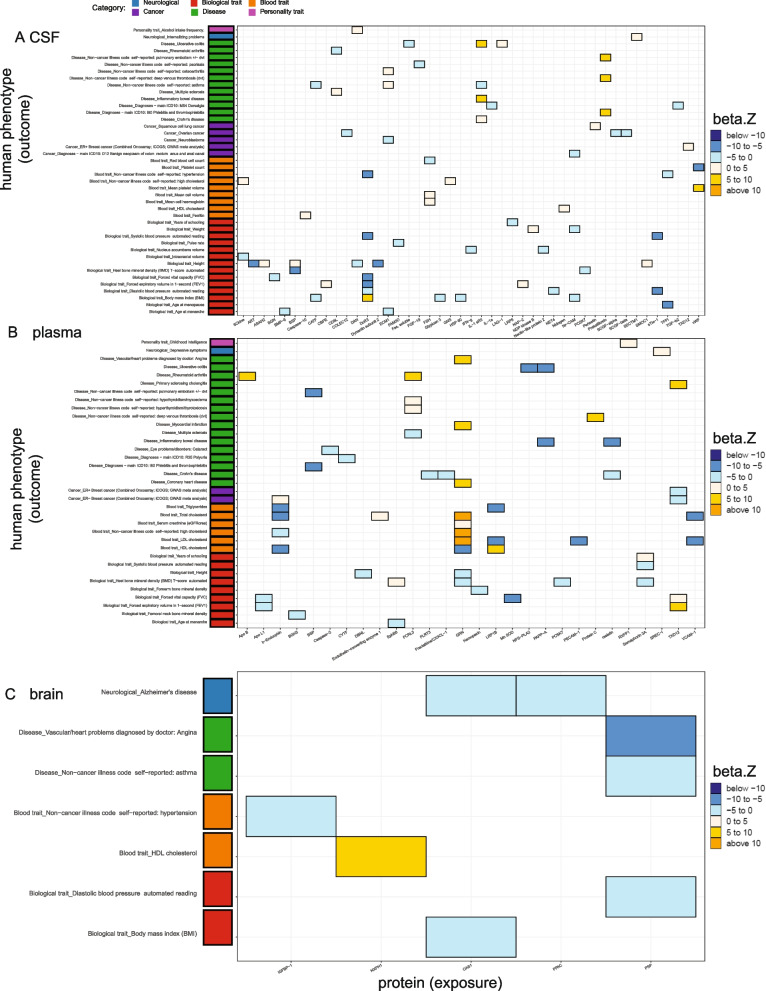
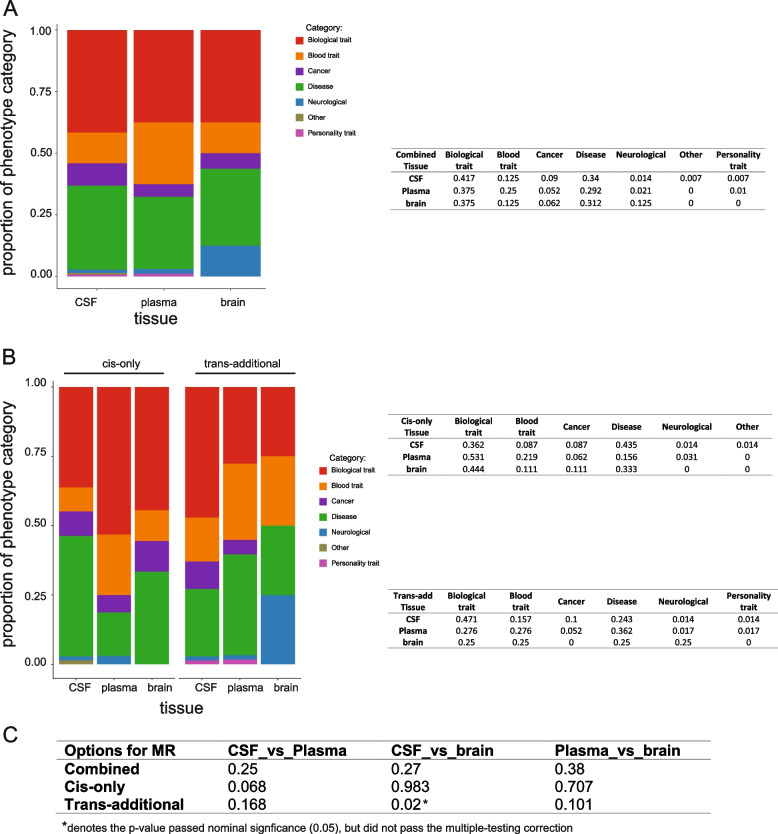
Methods: Here, we performed MR and colocalization analysis using multi-tissue (cerebrospinal fluid (CSF), plasma, and brain from pre- and post-meta-analysis of several disease-focus cohorts including Alzheimer disease (AD)) protein quantitative trait loci (pQTLs) as instrumental variables to infer protein effects on 211 phenotypes, covering seven broad categories: biological traits, blood traits, cancer types, neurological diseases, other diseases, personality traits, and other risk factors. We first implemented these analyses with cis pQTLs, as cis pQTLs are known for being less prone to horizontal pleiotropy. Next, we included both cis and trans conditionally independent pQTLs that passed the genome-wide significance threshold keeping only variants associated with fewer than five proteins to minimize pleiotropic effects. We compared the tissue-specific protein effects on phenotypes across different categories. Finally, we integrated the MR-prioritized proteins with the druggable genome to identify new potential targets.

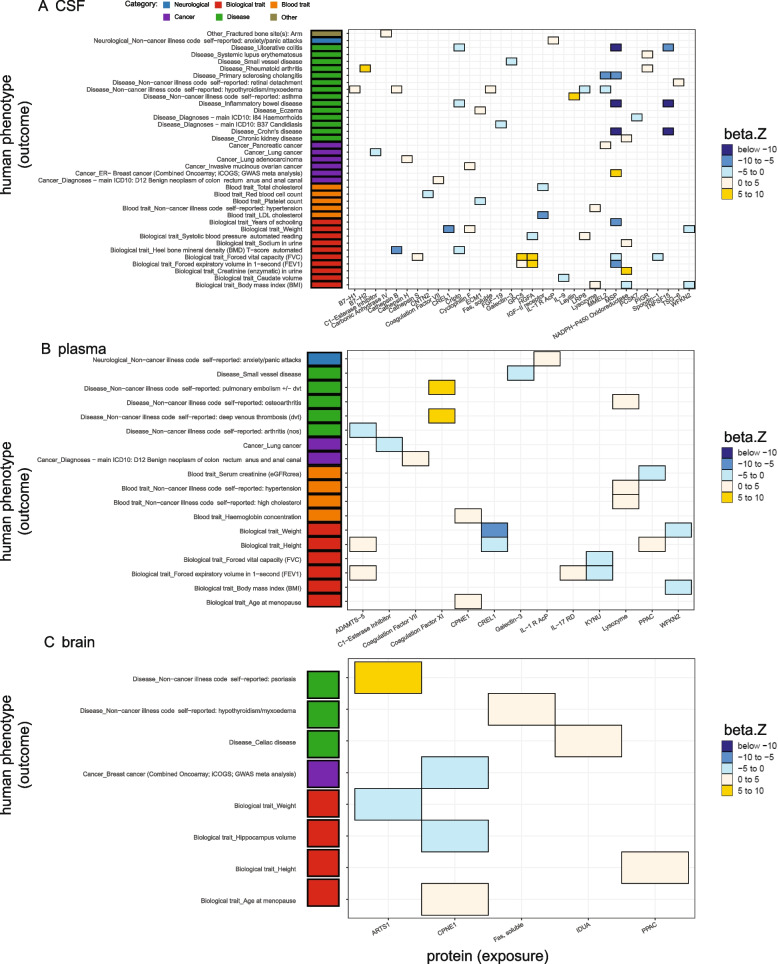
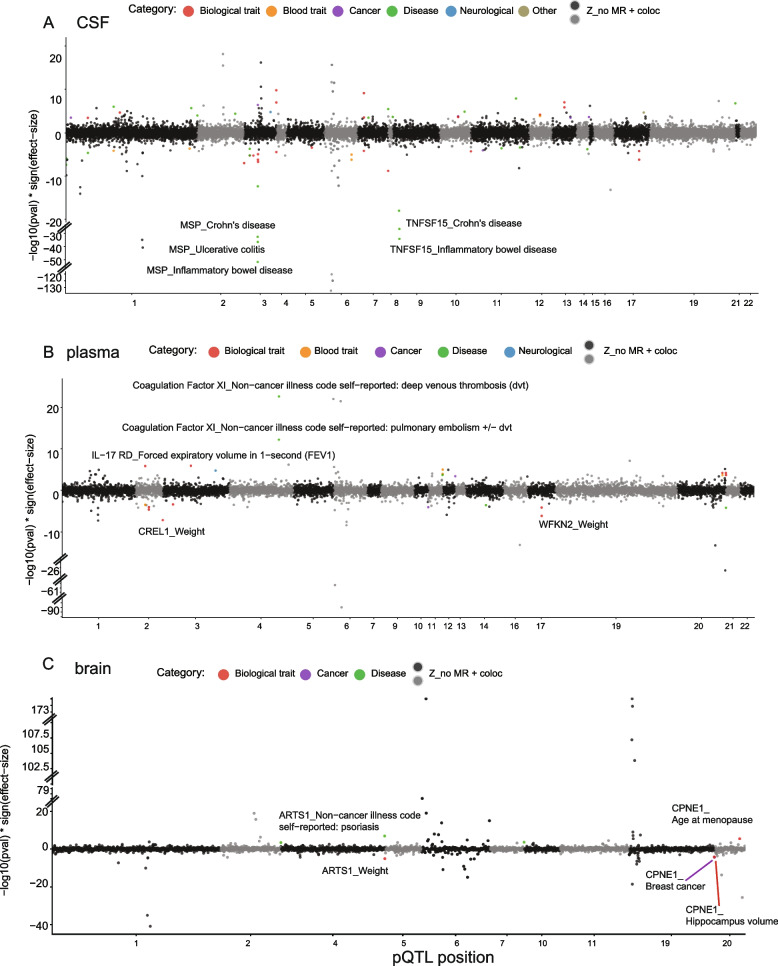
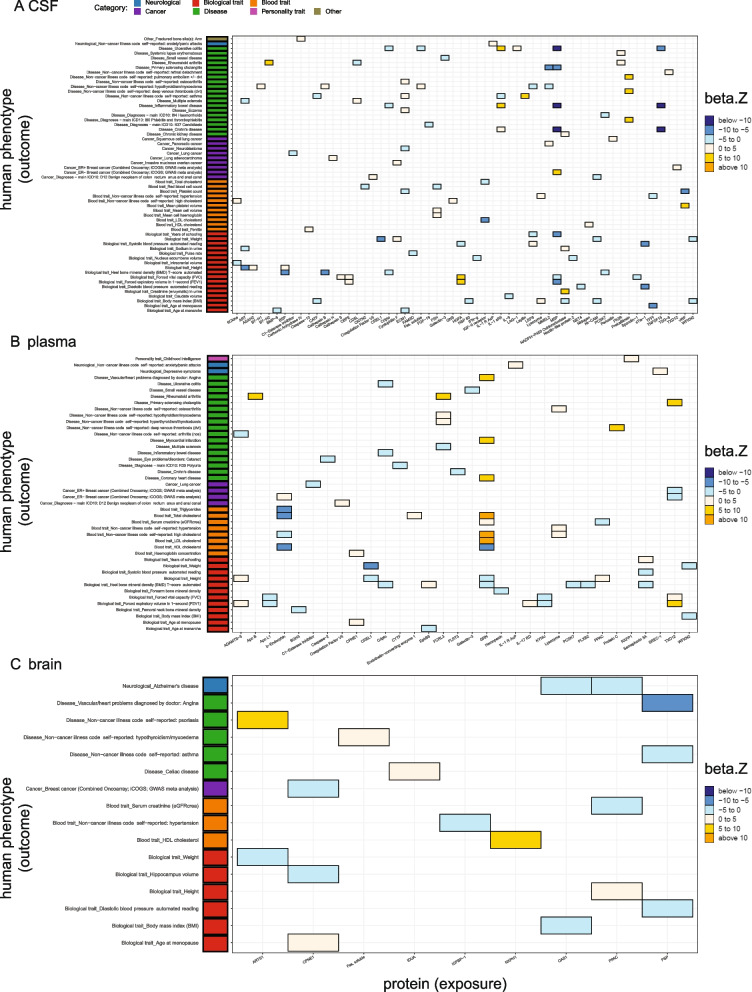
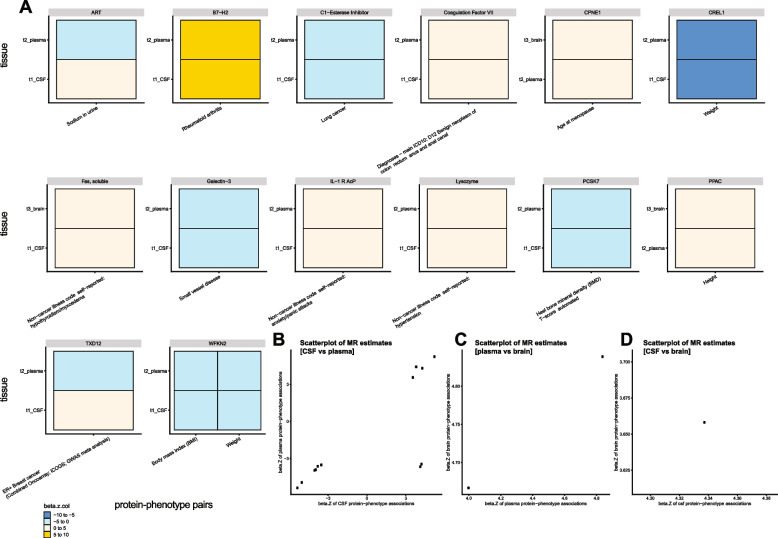
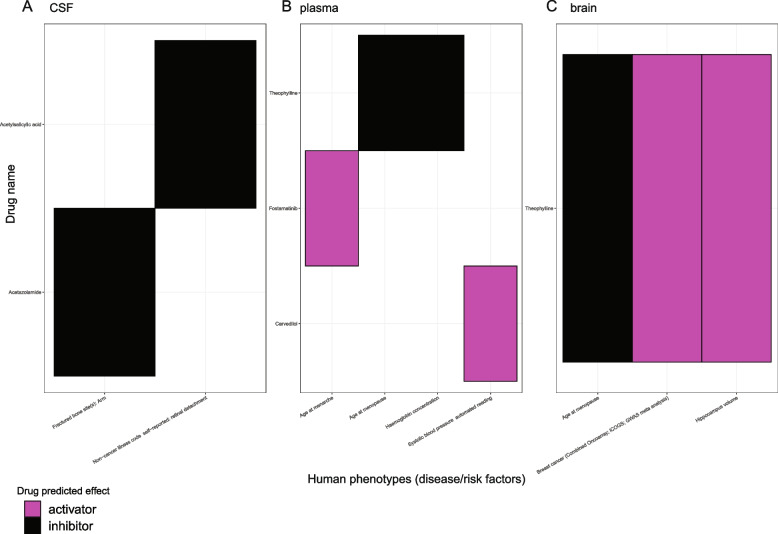
Results: In the MR and colocalization analysis including study-wide significant cis pQTLs as instrumental variables, we identified 33 CSF, 13 plasma, and five brain proteins to be putative causal for 37, 18, and eight phenotypes, respectively. After expanding the instrumental variables by including genome-wide significant cis and trans pQTLs, we identified a total of 58 CSF, 32 plasma, and nine brain proteins associated with 58, 44, and 16 phenotypes, respectively. For those protein-phenotype associations that were found in more than one tissue, the directions of the associations for 13 (87%) pairs were consistent across tissues. As we were unable to use methods correcting for horizontal pleiotropy given most of the proteins were only associated with one valid instrumental variable after clumping, we found that the observations of protein-phenotype associations were consistent with a causal role or horizontal pleiotropy. Between 66.7 and 86.3% of the disease-causing proteins overlapped with the druggable genome. Finally, between one and three proteins, depending on the tissue, were connected with at least one drug compound for one phenotype from both DrugBank and ChEMBL databases.

Conclusions: Integrating multi-tissue pQTLs with MR and the druggable genome may open doors to pinpoint novel interventions for complex traits with no effective treatments, such as ovarian and lung cancers.

Keywords: Complex human phenotypes; Genetic colocalization; Mendelian randomization; Multi-tissue proteomics; Protein quantitative trait loci.


Conflict of interest statement

CC receives research support from GSK. CC is a member of the advisory board of Vivid Genomics and Circular Genomics. The remaining authors declare that they have no competing interests.

Figures

Fig. 1
Fig. 1
Schematics of the study design and flowchart of analyses performed in this study. A Instrumental variables were selected from multi-tissue pQTL datasets and used for performing Mendelian randomization with 211 disease-related phenotypes. B In summary, eight steps were implemented in this study: step 1 as outcome selection; step 2 as genetics instrumental variables selection; step 3 as validation of genetic instrumental variables; step 4 as MR and colocalization analyses with two workflows—(4a) cis-only instrumental variables passing study-wide significance and (4b) cis- and trans-instrumental variables passing genome-wide significance; step 5 as combinations of workflows of protein-phenotype associations within each tissue; step 6 as cross-tissue comparisons of the same protein-phenotype associations; step 7 as enrichment with druggable genome; and step 8 as drug repositioning
Fig. 2
Fig. 2
Significant protein-phenotype associations identified using cis-only study-wide pQTLs as instrumental variables. Heatmaps were generated using the analyses on the WashU cohort only. A Thirty-three proteins against 37 diseases in CSF. B Thirteen proteins against 18 diseases in the plasma. C Five proteins against eight diseases in the brain. Colors were coded by 5 bins after cutting z-normalized beta MR estimate: below − 10 as dark blue, − 10 to − 5 as dodger blue, − 5 to 0 as cadet blue1, 0 to 5 as antique white1, and 5 to 10 as gold. Phenotype categories were listed on the left side as a bar plot (neurological diseases as blue, biological traits as red, blood traits as orange, cancers as purple, non-neurological diseases as green, and other risk factors as khaki)
Fig. 3
Fig. 3
Miami plots for the cis-only study-wide pQTLs as IVs for all MR and colocalization analyses. Each dot represents the MR results for proteins on human phenotypes. A CSF. B Plasma. C Brain. Phenotype categories were color-coded: biological traits as red, blood traits as orange, cancers as purple, non-neurological diseases as green, neurological diseases as blue, and other risk factors as khaki; for protein-phenotype associations not significant or not colocalized, the color is dark/light gray
Fig. 4
Fig. 4
Significant protein-phenotype associations identified using cis and trans genome-wide pQTLs as instrumental variables. Heatmaps were generated using the analyses on the WashU cohort only. A Fifty-eight proteins against 58 diseases in CSF. B Thirty-two proteins against 44 diseases in the plasma. C Nine proteins against 16 diseases in the brain. Colors were coded by 6 bins after cutting z-normalized beta MR estimate: below − 10 as dark blue, − 10 to − 5 as dodger blue, − 5 to 0 as cadet blue1, 0 to 5 as antique white1, 5 to 10 as gold, and above 10 as orange. Phenotype categories were listed on the left side as a bar plot (biological traits as red, blood traits as orange, cancers as purple, non-neurological diseases as green, neurological diseases as blue, personality traits as pink, and other risk factors as khaki)
Fig. 5
Fig. 5
Additional significant protein-phenotype associations were identified after including cis and trans genome-wide pQTLs as instrumental variables. Heatmaps were generated using the analyses after meta-analyses. A Forty-five proteins against 42 diseases in CSF. B Twenty-eight proteins against 35 diseases in the plasma. C Five proteins against seven diseases in the brain. Colors were coded by 6 bins after cutting z-normalized beta MR estimate: below − 10 as dark blue, − 10 to − 5 as dodger blue, − 5 to 0 as cadet blue1, 0 to 5 as antique white1, 5 to 10 as gold, and above 10 as orange. Phenotype categories were listed on the left side as a bar plot (biological traits as red, blood traits as orange, cancers as purple, non-neurological diseases as green, neurological diseases as blue, and personality traits as pink)
Fig. 6
Fig. 6
Cross-tissue MR estimate comparisons. A Heatmaps were generated on the MR estimates given the same protein-phenotype pairs with a PP > 80% when performing colocalization. Colors were coded by 4 bins after cutting z-normalized beta MR estimate: − 10 to − 5 as dodger blue, − 5 to 0 as cadet blue1, 0 to 5 as antique white1, and 5 to 10 as gold. B Scatter plot of CSF vs plasma MR estimates on the same protein-phenotype associations. C Scatter plot of plasma vs brain MR estimates on the same protein-phenotype associations. D Scatter plot of CSF vs brain MR estimates on the same protein-phenotype associations
Fig. 7
Fig. 7
Phenotype-category proportions of MR analyses from each tissue. Barplots were used to visualize the proportions of phenotype category per tissue and the percentage of each proportion was listed in the table in parallel. The MR results are from A combined analyses. B After splitting into cis-only and trans-additional findings by instrumental variables used. C Table summarizing the p-value of the proportion test (two-sided) for the overall phenotype-category proportions of MR analyses between each pair of three tissues. Phenotype categories were color coded as biological traits as red, blood traits as orange, cancers as purple, non-neurological diseases as green, neurological diseases as blue, personality traits as pink, and other risk factors as khaki
Fig. 8
Fig. 8
Phenotype-drug pairs after integration of protein-phenotype associations from MR and drug-protein interactions from DrugBank & ChEMBL databases. Heatmaps were used to visualize drug-name against phenotype for the drug target repurposing purpose. The drug-predicted effects were listed as follows: A in CSF, two drugs can be used as an inhibitor given a positive estimate from MR analyses; B two activators and two inhibitors in plasma; and C two activators and one inhibitor in brain. Colors were coded: activator as magenta and inhibitor as black

References

    1. Burgess S, Davey Smith G, Davies NM, Dudbridge F, Gill D, Glymour MM, et al. Guidelines for performing Mendelian randomization investigations. Wellcome Open Res. 2019;4:186. doi: 10.12688/wellcomeopenres.15555.1. - DOI - PMC - PubMed
    1. Hemani G, Zheng J, Elsworth B, Wade KH, Haberland V, Baird D, et al. The MR-Base platform supports systematic causal inference across the human phenome. Loos R, editor. eLife. 2018;7:e34408. doi: 10.7554/eLife.34408. - DOI - PMC - PubMed
    1. Giambartolomei C, Vukcevic D, Schadt EE, Franke L, Hingorani AD, Wallace C, et al. Bayesian test for colocalisation between pairs of genetic association studies using summary statistics. PLoS Genet. 2014;10:e1004383. doi: 10.1371/journal.pgen.1004383. - DOI - PMC - PubMed
    1. Foley CN, Staley JR, Breen PG, Sun BB, Kirk PDW, Burgess S, et al. A fast and efficient colocalization algorithm for identifying shared genetic risk factors across multiple traits. Nat Commun. 2021;12:764. doi: 10.1038/s41467-020-20885-8. - DOI - PMC - PubMed
    1. Hormozdiari F, van de Bunt M, Segrè AV, Li X, Joo JWJ, Bilow M, et al. Colocalization of GWAS and eQTL signals detects target genes. Am J Hum Genet. 2016;99:1245–1260. doi: 10.1016/j.ajhg.2016.10.003. - DOI - PMC - PubMed

Publication types