. 2022 Dec 7;14(12):evac170.
doi: 10.1093/gbe/evac170.

Dual Domestication, Diversity, and Differential Introgression in Old World Cotton Diploids

Affiliations

Dual Domestication, Diversity, and Differential Introgression in Old World Cotton Diploids

Corrinne E Grover et al. Genome Biol Evol. .

Abstract

Domestication in the cotton genus is remarkable in that it has occurred independently four different times at two different ploidy levels. Relatively little is known about genome evolution and domestication in the cultivated diploid species Gossypium herbaceum and Gossypium arboreum, due to the absence of wild representatives for the latter species, their ancient domestication, and their joint history of human-mediated dispersal and interspecific gene flow. Using in-depth resequencing of a broad sampling from both species, we provide support for their independent domestication, as opposed to a progenitor-derivative relationship, showing that diversity (mean π = 6 × 10⁻³) within species is similar, and that divergence between species is modest (FST = 0.413). Individual accessions were homozygous for ancestral single-nucleotide polymorphisms at over half of variable sites, while fixed, derived sites were at modest frequencies. Notably, two chromosomes with a paucity of fixed, derived sites (i.e., chromosomes 7 and 10) were also strongly implicated as having experienced high levels of introgression. Collectively, these data demonstrate variable permeability to introgression among chromosomes, which we propose is due to divergent selection under domestication and/or the phenomenon of F2 breakdown in interspecific crosses. Our analyses provide insight into the evolutionary forces that shape diversity and divergence in the diploid cultivated species and establish a foundation for understanding the contribution of introgression and/or strong parallel selection to the extensive morphological similarities shared between species.

Keywords: Gossypium arboreum; Gossypium herbaceum; cotton; domestication; introgression.


Figures

Fig. 1.
Fig. 1.
Folded site frequency distribution for Gossypium herbaceum (A; green/left) and Gossypium arboreum (B; blue/right). The black line indicates the neutral expectation based off of Watterson's theta (Hudson 2015).
Fig. 2.
Fig. 2.
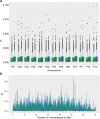
Diversity within Gossypium herbaceum (green) and Gossypium arboreum (blue). (A). Diversity by chromosome (10-kb windows) for G. herbaceum (green/left boxes) and G. arboreum (right/blue boxes). The chromosomal mean is depicted as a line within each box, and the lower and upper hinges correspond to the first and third quartiles, respectively. (B). Diversity for G. herbaceum and G. arboreum along the exemplar chromosome F09. Diversity is shown in 10-kb windows across the chromosome, and a trend line is fitted for each. In most cases, diversity is nearly identical, resulting in a darker blue-green overlap. Depictions of diversity for the remaining chromosomes can be found in supplementary figure S4, Supplementary Material online.
Fig. 3.
Fig. 3.
Watterson's theta (θW) and Tajima's D for Gossypium herbaceum (green line) and Gossypium arboreum (blue boxplot). Both θW and Tajima's D for G. arboreum were calculated using randomly subsampled accessions (50 replicates with 21 accessions each). The chromosomal mean is depicted as a line within each box, and the lower and upper hinges correspond to the first and third quartiles, respectively.
Fig. 4.
Fig. 4.
Population divergence between Gossypium herbaceum and Gossypium arboreum as measured by Weir and Cockerham FST (A) and interpopulation nucleotide divergence (dxy; panel B). An exemplar chromosome (F09) is depicted using 10-kb windows across the chromosome with a trend line fitted. Depictions of these divergence estimates for the remaining chromosomes can be found in supplementary figures S6 and S7, Supplementary Material online.
Fig. 5.
Fig. 5.
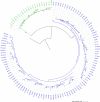
Phylogenetic analysis of accessions passing quality filters. The Gossypium herbaceum (A1) clade is shown in green and the Gossypium arboreum (A2) clade is shown in blue. Nodes with bootstrap support ≥25 are noted.
Fig. 6.
Fig. 6.
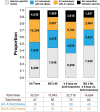
Bifurcation analysis of individual gene tree topologies. The number and proportion of gene trees for Gossypium herbaceum (A1) and Gossypium arboreum (A2) for all 30,251 single-copy genes. Four distinct tree topologies are possible: 1) species-specific clades (light gray/bottom number); 2) A1 individuals that harbor A2 alleles for a given gene (blue/second from bottom); 3) A2 individuals that harbor A1 alleles for a given gene (orange/second from top); and 4) no separation between species (black/top). Numbers and proportions of each respective topology are provided under four filtering methods: 1) No filter, 2) at least one of the clades was required to have ≥90 bootstrap support, 3) a minimum of five individuals in both clades, and 4) both bootstrap support filter and tree-balance filters combined. The table below the graph indicates, for each filtration level: 1) the total number of trees present, 2) the number of significant blocks exhibiting introgressive-like topologies, and the number of blocks suggesting 3) G. arboreum introgression into some accessions of G. herbaceum (A1, A1/A2), or 4) G. herbaceum introgression into some accessions of G. arboreum (A2, A1/A2).
Fig. 7.
Fig. 7.
STRUCTURE (left) and LEA (right) analysis of Gossypium herbaceum (green) and Gossypium arboreum (blue). Newly sequenced accessions are noted with a black bar. Population optimization (see Methods) for STRUCTURE recovered only two populations (K = 2) split along species lines, whereas LEA recovered three populations (K = 3): one G. herbaceum population (green) and two G. arboreum populations (blue). While both STRUCTURE and LEA are based on the same underlying algorithms, LEA appears more sensitive to lineage sorting and/or introgression. A high-resolution version of this image is available at https://github.com/Wendellab/A1A2resequencing and accession details are found in supplementary Table S1, Supplementary Material online.

References

    1. R Core Team . 2020. R: A language and environment for statistical computing. Vienna, Austria: R Foundation for Statistical Computing. https://www.R-project.org/.
    1. Aird D, et al. 2011. Analyzing and minimizing PCR amplification bias in illumina sequencing libraries. Genome Biol. 12:R18. - PMC - PubMed
    1. Allen GC, Flores-Vergara MA, Krasynanski S, Kumar S, Thompson WF. 2006. A modified protocol for rapid DNA isolation from plant tissues using cetyltrimethylammonium bromide. Nat Protoc. 1:2320–2325. - PubMed
    1. Applequist WL, Cronn R, Wendel JF. 2001. Comparative development of fiber in wild and cultivated cotton. Evol Dev. 3:3–17. - PubMed
    1. Basu AK. 1996. Current genetic research in cotton in India. Genetica. 97:279–290.

Publication types