. 2023 Jan 30;378(1869):20210449.
doi: 10.1098/rstb.2021.0449. Epub 2022 Dec 13.

Stereopsis without correspondence

Affiliations

Stereopsis without correspondence

Jenny C A Read. Philos Trans R Soc Lond B Biol Sci. .

Abstract

Stereopsis has traditionally been considered a complex visual ability, restricted to large-brained animals. The discovery in the 1980s that insects, too, have stereopsis, therefore, challenged theories of stereopsis. How can such simple brains see in three dimensions? A likely answer is that insect stereopsis has evolved to produce simple behaviour, such as orienting towards the closer of two objects or triggering a strike when prey comes within range. Scientific thinking about stereopsis has been unduly anthropomorphic, for example assuming that stereopsis must require binocular fusion or a solution of the stereo correspondence problem. In fact, useful behaviour can be produced with very basic stereoscopic algorithms which make no attempt to achieve fusion or correspondence, or to produce even a coarse map of depth across the visual field. This may explain why some aspects of insect stereopsis seem poorly designed from an engineering point of view: for example, paying no attention to whether interocular contrast or velocities match. Such algorithms demonstrably work well enough in practice for their species, and may prove useful in particular autonomous applications. This article is part of a discussion meeting issue 'New approaches to 3D vision'.

Keywords: binocular vision; computational neuroscience; evolution; stereopsis.


Figures

Figure 1.
Figure 1.
Geometry of stereopsis in headcentric coordinates, appropriate for fixed eyes. (a) A horizontal cross-section through the eyes and the space in front of the animal, at zero elevation. The purple shaded region shows the binocular overlap, i.e. the region of space visible to both eyes. This is triangular if the field of view for each eye extends further temporally than nasally. The orange star marks an example point on an example surface. The azimuthal angles αR, αL indicate how far each location is from the direction ‘straight ahead’ in each eye. We define the headcentric azimuth to be the average of these: αH = (αR + αL)/2, while the disparity is their difference: αRαL. The angles marked with * show the value of these angles for the point marked with the star. (b) The same space replotted in terms of the angular location, so that the Cartesian axes are the azimuth in each eye. The red, green arrows mark the axes of αL, αR, respectively. The vertical axis is headcentric disparity δ = αRαL, and the horizontal axis is proportional to headcentric azimuth or visual direction. This runs right to left as a consequence of our coordinate system: we use a right-handed coordinate system in which the Z-axis points out in front of the animal and Y points vertically upwards. Positive azimuth is an anti-clockwise rotation about the Y-axis. In this coordinate system, points within the binocular overlap have positive disparity: larger for nearer objects, and falling to zero for points at infinity. The dashed circles represent the spatial receptive fields of sensors which are tuned both to disparity, and to visual direction (azimuth and, in a 3D model, elevation). (c) Two-dimensional retinal images (i.e. showing both azimuth and elevation). The star is assumed to be at zero elevation in both eyes, and its azimuth in each eye is shown.
Figure 2.
Figure 2.
Toy example to show intuitively why a purely linear sensor (a) does not do correspondence, while a squaring output nonlinearity (b) converts it to doing weak correspondence. This is for a highly reduced stimulus ensemble where there are only three possible values of the monocular inner products: 1, 2, 3, which for simplicity we will assume to have equal probability. Neither of these units does ideal correspondence, because they respond more to non-matching images for which the inner products are 2 and 3 than to matching images for which the inner products are both 1. The linear unit is completely insensitive to correspondence. However, the energy unit shows weak correspondence, in that on average across all images, matching images evoke a stronger response than non-matching images. Note that a threshold can have a similar effect. For example, if one thresholded the linear unit such that responses less than 4 are set to 0, the mean response to non-matching images would be <{0,4,5} > = 3, while that to matching images would be <{0,4,6}> = 3.3. Units which respond differently to matching than to non-matching patterns show tuning to image disparity, since image-patches whose disparity equals that of the unit's receptive fields match, while image-patches with different disparity do not.
Figure 3.
Figure 3.
Local correspondence suffices for sufficiently unambiguous stimuli. This toy example considers a fixed-eye visual system with just four locations in each eye and 13 pairs of locations which correspond to locations in space, defined by the intersection of lines of sight from left and right eyes (in AC, the three pairs corresponding to infinite distance are not visible). The dotted circles in BD represent the 13 disparity sensors which compute the degree to which left and right eye images match at their location. Sensors which are experiencing high local correspondence are filled in red. Note that because in this example, the visual fields extend further medially than temporally, the binocular overlap region (shaded purple) is a truncated diamond in the Cartesian representation.
Figure 4.
Figure 4.
Global correspondence. (a) Top-down view of a scene containing two objects. (b) Cartesian array of disparity sensors; those shaded red would be activated by feed-forward activity from the two eyes, signalling a local match between left and right images within the sensor's window. (c) After adding recurrent connections, as shown ((c) could also be regarded as the activity in a higher brain area receiving input from the layer shown in (b), with the weights indicated). Stereo algorithms often implement mutual excitation between disparity sensors tuned to similar disparities at different cyclopean locations (shown here by gold horizontal lines). They may also postulate inhibitory connections between disparity sensors corresponding to the same location in one eye (oblique blue lines, as in [72]), and/or between disparity sensors corresponding to the same visual direction (vertical blue lines, as in [71]).
Figure 5.
Figure 5.
Binocular geometry modified for an animal, such as a human, with mobile eyes. ϕL, ϕR represent retinal location relative to the fovea. The symbol ⊗ represents the fixation point. V is the vergence angle. The shaded region again indicates the binocular overlap, but now points nearer and further than the geometrical horopter are shaded in different colours. Note that to keep the sign convention the same as in figure 1, positive retinal disparities are defined to be nearer than the fixation point and negative those further away. This is opposite to many definitions in the literature.
Figure 6.
Figure 6.
Sketch of disparity sensors for three different biological situations: (a) for a mobile-eyed animal aiming to produce a disparity map around fixation, based on monkey neurophysiology; (b) for a fixed-eyed animal aiming to take distance into account when orienting towards stimuli; (c) for a fixed-eyed animal aiming to detect when a large, isolated object is in range. None of the drawings are to scale.
Figure 7.
Figure 7.
Four processing steps widely used in machine stereo algorithms. Redrawn from fig. 2 of [51]. Step 1, the matching cost computation, is typically local whereas steps 2–4 incorporate global mechanisms. (Online version in colour.)
Figure 8.
Figure 8.
Ambiguous matching of a repeating stimulus. (a) The stimulus is a grating, with spatial period λ (measured as an angle, e.g. in arcmin). Its edges specify that it has a disparity of +1λ. For example, the left edge is at αL = +2λ in the left eye and αR = +3λ in the right. However, within a period of the fovea, this stimulus is locally indistinguishable from the other, fainter stimuli at disparities differing by multiples of λ. (b) Representation of disparity sensors in V1 (axes as in figure 5b), showing that neurons tuned to disparities of are all activated by this stimulus. (c) Putative higher brain area, perhaps IT, where activity corresponds to perception. Here, long-range interactions across the visual field have propagated the disparity defined by the edges across the ambiguous region. Perceptual resolution reflects the relatively coarse scale of the neurons tuned to disparity +λ in this neural-correlate area, rather than the fine scale of neurons tuned to zero disparity which are active in V1. In this sketch, for simplicity, I have shown the disparity sensor windows as circles rather than depicting their narrower tuning for disparity as in figure 6. (Online version in colour.)
Figure 9.
Figure 9.
Stereoscopic network for controlling head saccades. In the monocular layers, each unit encodes a location in left (red) or right (green) retina. These layers then project onto a binocular output layer (blue), where each unit encodes a direction in which to turn the head. Lines show example connections onto one example output unit. (α,κ) are azimuth and elevation respectively; see Methods for details. (Online version in colour.)
Figure 10.
Figure 10.
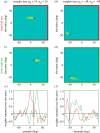
Network weights following training. The columns show weights into two example output units, representing the directions indicated at the top and marked with a cross +. AB, CD show weights from the input layer units representing left, right eyes, respectively. The colour axis is the same in all panels, and set such that zero is green, positive weights are yellow and negative are blue. EF show the total weights for each azimuth, summed over elevation, with weights from left (red) and right (green) eyes superimposed. This figure was generated by file Fig_ShowWeights.m. (Online version in colour.)
Figure 11.
Figure 11.
(a) This is a reproduction of figure 2c from [103], showing the distribution of mantis head angles after the first (top) and second (bottom) saccades. The targets are at ±15° azimuth (dashed lines), and equal elevation; the left target is 4 cm from the animal and right at 14 cm; both have the same angular size (4° × 20°) and same angular elevation. (b) Simulation results, in which the model views two spherical objects, at ±15° azimuth (dashed lines) and equal elevation; the left target is at 4 cm from the animal and the right at 8 cm; both have the same angular size (15° corresponding to physical diameters of 1.1 cm and 2.1 cm, respectively). The histogram shows distribution of (the first) head saccade for 1000 presentations of the (noisy) stimulus. (c) An example noisy monocular input image. (b,c) Produced with Matlab file AssessPerformance.m. (Online version in colour.)
Figure 12.
Figure 12.
Model's preference to fixate near targets. Colour represents the proportion of trials on which the model made a saccade towards the nearer of two targets. The two targets were to left and right of the animal, at azimuth ±15°. (a) Targets varied in distance as shown on the axes, but their physical size was adjusted so that both targets always subtended the same angle (10°) on the retina. (b) The distances were fixed at 8 cm, 4 cm for left, right targets, respectively. These plots were generated by file AssessPerformance.m. (Online version in colour.)
Figure 13.
Figure 13.
Properties of a binocular ‘disparity sensor’ with centre/surround monocular receptive fields. Top-down view of an animal, showing left and right eyes. On the left, we show one-dimensional cross-sections through the retinal receptive fields feeding into a binocular neuron, and on the right we project the receptive fields out into the space in front of the animal. Red, green lines mark the centre of the monocular receptive fields in each eye. In each eye, yellow colour-codes a central excitatory region and blue an inhibitory surround region. The monocular receptive fields are thus tuned to stimuli of a given angular size. In space, yellow regions are those which project to the excitatory regions in both eyes, blue to inhibitory in both eyes, and green those which project to the excitatory region of one eye's receptive field and the inhibitory region of the other. The optimal stimulus is indicated by the smaller dashed circle: this object falls in the central excitatory region in both eyes without stimulating any inhibitory region. The two larger dotted circles mark positions where two large objects could cause a ‘ghost match’ by producing the same image in each eye as the optimal stimulus (as well as a second image due to the other object). However, because these objects produce excitatory stimulation in only one eye, while inhibiting the other, they do not activate the binocular neuron. The dice and arrow leading from the binocular neuron to an image of the mantis fore-arm indicates that activity in the binocular neuron controls the probability that the mantis strikes. (Online version in colour.)
Figure 14.
Figure 14.
Size and disparity tuning of the model sketched in figure 13, reproduced from [44] but correcting an error in the empirical results as plotted in that publication. Solid lines show the mean number of strikes elicited from the model animal by a moving target at the distance indicated by the colour, and with the diameter indicated on the horizontal axis. Dashed lines show corresponding empirical results with praying mantises [111]. In the model, the mean number of strikes elicited by each trial is taken to be proportional to the time-averaged activity of the binocular neuron. (Online version in colour.)
Figure 15.
Figure 15.
‘Ghost match’ geometry. Two identical distant objects (purple dots) create the same local retinal image as a single, smaller, nearer object (black dot), plus a second image in each eye. BC: Model containing a single disparity sensor. The excitatory and inhibitory connections onto this from the monocular images have a similar effect to the connections between pairs of disparity sensors in figure 4c, in that they prevent the sensor from being activated by the ghost match. (Online version in colour.)
Figure 16.
Figure 16.
Schematic drawing showing model proposed by Kral & Prete [42] for mantis stereo-guided strikes. LGMD, lobula giant movement detector; DCMD, descending contralateral movement detector. Redrawn from fig. 3.15 of [42]. (Online version in colour.)
Figure 17.
Figure 17.
Mantids tailor strike trajectories according to stereoscopic disparity, for a given angular size. Reproduction of figure 3b from [101] showing data for a single mantis. The origin is the centre of the mantis head and the y-axis indicates the direction of the target. Curves show the path of the femur tip, each curve averaged over 30 strikes, for targets at stereoscopic distances of 25, 35, 45, 55 mm. The target was physically always at 55 mm with an angular diameter of 20°; nearer distances were simulated with prisms. Fifty-five millimetres is out of range and so no prey contact occurred during any of the strikes. I have superimposed the average strike rates for each distance, taken from of fig. 5 of [101]. These are the average over six animals, and it is not known whether these included the animal whose strike trajectories are plotted here.
Figure 18.
Figure 18.
Example scene used for training. There are four objects, with headcentric azimuth-longitudes −40°, 31°, −17°, 29° and elevation-latitudes 52°, 4°, 0°, −54°, at distances of 3.7, 6.0, 7.8, 9.0 cm, respectively. Their diameter scales with their distance such that all subtend the same size, 10°, at the origin. (a) perspective view of the scene. X, Y, Z are the world-centric axes. The red and green disk mark the left and right eyes. The blue line is the gaze vector, here aligned with the Z-axis. The yellow line points from the origin to the closest object. (b) The left and right retinal images superimposed. Red, blue show the objects in left, right retinas. The yellow cross marks the headcentric azimuth and elevation of the nearest object. For correct behaviour, given this input, the most active unit in the output layer should be the one closest to this. In both panels, we are viewing from behind the head so the X and azimuth axes increase towards the left. This figure was generated by Make3DscenesConstAngSize_Fig.m. (Online version in colour.)

References

    1. Smith AM. 1996. Ptolemy's theory of visual perception: an English translation of the ‘Optics’ with introduction and commentary. Trans. Am. Philos. Soc. 86, iii-300. (10.2307/3231951) - DOI
    1. Wade NJ, Ono H. 2012. Early studies of binocular and stereoscopic vision1. Jpn. Psychol. Res. 54, 54-70. (10.1111/j.1468-5884.2011.00505.x) - DOI
    1. Aguilonius F. 1613. Opticorum libri sex. Antwerp, Belgium: Jan Moretus widow & sons.
    1. Boyle R. 1688. A disquisition about the final causes of natural things; wherein it is inquir'd, whether, and (if at all) with what cautions, a naturalist should admit them? To which are subjoyn'd, by way of appendix, some uncommon observations about vitiated sight. London, UK: J. Taylor. See https://wellcomecollection.org/works/bphbffzz.
    1. Wheatstone C. 1838. On some remarkable, and hitherto unobserved, phenomena of binocular vision. Phil. Trans. R. Soc. Lond. B 128, 371-394. - PubMed

LinkOut - more resources