. 2023 Feb 15;133(4):e156722.
doi: 10.1172/JCI156722.

LepRb+ cell-specific deletion of Slug mitigates obesity and nonalcoholic fatty liver disease in mice

Affiliations

LepRb+ cell-specific deletion of Slug mitigates obesity and nonalcoholic fatty liver disease in mice

Min-Hyun Kim et al. J Clin Invest. .

Abstract

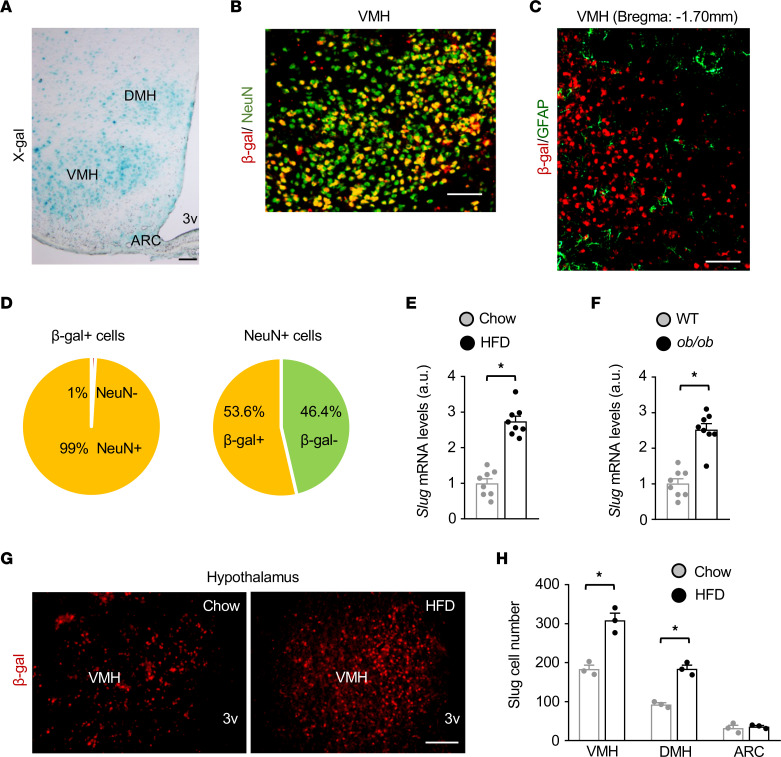
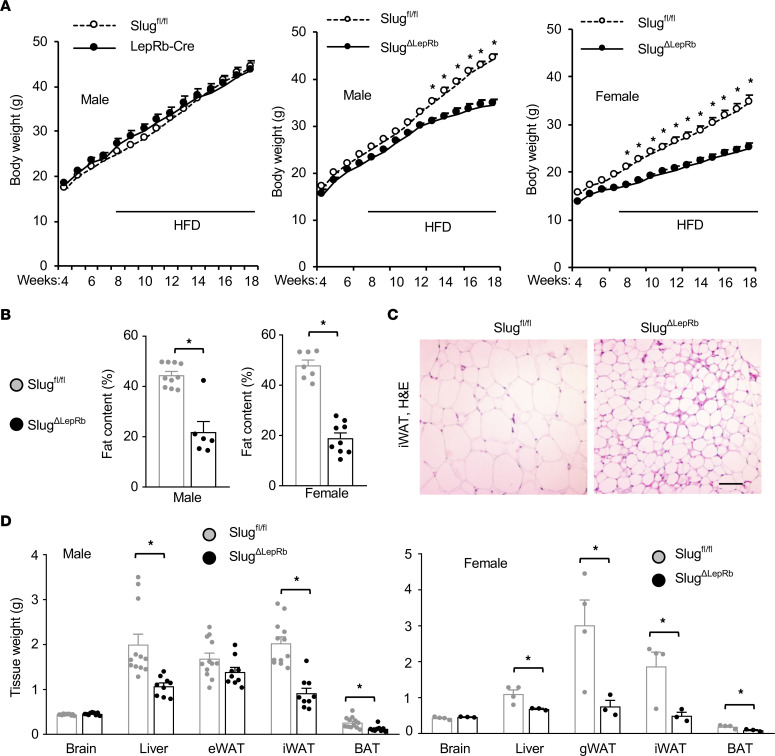
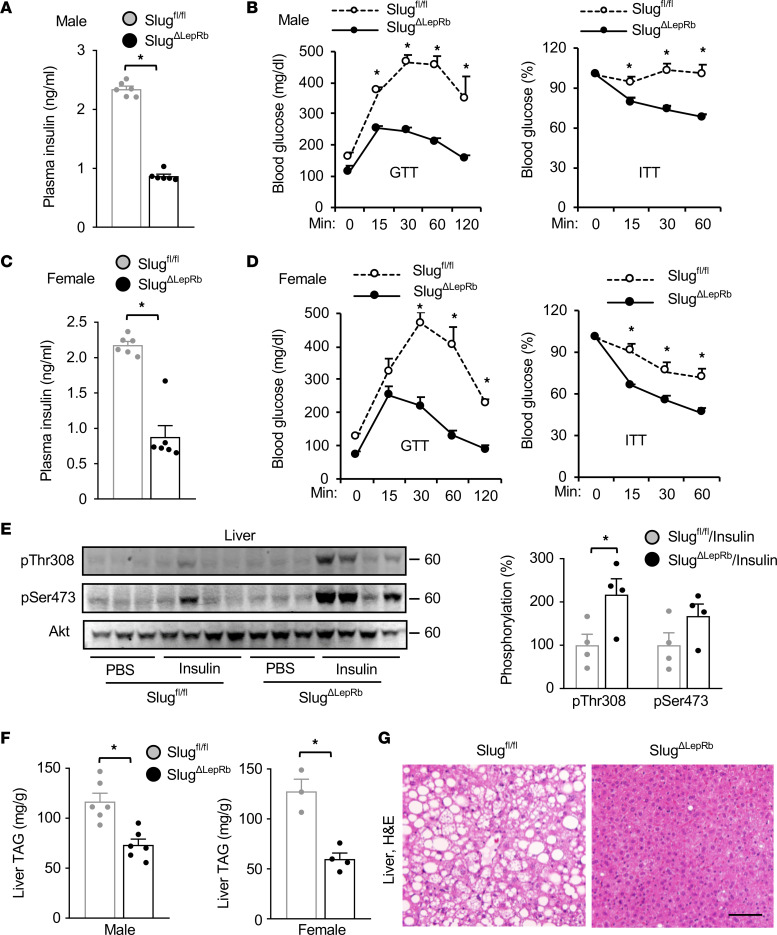
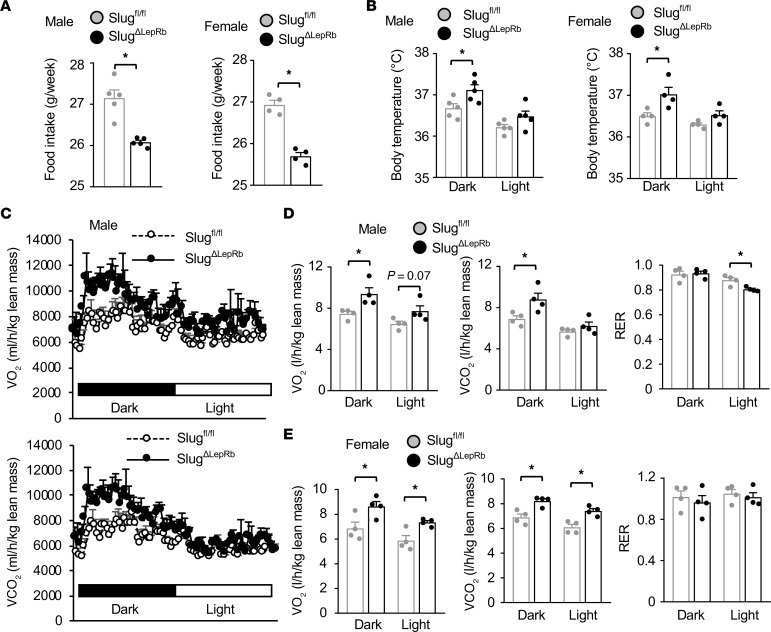
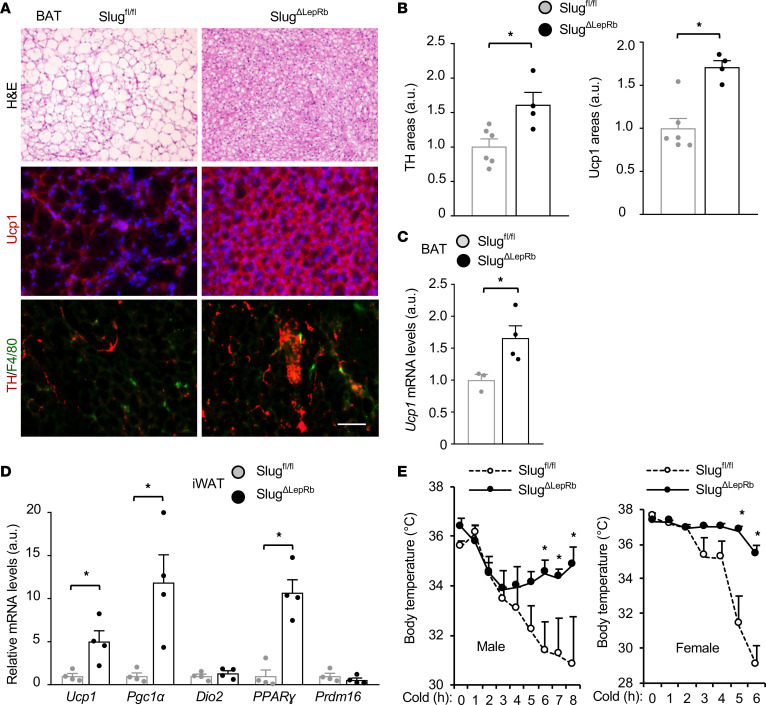
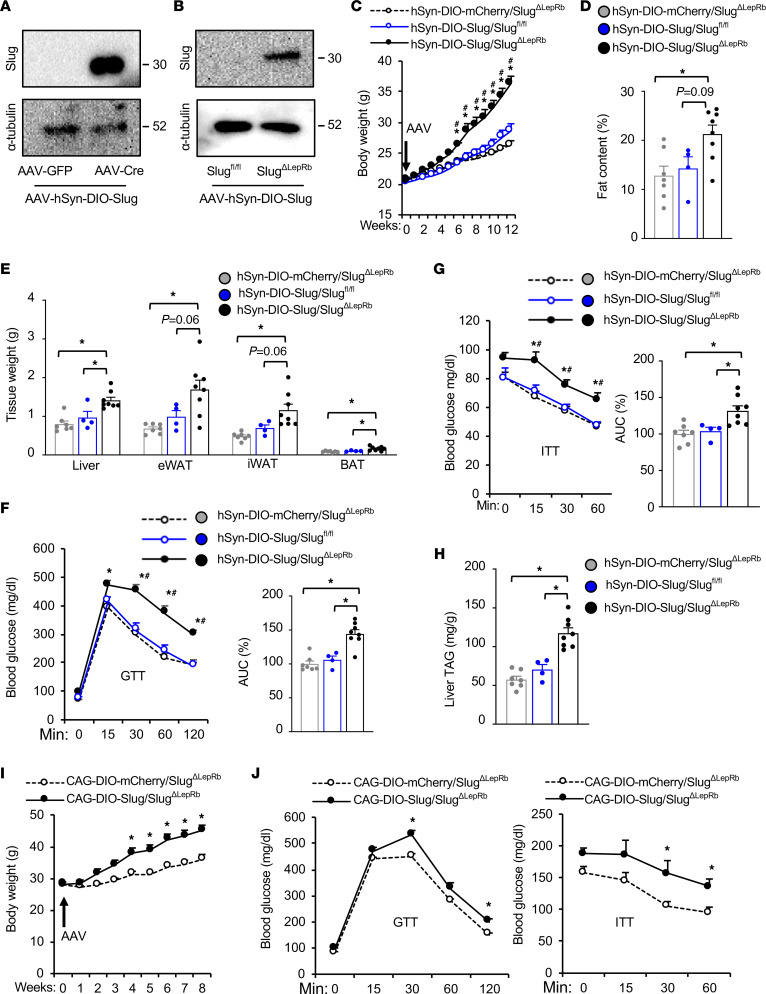
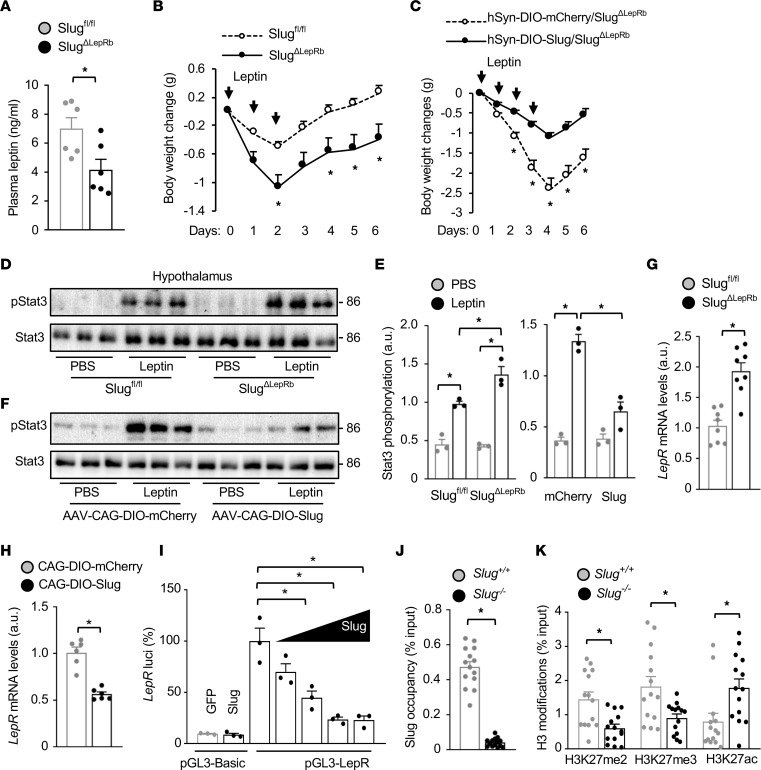
Leptin exerts its biological actions by activating the long-form leptin receptor (LepRb). LepRb signaling impairment and leptin resistance are believed to cause obesity. The transcription factor Slug - also known as Snai2 - recruits epigenetic modifiers and regulates gene expression by an epigenetic mechanism; however, its epigenetic action has not been explored in leptin resistance. Here, we uncover a proobesity function of neuronal Slug. Hypothalamic Slug was upregulated in obese mice. LepRb+ cell-specific Slug-knockout (SlugΔLepRb) mice were resistant to diet-induced obesity, type 2 diabetes, and liver steatosis and experienced decreased food intake and increased fat thermogenesis. Leptin stimulated hypothalamic Stat3 phosphorylation and weight loss to a markedly higher level in SlugΔLepRb than in Slugfl/fl mice, even before their body weight divergence. Conversely, hypothalamic LepRb+ neuron-specific overexpression of Slug, mediated by AAV-hSyn-DIO-Slug transduction, induced leptin resistance, obesity, and metabolic disorders in mice on a chow diet. At the genomic level, Slug bound to and repressed the LepRb promoter, thereby inhibiting LepRb transcription. Consistently, Slug deficiency decreased methylation of LepRb promoter H3K27, a repressive epigenetic mark, and increased LepRb mRNA levels in the hypothalamus. Collectively, these results unravel what we believe to be a previously unrecognized hypothalamic neuronal Slug/epigenetic reprogramming/leptin resistance axis that promotes energy imbalance, obesity, and metabolic disease.

Keywords: Cell Biology; Diabetes; Leptin; Metabolism; Obesity.


Conflict of interest statement

Conflict of interest: The authors have declared that no conflict of interest exists.

Figures

Figure 1
Figure 1. Hypothalamic Slug is upregulated in obesity.
(A) Representative X-gal staining of SlugLacZ/+ mouse hypothalamic sections (n = 7 mice). (B and C) Representative hypothalamic images (n = 3 mice per group). Hypothalamic sections were prepared from SlugLacZ/+ mice and coimmunostained with antibodies to β-gal, NeuN, and GFAP as indicated. (D) VMH cell subpopulations were counted (n = 3 mice). (E) Hypothalamic Slug mRNA levels (normalized to 36B4 expression) in C57BL/6J male mice on a HFD for 15 weeks (n = 8 mice per group). a.u., arbitrary units. (F) Hypothalamic Slug mRNA levels in WT and ob/ob male mice at 14 weeks of age (n = 8 mice per group). (G and H) Hypothalamic sections were prepared from SlugLacZ/+ male mice (HFD for 3 weeks) and stained with anti–β-gal antibody. β-gal neurons in the VMH, DMH, and ARC were counted (n = 3 mice per group). Data are presented as mean ± SEM. *P < 0.05, 2-tailed unpaired Student’s t test.
Figure 2
Figure 2. LepRb cell-specific ablation of Slug protects against HFD-induced obesity.
(A) Growth curves. Left: Slugfl/fl, n = 24; LepRb-Cre, n = 8. Middle: Slugfl/fl, n = 24; SlugΔLepRb, n = 15. Right: Slugfl/fl, n = 15; SlugΔLepRb, n = 13. (B) Fat content (% body weight, HFD for 12 weeks). Male Slugfl/fl, n = 10; male SlugΔLepRb, n = 6; female Slugfl/fl, n = 7; female SlugΔLepRb, n = 9. (C) Representative H&E staining of male iWAT sections (HFD for 13 weeks, n = 3 mice per genotype). Scale bar: 200 μm. (D) Tissue weight (HFD for 13 weeks). Male Slugfl/fl, n = 12; male SlugΔLepRb, n = 9; female Slugfl/fl, n = 4; female SlugΔLepRb, n = 3. Data are presented as mean ± SEM. *P < 0.05, 2-way ANOVA (A) and 2-tailed unpaired Student’s t test (B and D).
Figure 3
Figure 3. LepRb cell–specific ablation of Slug protects against HFD-induced type 2 diabetes and NAFLD.
(A) Male overnight-fasted plasma insulin levels (HFD for 10 weeks). Slugfl/fl, n = 6; SlugΔLepRb, n = 6. (B) Male GTT and ITT (HFD for 13 weeks). Slugfl/fl, n = 4; SlugΔLepRb, n=5. (C) Female overnight-fasted plasma insulin levels (HFD for 10 weeks). Slugfl/fl, n = 6; SlugΔLepRb, n = 6. (D) Female GTT and ITT (HFD for 12 weeks). Slugfl/fl, n = 3; SlugΔLepRb, n = 4. (E) Slugfl/fl and SlugΔLepRb males (HFD for 13 weeks) were fasted overnight and treated with PBS (n = 3) or insulin (n = 4). Liver extracts were immunoblotted with antibodies to phospho-Akt and Akt. Phospho-Akt was normalized to Akt. (F) Liver TAG levels (normalized to liver weight; HFD for 13 weeks). Male Slugfl/fl, n = 6; male SlugΔLepRb, n = 6; female Slugfl/fl, n = 3; female SlugΔLepRb, n = 4. (G) Representative H&E staining of male liver sections (HFD for 13 weeks, n = 4 mice per group). Scale bar: 200 μm. Data are presented as mean ± SEM. *P < 0.05, 2-tailed unpaired Student’s t test (A, C, E, and F) and 2-way ANOVA (B and D).
Figure 4
Figure 4. Slug deficiency in LepRb cells induces energy imbalance.
Mice were fed a chow diet. (A) Food intake at 9 weeks of age. Male Slugfl/fl, n = 5; male SlugΔLepRb, n = 5; female Slugfl/fl, n = 4; female SlugΔLepRb, n = 4. (B) Body core temperatures at 9–10 weeks of age. Male Slugfl/fl, n = 5; male SlugΔLepRb, n = 5; female Slugfl/fl, n = 4; female SlugΔLepRb, n = 4. (C–E) O2 consumption, CO2 production (normalized to lean mass), and respiratory exchange ratio (RER) at 9 weeks of age (n = 4 mice per group). Data are presented as mean ± SEM. *P < 0.05, 2-tailed unpaired Student’s t test.
Figure 5
Figure 5. Slug deficiency in LepRb cells enhances adipose thermogenesis.
(A) Representative BAT images (n = 4 mice per group). BAT sections were stained with H&E (HFD for 15 weeks) or antibodies to Ucp1 and TH (HFD for 12 weeks). Scale bar: 200 μm. (B) Ucp1 and TH areas were quantified and normalized to total areas. Slugfl/fl, n = 6; SlugΔLepRb, n = 4. a.u., arbitrary units. (C) Male BAT Ucp1 mRNA levels (normalized to 36B4 expression, HFD for 12 weeks). Slugfl/fl, n = 3; SlugΔLepRb, n = 4. (D) Gene expression in iWAT (normalized to 36B4 levels). Male mice (10 weeks) were exposed to cold (8°C for 2 hours) daily for 5 days. Slugfl/fl, n = 4; SlugΔLepRb, n = 4. (E) Cold tolerance test at 19 weeks of age on chow diet. Male Slugfl/fl, n = 4; male SlugΔLepRb, n = 4; female Slugfl/fl, n = 4; female SlugΔLepRb, n = 5. Data are presented as mean ± SEM. *P < 0.05, 2-tailed unpaired Student’s t test (B–D) and 2-way ANOVA (E).
Figure 6
Figure 6. Hypothalamic LepRb neuron–specific overexpression of Slug induces obesity.
(A) AAV-hSyn-DIO-Slug vectors were coinjected with either AAV-CAG-GFP or AAV-CAG-Cre vectors into the brains of C57BL/6J mice. Brain extracts were prepared 3 weeks later and immunoblotted with antibodies against Slug or α-tubulin. (B–H) AAV-hSyn-DIO-Slug or AAV-hSyn-DIO-mCherry vectors were bilaterally microinjected into the MBH of SlugΔLepRb (Slugfl/fl;LepRb-Cre+/+) males (8 weeks, on chow diet). Slugfl/fl males (lacking Cre) were injected with AAV-hSyn-DIO-Slug vectors (control). (B) Hypothalamic extracts were immunoblotted with antibodies against Slug or α-tubulin (12 weeks after AAV transduction). (C) Body weight. (D) Fat content at 12 weeks after AAV transduction (% body weight). (E) Tissue weight (12 weeks after AAV transduction). (F and G) GTT and ITT at 11 weeks after AAV transduction. (H) Liver TAG levels at 12 weeks after AAV transduction (normalized to liver weight). AAV-hSyn-DIO-Slug/ SlugΔLepRb, n = 8; AAV-hSyn-DIO-mCherry/SlugΔLepRb, n = 7; AAV-hSyn-DIO-Slug/Slugfl/fl, n = 4. (I and J) AAV-CAG-DIO-Slug or AAV-CAG-DIO-mCherry vectors were bilaterally microinjected into the MBH of SlugΔLepRb (Slugfl/fl;LepRb-Cre+/–) male mice at 9 weeks of age on chow diet (n = 5 mice per group). (I) Body weight. (J) GTT (2 g glucose/kg) and ITT (1 unit insulin/kg) at 8 weeks after AAV transduction. Data are presented as mean ± SEM. *P < 0.05, 1-way (D and E, F [right panel], G [right panel], and H) and 2-way (C, F [left panel], G [left panel], I, and J) ANOVA.
Figure 7
Figure 7. Slug directly suppresses LepRb expression and induces leptin resistance.
(A) Male overnight-fasted plasma leptin levels (8 weeks old, chow diet, n = 6 mice per group). (B) Male mice (7 weeks old, chow diet) were treated with leptin for 3 days. Body weight changes were measured (n = 5 mice per group). (C) AAV-hSyn-DIO-Slug (n = 8) or AAV-hSyn-DIO-mCherry (n = 7) vectors were bilaterally microinjected into the MBH of SlugΔLepRb male mice (Slugfl/fl; LepRb-Cre+/+) on a chow diet. Twelve weeks later, mice were treated with leptin and body weight changes were measured. (D and E) Slugfl/fl and SlugΔLepRb males (8 weeks old, chow diet) were fasted overnight and treated with leptin (i.p., 1 mg/kg, 45 minutes). Hypothalamic extracts were immunoblotted with anti–phospho-Stat3 (pTyr705) and anti-Stat3 antibodies. Stat3 phosphorylation was normalized to Stat3 levels (n = 3 mice per group). a.u., arbitrary units. (F) AAV-CAG-DIO-Slug or AAV-CAG-DIO-mCherry vectors were bilaterally microinjected into the MBH of SlugΔLepRb (Slugfl/fl;LepRb-Cre+/–) males (9 weeks old, on chow diet). Two weeks later, the mice were treated with leptin (i.p., 1.2 mg/kg, 45 minutes). Hypothalamic extracts were immunoblotted with anti–phospho-Stat3 and anti-Stat3 antibodies. Stat3 phosphorylation was normalized to Stat3 levels (E, n = 3 mice per group). (G) Male hypothalamic LepR mRNA levels (normalized to 36B4 levels, 8 weeks old, chow diet, n = 8 mice per group). (H) Hypothalamic LepR mRNA levels 2 weeks after AAV transduction (normalized to 36B4 levels, n = 6 mice per group). AAV-CAG-DIO-Slug or AAV-CAG-DIO-mCherry vectors were bilaterally microinjected into the MBH of SlugΔLepRb (Slugfl/fl;LepRb-Cre+/–) male mice (9 weeks old, chow diet). (I) LepR promoter luciferase reporter activity (n = 3 per group). (J and K) Hypothalamic Slug occupancy on the LepR promoter (J) and hypothalamic LepR promoter H3K27me2, H3K3me3, and H3K27ac levels (K). Slug+/+ (n = 14) and Slug–/– (n = 14) males were fed a HFD for 14–16 weeks. Data are presented as mean ± SEM. *P < 0.05, 2-tailed unpaired Student’s t test (A, G, H, J, and K), 1-way (I) and 2-way ANOVA (B, C, and E).

References

    1. Locke AE, et al. Genetic studies of body mass index yield new insights for obesity biology. Nature. 2015;518(7538):197–206. doi: 10.1038/nature14177. - DOI - PMC - PubMed
    1. Friedman J. The long road to leptin. J Clin Invest. 2016;126(12):4727–4734. doi: 10.1172/JCI91578. - DOI - PMC - PubMed
    1. Jiang L, et al. Leptin receptor-expressing neuron Sh2b1 supports sympathetic nervous system and protects against obesity and metabolic disease. Nat Commun. 2020;11(1):1517. doi: 10.1038/s41467-020-15328-3. - DOI - PMC - PubMed
    1. Zhou Y, Rui L. Leptin signaling and leptin resistance. Front Med. 2013;7(2):207–222. doi: 10.1007/s11684-013-0263-5. - DOI - PMC - PubMed
    1. Morris DL, Rui L. Recent advances in understanding leptin signaling and leptin resistance. Am J Physiol Endocrinol Metab. 2009;297(6):E1247–E1259. doi: 10.1152/ajpendo.00274.2009. - DOI - PMC - PubMed

Publication types

MeSH terms